Elasticsearch Audit Logs and Analysis

Security is a top-of-mind topic for software companies, especially those that have experienced security breaches. This article will discuss how to set up Elasticsearch audit logging and explain what continuous auditing logs track.

Alternatively, platforms can use other tools like the cloud security platform offered by Coralogix instead of internal audit logging to detect the same events with much less effort. 

Companies must secure data to avoid nefarious attacks and meet standards such as HIPAA and GDPR. Audit logs record the actions of all agents against your Elasticsearch resources. Companies can use audit logs to track activity throughout their platform to ensure usage is valid and log when events are blocked. 

Elasticsearch can log security-related events for accounts with paid subscriptions. Elasticsearch audit provides logging of events like authentications and data-access events, which are critical to understanding who is accessing your clusters, and at what times. You can use machine learning tools such as the log analytics tool from Coralogix to analyze audit logs and detect attacks.

Turning on Audit Logging in Elasticsearch

Audit General Settings

Audit logs are off by default in your Elasticsearch node. They are turned on by configuring the static security flag in your elasticsearch.yml (or equivalent .yml file). Elasticsearch requires this setting for every node in your cluster. 

xpack.security.audit.enabled=true

Enabling audit logs is currently the only static setting needed. Static settings are only applied, or re-applied, to unstarted or shut down nodes. To turn on Elasticsearch audit logs, you will need to restart any existing nodes.

Audit Event Settings

You can decide what events are logged on each Elasticsearch node in your cluster. Using the events.include or events.exclude settings, you can decide which security events Elasticsearch logs into its’ audit file. Using _all as your include setting will track everything. The exclude setting can be convenient when you want to log all audit event types except one or two.

xpack.security.audit.logfile.events.include=[_all]
xpack.security.audit.logfile.events.exclude=[run_as_granted]

You can also decide if the request body that triggered the audit log is included in the audit event log. By default, this data is not available in audit logs. If you need to audit search queries, use this setting, so the queries are available for analysis.

xpack.security.audit.logfile.events.emit_request_body=true

Audit Event Ignore Policies

Ignore policies allow you to search for audit events that you do not want to print. Use the policy_name value to link configurations together and form a policy with multiple settings. Elasticsearch does not print events that match all conditions in a policy.

Each of the ignore filters uses a list of values or wildcards. Values are known data for the given type.

xpack.security.audit.logfile.events.ignore_filters.<policy_name>.users=[*]
xpack.security.audit.logfile.events.ignore_filters.<policy_name>.realms=[*]
xpack.security.audit.logfile.events.ignore_filters.<policy_name>.actions=[*]
xpack.security.audit.logfile.events.ignore_filters.<policy_name>.roles=[*]
xpack.security.audit.logfile.events.ignore_filters.<policy_name>.indices=[*]

Node Information Inclusion in Audit Logs

Information about the node can be included in each audit log event. Each of the following settings is used to turn on one of the pieces of information that are available. By default, all are excluded except the node id value. Optional node data includes the node name, the node IP address, the node’s host name, and the node id.

xpack.security.logfile.emit_node_name=true
xpack.security.logfile.emit_node_host_address=true
xpack.security.logfile.emit_node_host_name=true
xpack.security.logfile.emit_node_id=true

Information Available in Elasticsearch Audit

Elasticsearch audit events are logged into a single JSON file. Each audit event is printed on a single line with no end-of-line delimiter. The format of the file is similar to a CSV in that it was meant to have columns. There are fields within it that follow JSON formatting with an ordered dot notation syntax containing any non-null string. The purpose was to make the file more easily readable by people as opposed to machines. 

An example of an Elasticsearch audit log is below. In it, there are several fields that are needed for analysis. For a complete list of the audit logs available, see the Elasticsearch documentation.

{"type":"audit", "timestamp":"2021-06-23T07:51:31,526+0700", "node.id":
"1TAMuhilWUVv_hBf2H7yXW", "event.type":"ip_filter", "event.action":
"connection_granted", "origin.type":"rest", "origin.address":"::3",
"transport.profile":".http", "rule":"allow ::1,127.0.0.1"}

The event.type attribute shows the internal layer that generated the audit event. This may be rest, transport, ip_filter, or security_config_change. The event.action attribute shows what kind of event occurred. The actions available depend on the event.type value, with security_config_change types having a different list of available actions than the others. 

The origin.address attribute shows the IP address at the source of the request. This IP address may be of the remote client, the address of another cluster, or the local node. In cases where the remote client connects to the cluster directly, you will see the remote IP address here. Otherwise, the address is listed with the first OSI layer 3 proxy in front of the cluster. The origin.type attribute shows the type of request made originally. This could be rest, transport, or local_node.

Where Elasticsearch Stores Audit Logs

A single log file is created for each node in your Elasticsearch cluster. Audit log files are written only to a local filesystem to keep the file secure and ensure durability. The default filename is <clustername>_audit.json

You can configure Filebeat in the ELK stack to collect events from the JSON file and forward them to other locations, such as back to an Elasticsearch index or into Logstash. Filebeat replaced the older model of Elasticsearch, where audit logs were sent directly to an index without queuing. This model caused logs to be dropped if the index rate of the audit log index was lower than the rate of incoming logs. 

This index ideally will be on a different node and cluster than where the logs were generated. Once the data is in Elasticsearch, it can be viewed on a Kibana audit logs dashboard or sent to another source such as the Coralogix full-stack observability tool, which can ingest data from Logstash. 

Configuring Filebeat to Write Audit Logs to Elasticsearch

After the Elasticsearch audit log settings are configured, you can configure the Filebeat settings to read those logs.

Here’s what you can do:

  1. Install Filebeat
  2. Enable the Elasticsearch module, which will ingest and parse the audit events
  3. Optionally customize the audit log paths in the elasticseach.yml file within the modules.d folder. This is necessary if you have customized the name or path of the audit log file and will allow Filebeat to find the logs.
  4. Specify the Elasticsearch cluster to index your audit logs. Add the configuration to the output.elasticsearch section of the filebeat.yml file
  5. Start Filebeat

Analysis of Elasticsearch Audit Logs

Elasticsearch audit logs hold information about who or what is accessing your Elasticsearch resources. This information is required for compliance through many government information standards such as HIPAA. In order for the data to be useful in a scalable way, analysis and visualization are also needed.

The audit logs include events such as authorization successes and failures, connection requests, and data access events. They can also include search query analysis when the emit_request_body setting is turned on. Using this data, professionals can monitor the Elasticsearch cluster for nefarious activity and prevent data breaches or reconstruct events. The completeness of the event type list means that with the analysis you can follow any given entity’s usage on your cluster.

If automatic streaming is available from Logstash or Elasticsearch, audit logs can be sent to other tools for analysis. Automatic detection of suspicious activity could allow companies to stop data breaches. Tools such as Coralogix’s log analysis can provide notifications for these events.

How does Coralogix fit in?

With Coralogix, you can send logs with our log analytics tool. This tool uses machine learning to find where security breaches are occurring in your system. You can also set up the tool to send notifications when suspicious activity is detected. 

In addition, the Coralogix security platform allows users to bypass the manual setup of Elasticsearch audit logging by detecting the same access events. This platform is a Security as Code tool that can be linked directly to your Elasticsearch cluster and will automatically monitor and analyze traffic for threats.

Summary

Elasticsearch audit logs require a paid Elasticsearch subscription and manual setup. The logs will track all requests made against your Elasticsearch node and log them into a single, locally stored JSON file. Your configuration determines what is and is not logged into the audit file. 

Your locally-stored audit file was formatted with the intention of being human-readable. However, reading this file is not a scalable or recommended security measure. You can stream audit logs to other tools by setting up Filebeat.

Elasticsearch Release: Roundup of Changes in 7.13.3

Elastic made their latest minor Elasticsearch release on May 25, 2021. Elasticsearch Version 7.13 contains the rollout of several features that were only in preview in earlier versions. There are also enhancements to existing features, critical bug fixes, and some breaking changes of note.

Three more patches have been released on the minor version, and more are expected before releasing the next minor version. 

A quick note before we dive into the new features and updates: The wildcard function in Event Query Language (EQL) has been deprecated. Elastic recommends using like or regex keywords instead.

Users can find a complete list of release notes on the Elastic website.

New Features

Combined Fields search

The combined_fields query is a new addition to the search API. This query supports searching multiple text fields as though their contents were indexed in a single, combined field. The query automatically analyzes your query as individual terms and then looks for each term in any of the requested fields. This feature is useful when users are searching for text that could be in many different fields.

Frozen Tier

Elastic defines several data tiers. Each tier is a collection of nodes with the same role and typically the same hardware profile. The new frozen tier includes nodes that hold time-series data that are rarely accessed and never updated. These are kept in searchable snapshots. Indexed content generally starts in the content or hot tiers, then can cycle through warm, cold, and frozen tiers as the frequency of use is reduced over time.

The frozen tier uses partially mounted indices to store and load data from a snapshot. Storage and operating costs are reduced by this storage method but still allows you to search the data, albeit with a slower response. Elastic improves the search experience by retrieving minimal data pieces necessary for a query. For more information about the Frozen tier and how to query it, see this Elastic blog post.

IPv4 and IPv6 Address Matching

Painless expressions can match IPv4 and IPv6 addresses automatically against Classless Inter-Domain Routing (CIDR) ranges. When a range is defined, you can use the painless contains script to determine if the input IP address falls within the range. This is very useful for grouping and classifying IP addresses when using Elastic for security and monitoring.

Index Runtime Fields

Runtime fields are fields in your document that are formed based on the source context. These fields can be defined by the search query or by the index mapping itself. Defining the field in the index mapping will give better performance. 

Runtime fields are helpful when you need to search based on some calculated value. For example, if you have internal error codes, you may want to return specific text related to the code. Without storing the associated text, a runtime field can be used to translate a numerical code to an associated text string with a runtime field.

Further, the runtime can be updated by reindexing the document with a newly formed runtime field. This makes updating much more straightforward than having to update each document with new text.

Aliases for Trained Models

Aliases for Elasticsearch indices have been present since version 1. They are a convenient way to allow functions to point to different data sets independent of the index name. For example, you may wish to have versions of your index. Using an alias, you can always fetch whatever version of the data has a logical value by assigning it an alias.

Aliases are now also available for trained models. Trained models are machine learning algorithms that have been run against a sample set. The existing, known data have trained the output algorithm to give some output. This algorithm can then be applied to new, unknown data, theoretically classifying it in the same way expected for known data. Standard algorithms may include classification analysis or regression analysis. 

Elastic now allows you to apply an alias to your trained models like you could already do for indices. The new model_alias API, allows users to insert and update aliases on your trained models. This alias can make it easier to apply specific algorithms for data sets by allowing users to logically alias the machine learning algorithms.

Fields added to EQL search

Event Query Language (EQL) is a language explicitly used for searching event time-based data. Typical uses include log analytics, time-series data processing, and threat detection. 

In Elasticsearch 7.13.0, developers added the fields parameter as an alternative to the _source parameter. The fields option extracts values from the index mapping while _source accesses the original data sent at index time. The fields option is recommended by Elastic because it:

  • returns values in a standardized way according to its mapping type, 
  • accepts both multi-fields and field aliases, 
  • formats dates and spatial types according to inputs, 
  • returns runtime field values, and 
  • can also return fields calculated by a script at index time.

Log analytics on Elastic can be tricky to set up. Third-party tools, like Coralogix’s log analytics platform, exist to help you analyze data without any complex setup. 

Audit Events Ignore Policies

Elasticsearch can log security-related events if you have a paid subscription account. Audit events provide logging of different authentication and data access events that occur against your data. The logs can be used for incident responses and demonstrating regulatory compliance. With all the events available, the logs can bog down performance due to the volume of logs and amount of data. 

In Elastic Version 7.13, Elastic introduced audit events ignore policies, so users can choose to suppress logging for certain audit events. Setting the ignore policies involves creating rules with match audit events to ignore and not print.

Enhancements

Performance: Improved Speed of Terms Aggregation

The terms aggregation speed has been improved under certain circumstances. These are common to time series and particularly when the data is in cold or frozen storage tiers. The following are cases where Elastic has improved aggregation speed:

  • The data has no parent or child aggregations
  • The indices have no deleted documents
  • There is no document-level security
  • There is no top-level query
  • The field has global ordinals (like keyword or ip field)
  • There are less than a thousand distinct terms.

Security: Prevention of Denial of Service Attack

The Elasticsearch Grok parser contained a vulnerability that nefarious users could exploit to produce a denial of service attack. Users with arbitrary query permissions could create Grok queries that would crash your Elasticsearch node. This security flaw is present in all Elasticsearch versions before 7.13.3. 

Bug Fixes

Default Analyzer Overwrites Index Analyzer

Elasticsearch uses analyzers to determine when a document matches search criteria. Analyzers are used to search for text fields in your index. In version 7.12, a bug was introduced where Elasitcsearch would use the default analyzer (a standard analyzer) on all searches.

According to documentation, the analyzer configured in the index mapping should be used, with the default only being used if none was configured. In version 7.13, this bug was fixed, so the search is configured to use the index analyzer preferentially.

Epoch Date Timezone Formatting with Composite Aggregations

Composite aggregations are used to compile data into buckets from multiple sources. Typical uses of this analysis would be to create graphs from a compilation of data. Graphs may also include time as a method to collect data into the same set. If the user required a timezone to be applied, Elasticsearch behaved incorrectly when stored times were Epoch.

Epoch datetimes are always listed in UTC. Applying a timezone requires formatting the date which was not previously applied internally in Elasticsearch. This bug was resolved in version 7.13.3

Fix Literal Projection with Conditions in SQL

SQL queries can use literal selections in combination with filters to select data. For example, the following statement uses a literal selection genre and a filter record:

SELECT genre FROM music WHERE format = ‘record’

Elasticsearch was optimizing to use a local relation in error. This error caused only a single record to be returned even if multiple records match the filter. Version 7.13.3 fixed this issue which was first reported in November 2020. 

Summary

Elastic pushed up many new features, bug fixes, and enhancements in version 7.13 and has continued to apply small changes through version 7.13.3. The significant new features of note support a frozen storage tier, including ignoring policies for audit events and index runtime fields.

For a complete list of new features, see the Elastic release notes.

Elasticsearch Text Analysis: How to Use Analyzers and Normalizers

Elasticsearch is a distributed search and analytics engine used for real-time data processing of several different data types. Elasticsearch has built-in processing for numerical, geospatial, and structured text values.

Unstructured text values have some built-in analytics capabilities, but custom text fields generally require custom analysis. Built-in text analysis uses analyzers provided by Elasticsearch, but customization is also possible.

Elasticsearch uses text analysis to convert unstructured text data into a searchable format. Analyzers and normalizers can be user-configurable to ensure users get expected search results for custom, unstructured text fields.  

What is text analysis, and why is it important?

Text analysis provided by Elasticsearch makes large data sets digestible and searchable. Search engines use text analysis to match your query to thousands of web pages that might meet your needs. 

Typical cases of text search in Elasticsearch include building a search engine, tracking event data and metrics, visualizing text responses, and log analytics. Each of these could require unstructured text fields to be gathered logically to form the final data used.

Elasticsearch has become a go-to tool for log storage since microservices have become popular. It can serve as a central location to store logs from different functions so that an entire system can be analyzed together.

You can also plug Elasticsearch into other tools that already have metrics and analytics set up to skip the need to do further analysis with your Elasticsearch query results. Coralogix provides an Elastic API to ingest Elasticsearch data for this purpose.

What is an Elasticsearch Analyzer?

An analyzer in Elasticsearch uses three parts: a character filter, a tokenizer, and a token filter. All three together can configure a text field into a searchable format. The text values can be single words, emails, or program logs.

Character Filter

A character filter will take the original text value and look at each character. It can add, remove or change characters in the string. These changes could be useful if you need to change characters between languages that have different alphabets.

Analyzers do not require character filters. You may also want to have multiple analyzers for your text which is allowed. Elasticsearch applies all character filters available in the order you specify.

Tokenizer

A token is a unit of text which is then used in searches. A tokenizer will take a stream of continuous text and break it up into tokens. Tokenizers will also track the order and position of each term in the text, start and end character offsets, and token type.

Position tracking is helpful for word proximity queries, and character offsets are used for highlighting. Token types indicate the data type of the token (alphanumeric, numerical, etc.). 

Elasticsearch provides many built-in tokenizers. These include different ways to split phrases into tokens, partial words, and keywords or patterns. See Elasticsearch’s web page for a complete list.

Elasticsearch analyzers are required to use a tokenizer. Each analyzer may have only a single tokenizer.

Token Filter

A token filter will take a stream of tokens from the tokenizer output. It will then modify the tokens in some specific way. For example, the token filter might lowercase all the letters in a token, delete tokens specified in the settings, or even add new tokens based on the existing patterns or tokens. See Elasticsearch’s web page for a complete list of built-in token filters.

Analyzers do not require token filters. You could have no token filters or many token filters that provide different functionality.

What is an Elasticsearch Normalizer?

A normalizer works similarly to analyzers in that it tokenizes your text. The key difference is that normalizers can only emit a single token while analyzers can emit many. Since they only emit one token, normalizers do not use a tokenizer. They do use character filters and token filters but are limited to using those that work at a single character at a time.

What happens by default?

Elasticsearch applies no normalizer by default. These can only be applied to your data by adding them to your mapping before creating your index. 

Elasticsearch will apply the standard analyzer by default to all text fields. The standard analyzer uses grammar-based tokenization. Words in your text field are split wherever a word boundary, such as space or carriage return, occurs.

Example of Elasticsearch Analyzers and Normalizers

Elasticsearch provides a convenient API to use in testing out your analyzers and normalizers. You can use this to quickly iterate through examples to find the right settings for your use case.

Inputs set up custom analyzers or normalizers, or you can use the current index configurations to test them out. Some examples of analyzers and normalizers are provided below to show what can be done in Elasticsearch. Outputs show what tokens are created with the current settings.

HTML Normalizers

Use the HTML Strip character filter to convert HTML text into plain text. You can optionally combine this with the lowercase token filter to not consider the casing in your search. Note that normalizers only output a single token using the filter and char_filter settings.

Email Analyzers

Use the built-in email tokenizer to create a token with type <EMAIL>. This can be useful when searching large bodies of text for emails. The following example shows an email token is present when only an email is used in the text. However, the same token is found when the email input is surrounded by other text. In that case, multiple tokens are returned, one of them being the email. 

An Email analyzer can also be made with a custom filter. The filter in the following example will split your data on specific characters common to email addresses. This principle can be applied to any data with common characters or patterns (like data logs). A token is created for each section of text divided by the regex characters described in the filter.

Summary

Elasticsearch analyzers and normalizers are used to convert text into tokens that can be searched. Analyzers use a tokenizer to produce one or more tokens per text field. Normalizers use only character filters and token filters to produce a single token. Tokens produced can be controlled by setting requirements in your Elasticsearch mapping. 

Elasticsearch indices become readily searchable when analyzers are appropriately used. A common use-case for Elasticsearch is to store and analyze console logs. Elasticsearch indices can be imported by tools like Coralogix’s log analytics platform. This platform can take logs stored in your index and convert them into user-readable and actionable insights that allow you to support your system better.

How to Optimize Your Elasticsearch Queries Using Pagination

Consider for a moment that you are building a webpage that displays data stored in Elasticsearch. You have so much information in your index that your API Gateway cannot handle it all at once. What you’ll need to do is paginate your results so that the client can have a predictable amount of data returned each time.

Before paginating your results with your client, you will need to know how to paginate data in your backend storage. Most data storage solutions include functions enabling users to sort, filter, and paginate data. Elasticsearch is no different.

Your requirements and data structure will be crucial in deciding which method best suits your needs. Elasticsearch provides three ways of paginating data that are each useful: 

  • From/Size Pagination
  • Search After Pagination
  • Scroll Pagination

Let’s look at how these different types of pagination work:

From/Size Pagination

This Elasticsearch query shows how you can get the third page of data using from/size pagination. Assuming all the pages are 25 documents long, this search will return documents starting at the 50 and going to the 75.

The example below uses Elasticsearch’s search API that will look at all documents in the index. You could also filter or sort the records to keep the results consistent for viewing.

GET https://localhost:XXXX/your-index-name/_search

{

    "size": 25,

    "from": 50,

    "query": {

        "match_all": {}

    }

}


The Simplest to Implement

The simplest method of pagination uses the from and size parameters available in Elasticsearch’s search API. By default, from is 0 and size is 10, meaning if you don’t specify otherwise, Elasticsearch will return only the first ten results from your index. 

Change the from and size input values to get different pages of data. The from variable represents which document will start the page, and the size variable describes how many documents your search will return.

Great for Small Data Sets

If you have a large data set (more than 10,000 documents), from/size pagination is not ideal for you. You can use this up to 10,000 records without changes, and you can also increase this window to a higher number if you choose.

However, this value is used as a safeguard to protect against degraded performance or even failures. Elasticsearch must load all the data from the requested documents and any documents from previous pages behind the scenes. These documents can span multiple shards in your Elasticsearch cluster as well. As you get deeper into your data set, the operations must grow in size, causing issues.

May Miss Returning Documents

If you have a constantly or unpredictably changing dataset, you do not want to use this Elasticsearch pagination method to return all data. When you update a document, Elasticsearch will reindex it, potentially causing a change in documents’ order.

The addition or removal of a document will also change which hits are adjacent in the index. Since from/size pagination relies on documents’ location in an index, the reordering will mean returning duplicates of some documents and missing others. If you are displaying data on your webpage, the pages won’t always contain the same data, leading to a poor user experience.

Scroll Pagination

To perform scroll pagination, you must first perform a search using Elasticsearch’s search API. The first search includes a parameter indicating that a scroll will take place. The results will include a ‘scroll_id’ along with the results of the search request. 

POST https://localhost:9200/test-index-v1/_search?scroll=5m

{

    "size": 25,

    "query": {

        "match_all": {}

    }

}


Send subsequent calls to a different Elasticsearch API called scroll. The input only includes the scroll_id and an optional time to keep the scroll index alive. This scroll will get the next page of data and return new scroll_id values as long as there are more pages to collect. 

POST https://localhost:9200/_search/scroll

{

    "scroll": "5m",

    "Scroll_id":"scroll_id string returned from search"

}


Preserves the Index State While You Search

The benefit to using scroll over From/size pagination is scroll’s ability to freeze or preserve the index in time for your search. The scroll API’s response includes a scroll_id. Subsequent calls to the search API use that identifier, so Elasticsearch returns only document versions existing when the scroll initialization occurred.

Freezing the index version fixes the issue seen in from/size pagination that can cause developers to miss data in their index.

Uses Significant Memory Resources

Background processes in Elasticsearch will merge smaller segments into larger ones to keep the index number relatively small. Elasticsearch deletes smaller segments after merging, and once the smaller segments are not needed. Open scrolls will block the smaller segments’ deletion since they are used to return the scroll data. Developers need to ensure they have adequate free file handles and disk space to support using the scroll API.

Elasticsearch must track which documents exist to return your data’s correct version when you use the scroll API. Saved versions are stored in the search context and need heap space. Elasticsearch sets a maximum number of open scrolls to prevent issues from arising with too many open scrolls. However, you will still need to ensure you manually close scrolls or allow them to timeout and delete automatically to preserve heap space. 

Get All Documents From an Extensive Index

If you are doing some processing that requires you to get each document, the scroll API is an acceptable option. You will be able to loop through each document in your index and have confidence Elasticsearch will return all the existing documents.

Scroll pagination does not limit the number of documents like from/size pagination so that you can get more than the 10,000 document limit. Ensure you set a short timeout for your scroll, or manually remove it after your processing is complete to avoid memory issues.

Good Choice for AWS Elasticsearch Users

AWS’s integration with Elasticsearch only supports up to version 7.9. The now-recommended search_after using point-in-time integrations is a new feature available on Elasticsearch version 7.10.

Since the recommended Elasticsearch pagination method is not available, AWS users should use scroll instead since it was the recommended method for lower versions.

search_after Pagination

Two versions of search_after pagination exist. Both have similar requirements for the body of the search: the sort input is required. When you use a sort array in the input to the search API, the results will contain a sort value. This value should be used in the search_after value of the subsequent query to get the next page of results.

The search below shows how to get the second group of 25 hits in an index assuming an integer value testInt exists and is incremented by one in each document.

POST https://localhost:9200/test-index-v1/_search

{

    "size": 25,

    "query": {

        "match_all": {}

    },

    "sort": [

        {

            "testInt": "asc"

        }

    ],

    "search_after": [25]

}


Like with from/size pagination, if the index is refreshed during your search, the order of documents may change, leading to inconsistent viewing of data and possibly skipping over documents. New in Elasticsearch version 7.10 is a point in time (PIT) API to avoid this sissue.

To use it, first request a PIT using the command below. Then, add the returned PIT to your query. 


POST https://localhost:9200/test-index-v1/_pit?keep_alive=1m  


Use search_after Alone to Paginate Deeply

Use the search API with a sort input to paginate through indices, including those with more than 10,000 records. Use the sort response from the last hit as the search_after input to the next search API call. Elasticsearch will use the search_after input to find the following document in the index and return it first on the next page. 

Elasticsearch does not freeze the index with this command. If your data is changing during your search, you may miss documents as you paginate through your index, or your pages will not contain consistent data.

Can Preserve the Index State Using Point In Time API

The point in time (PIT) API is available as of ELK version 7.10. By default, search requests will execute against the most recent data in your index. The PIT API will create a view of the index at a given time, which developers can search.

The PIT API is functionally similar to scroll, but it is much more lightweight, making it preferable to use. Using PIT means your pages will be consistent even if your data changes while you search.

Preferred Method of Pagination

Elasticsearch recommended using search_after with the PIT API for paginated searches that involve more than 10,000 documents and that preserve index state. Before version 7.10, the scroll API was the only method available that could do this. Be aware that AWS’s Elasticsearch implementation does not support Elasticsearch 7.10 yet, so developers will still need to use scroll for now.

Guidelines For Optimizing Elasticsearch Pagination

We have reviewed several limitations of the different available Elasticsearch pagination methods available. Which method you use depends on your requirements and your data. 

  • Do you need to paginate over more than 10,000 documents? If so, you should use search_after or scroll.
  • Do you need to keep the page contents consistent? If so, use search_after with the point in time API. 
  • Do you need to keep the page contents consistent but do not have access to ELK version 7.10? If so, use the scroll API.
  • Do you need to support multiple searches at once? If so, you should avoid using scroll because of its high memory requirements.

Developers may use these principles when using a SaaS API to Elasticsearch like Coralogix’s Elastic API. This service allows you to have direct access to your Elasticsearch data, but also integrate tools to analyze and troubleshoot your data.

Metricbeat Deep Dive: Hands-On Metricbeat Configuration Practice

Metricbeat, an Elastic Beat based on the libbeat framework from Elastic, is a lightweight shipper that you can install on your servers to periodically collect metrics from the operating system and from services running on the server. Everything from CPU to memory, Redis to NGINX, etc… Metricbeat takes the metrics and statistics that it collects and ships them to the output that you specify, such as Elasticsearch or Logstash.

In this post, we will cover some of the main use cases Metricbeat supports and we will examine various Metricbeat configuration use cases.

Metricbeat Installation

Metricbeat installation instructions can be found on the Elastic website.

Metricbeat Configuration

To configure Metricbeat, edit the configuration file. The default configuration file is called metricbeat.yml. The location of the file varies by platform. For rpm and deb, you’ll find the configuration file at this location /etc/metricbeat. There’s also a full example configuration file at /etc/metricbeat/metricbeat.reference.yml that shows all non-deprecated options.

The Metricbeat configuration file uses YAML for its syntax as it’s easier to read and write than other common data formats like XML or JSON. The syntax includes dictionaries, an unordered collection of name/value pairs, and also supports lists, numbers, strings, and many other data types.

All members of the same list or dictionary must have the same indentation level. Lists and dictionaries can also be represented in abbreviated form, which is somewhat similar to JSON using {} for dictionaries and [] for lists. For more info on the config file format.

The Metricbeat configuration file consists, mainly, of the following sections. More information on how to configure Metricbeat can be found here.

  1. The Modules configuration section can help with the collection of metrics from various systems.
  2. The Processors section is used to configure processing across data exported by Metricbeat (optional). You can define a processor globally at the top-level in the configuration or under a specific module so the processor is applied to the data collected for that module.
  3. The Output section determines the output destination of the processed data.

There are other sections you may include in your YAML such as a Kibana endpoint, internal queue, etc. You may view them and their different options at the configuring Metricbeat link. Each of the sections has different options and there are numerous module types, processors, different outputs to use, etc…

In this post, I will go over the main sections you may use and focus on giving examples that worked for us here at Coralogix.

Modules

The Modules section defines the Metricbeat input, the metrics that will be collected by Metricbeat, each module contains one or multiple metric sets. There are various module types you may use with Metricbeat, you can configure modules in the modules.d directory (recommended), or in the Metricbeat configuration file. In my examples, I’ll configure the module in the Metricbeat configuration file. Here is an example of the System module. For more info on configuring modules and module types.

#============================= Metricbeat Modules =============================
metricbeat.modules:
- module: system
  metricsets:
    - cpu # CPU usage
    - load # CPU load averages
    - memory # Memory usage
    - network # Network IO
    #- core # Per CPU core usage
    #- diskio # Disk IO
    #- filesystem # File system usage for each mountpoint
    #- fsstat # File system summary metrics
    #- raid # Raid
    #- socket # Sockets and connection info (linux only)
    #- service # systemd service information
  enabled: true
  period: 10s

There are some more options to this module type as you can observe in the full example config file. These are all the available metric sets with the system module type, the enable parameter is optional, by default if not specified it is set to true and the period parameter is setting how often the metric sets are executed. This setting is required for all module types. You may include multiple module types, all in the same YAML configuration. If you are working with Coralogix and wish to send your metrics to your Coralogix account you will have to include the fields parameter with our required fields, this is beside the fact you need to choose our Logstash endpoint in your config output, we will see a similar example later.

Processors

You can use Processors in order to process events before they are sent to the configured output. The libbeat library provides processors for reducing the number of exported fields, performing additional processing and decoding, etc… Each processor receives an event, applies a defined action to the event, and returns the event. If you define a list of processors, they are executed in the order they are defined in the configuration file. This is an example of several processors configured. For more information on filtering and enhancing your data.

# ================================= Processors =================================

# Processors are used to reduce the number of fields in the exported event or to
# enhance the event with external metadata. This section defines a list of
# processors that are applied one by one and the first one receives the initial
# event:
#
#   event -> filter1 -> event1 -> filter2 ->event2 ...
#
# The supported processors are drop_fields, drop_event, include_fields,
# decode_json_fields, and add_cloud_metadata.
#
# For example, you can use the following processors to keep the fields that
# contain CPU load percentages, but remove the fields that contain CPU ticks
# values:
#
processors:
  - include_fields:
      fields: ["cpu"]
  - drop_fields:
      fields: ["cpu.user", "cpu.system"]
#
# The following example drops the events that have the HTTP response code 200:
#
processors:
  - drop_event:
      when:
        equals:
          http.code: 200
#
# The following example renames the field a to b:
#
processors:
  - rename:
      fields:
        - from: "a"
          to: "b"
#
# The following example enriches each event with the machine's local time zone
# offset from UTC.
#
processors:
  - add_locale:
      format: offset
#
# The following example enriches each event with host metadata.
#
processors:
  - add_host_metadata: ~
#
# The following example decodes fields containing JSON strings
# and replaces the strings with valid JSON objects.
#
processors:
  - decode_json_fields:
      fields: ["field1", "field2", ...]
      process_array: false
      max_depth: 1
      target: ""
      overwrite_keys: false
#
# The following example copies the value of message to message_copied
#
processors:
  - copy_fields:
      fields:
        - from: message
          to: message_copied
      fail_on_error: true
      ignore_missing: false
#
# The following example preserves the raw message under event_original, which then cut at 1024 bytes
#
processors:
  - copy_fields:
      fields:
        - from: message
          to: event_original
      fail_on_error: false
      ignore_missing: true
  - truncate_fields:
      fields:
        - event_original
      max_bytes: 1024
      fail_on_error: false
      ignore_missing: true
#
# The following example URL-decodes the value of field1 to field2
#
processors:
  - urldecode:
      fields:
        - from: "field1"
          to: "field2"
      ignore_missing: false
      fail_on_error: true
#
# The following example is a great method to enable sampling in Metricbeat, using Script processor
#
processors:
  - script:
      lang: javascript
      id: my_filter
      source: >
        function process(event) {
            if (Math.floor(Math.random() * 100) < 50) {
              event.Cancel();
            }
        }

Metricbeat offers more types of processors as you can see here and you may also include conditions in your processor definition. If you use Coralogix, you have an alternative to Metricbeat Processors, to some extent, as you can set different kinds of parsing rules through the Coralogix UI instead. If you are maintaining your own ELK stack or other 3rd party logging tool you should check for processors when you have any need for parsing.

Output

You configure Metricbeat to write to a specific output by setting options in the Outputs section of the metricbeat.yml config file. Only a single output may be defined. In this example, I am using the Logstash output. This is the required option if you wish to send your logs to your Coralogix account, using Metricbeat. For more output options.

# ================================= Logstash Output =================================
output.logstash:
  # Boolean flag to enable or disable the output module.
  enabled: true

  # The Logstash hosts
  hosts: ["localhost:5044"]

  # Configure escaping HTML symbols in strings.
  escape_html: true

  # Number of workers per Logstash host.
  worker: 1

  # Optionally load-balance events between Logstash hosts. Default is false.
  loadbalance: false

  # The maximum number of seconds to wait before attempting to connect to
  # Logstash after a network error. The default is 60s.
  backoff.max: 60s

  # Optional index name. The default index name is set to filebeat
  # in all lowercase.
  index: 'filebeat'

  # The number of times to retry publishing an event after a publishing failure.
  # After the specified number of retries, the events are typically dropped.
  # Some Beats, such as Filebeat and Winlogbeat, ignore the max_retries setting
  # and retry until all events are published.  Set max_retries to a value less
  # than 0 to retry until all events are published. The default is 3.
  max_retries: 3

  # The maximum number of events to bulk in a single Logstash request. The
  # default is 2048.
  bulk_max_size: 2048

  # The number of seconds to wait for responses from the Logstash server before
  # timing out. The default is 30s.
  timeout: 30s

This example only shows some of the configuration options for the Logstash output, there are more. It’s important to note that when using Coralogix, you specify the following Logstash host: logstashserver.coralogixstg.wpengine.com:5044 under hosts and that some other options are redundant, such as index name, as it is defined by us.

At this point, we have enough Metricbeat knowledge to start exploring some actual configuration files. They are commented and you can use them as references to get additional information about different plugins and parameters or to learn more about Metricbeat.

Metricbeat Configuration Examples

Example 1

This example uses the system module to monitor your local server and send different metric sets. The Processors section includes a processor to drop unneeded beat metadata. The chosen output for this example is stdout.

#============================= Metricbeat Modules =============================
metricbeat.modules:
- module: system
  metricsets:
    - cpu             # CPU usage
    - load            # CPU load averages
    - memory          # Memory usage
    - network         # Network IO
  enabled: true
  period: 10s
# ================================= Processors =================================
processors:
  - drop_fields:
      fields: ["agent", "ecs", "host"]
      ignore_missing: true
#================================= Console Output =================================
output.console:
  pretty: true

Example 2

This example uses the system module to monitor your local server and send different metric sets, forwarding the events to Coralogix’s Logstash server (output) with the secured connection option. The Processors section includes a processor to sample the events to send 50% of the data.

#============================= Metricbeat Modules =============================
metricbeat.modules:
- module: system
  metricsets:
    - cpu             # CPU usage
    - load            # CPU load averages
    - memory          # Memory usage
    - network         # Network IO
  enabled: true
  period: 10s
#============================= General =============================
fields_under_root: true
fields:
  PRIVATE_KEY: "XXXXXXXX-XXXX-XXXX-XXXX-XXXXXXXXXXXX"
  COMPANY_ID: XXXXX
  APP_NAME: "metricbeat"
  SUB_SYSTEM: "system"
#================================= Processors =================================
processors:
# The following example is a great method to enable sampling in Filebeat, using Script processor. This script processor drops 50% of the incoming events
  - script:
      lang: javascript
      id: my_filter
      source: >
        function process(event) {
            if (Math.floor(Math.random() * 100) < 50) {
              event.Cancel();
            }
        }
#================================= Logstash output =================================
output.logstash:
  enabled: true
  hosts: ["logstashserver.coralogixstg.wpengine.com:5015"]
  ssl.certificate_authorities: ["/var/log/metricbeat/ca.crt"]

The Complete Guide to Elasticsearch Mapping

As Elasticsearch is gradually becoming the standard for textual data indexing (specifically log data) more companies struggle to scale their ELK stack. We decided to pick up the glove and create a series of posts to help you tackle the most common Elasticsearch performance and functional issues.

This post will help you in understanding and solving one of the most frustrating Elasticsearch issues – Mapping exceptions.

What is Elasticsearch Mapping?

Mapping in Elasticsearch is the process of defining how a document, and the fields it contains, are stored and indexed, each field with its own data type. Field data types can be, for example, simple types like text (string), long, boolean, or object/nested keys (which support the hierarchical nature of JSON).

Field mapping, by default, is set dynamically, meaning that when a previously unseen field is found in a document, Elasticsearch will add the new field to the type mapping and set its type according to its value.

For example, if this is our document: {“name”: “John”, “age”: 40, “is_married”: true}, the name field will be of type string, the age field will be of type long, and the is_married field will be of type boolean.

When the next log, containing any of these fields, will arrive, our Elasticsearch Index will expect the log fields to be populated with values of the same types as the ones that were determined previously in the initial mapping of our Index.

But what if it didn’t?

Elasticsearch Mapping Exceptions

Basically, the mapping determination is a race condition, the first key type to arrive at an index determines that key name type until the next index is created. Let’s take this log for example, {“name” : {“first“ : “John”, “second“ : “Smith”}, “age” : 40, “is_married” : 1}. The field “name” is actually a JSON object and the field “is_married” is now a number, this will result in the log causing two different mapping exceptions.

The log, in this case, will be discarded without being Indexed in Elasticsearch at all. We can consider this as data-loss, without having any indication of that incident besides the Elasticsearch log files, which will contain a mapping exception for each log (also impacting the cluster performance).

These scenarios happen more frequently when different programmers are working on the same projects, printing logs with the same fields’ names, only they are using a different set of values. How do we handle these mapping exceptions when we encounter them?

For starters, what you do not want to do is to manually change the type of the exceptions field (in our case ‘name‘) to object, existing field mappings cannot be updated. Changing the mapping would mean invalidating already indexed documents.

Instead, you should create a new index and then separate the ‘name‘ key to separate fields for strings and objects. E.g, assign objects to ‘name_object‘, and strings to ‘name‘. Thus, the mapping of the new index will have the two keys ‘name‘ and ‘name_object‘ which populate strings and objects respectively.

How we handle Mapping exceptions in Coralogix

Coralogix handles numeric Vs string mapping exceptions by dynamically adding a .numeric field to keys containing numbers that were previously mapped as a string.

In case Coralogix encounters a mapping exception it can’t handle (e.g Object Vs String, number Vs boolean, etc.), it stringifies the JSON and puts it under a newly generated key named ‘text‘. In either case, you won’t lose your data as a result of an exception.

In addition to that, Coralogix’s ingest engines add a ‘coralogix.failed_reason‘ key to any log that triggered a mapping exception so that our users can search, create alerts, or build visualizations to spot mapping exceptions and their root cause.

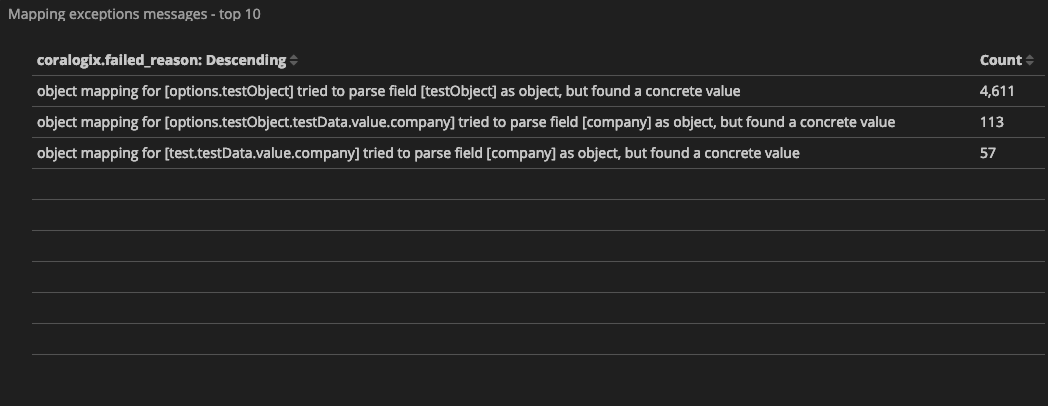
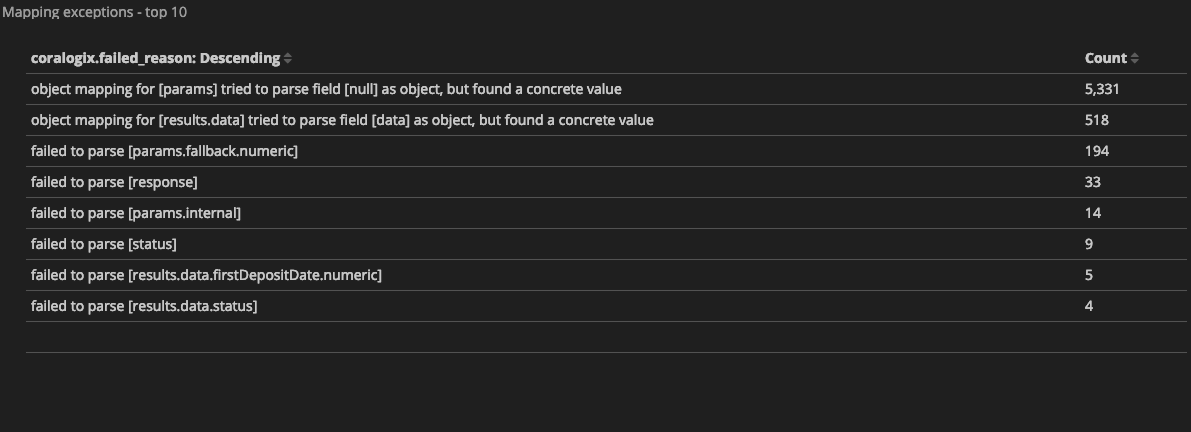
Each Coralogix client gets a predefined mapping exceptions dashboard that presents the number of logs that triggered mapping exceptions grouped by ‘coralogix.failed_reason‘ field, which describes the exception reason (find it under Kibana > dashboards > Mapping Exceptions Dashboard). Here are some examples of mapping exceptions message:

mapping exceptions failed reason table 1 Coralogix
mapping exceptions failed reason table 2 Coralogix

These are the actual messages ‘coralogix.failed_reason‘ key holds when a log input causes a mapping exception, and they tell us the story of what went wrong and of course, help us fix it.

Let’s investigate the following exception message: “object mapping for [results.data] tried to parse field [data] as object, but found a concrete value”.

From this message we can infer that ‘data’, which is a nested key within ‘results’, was initially mapped as an object and later arrived, numerous times, with a value of type string.

How can we fix the issue so the next log that will arrive with a string as the value for ‘data‘ won’t trigger an exception?

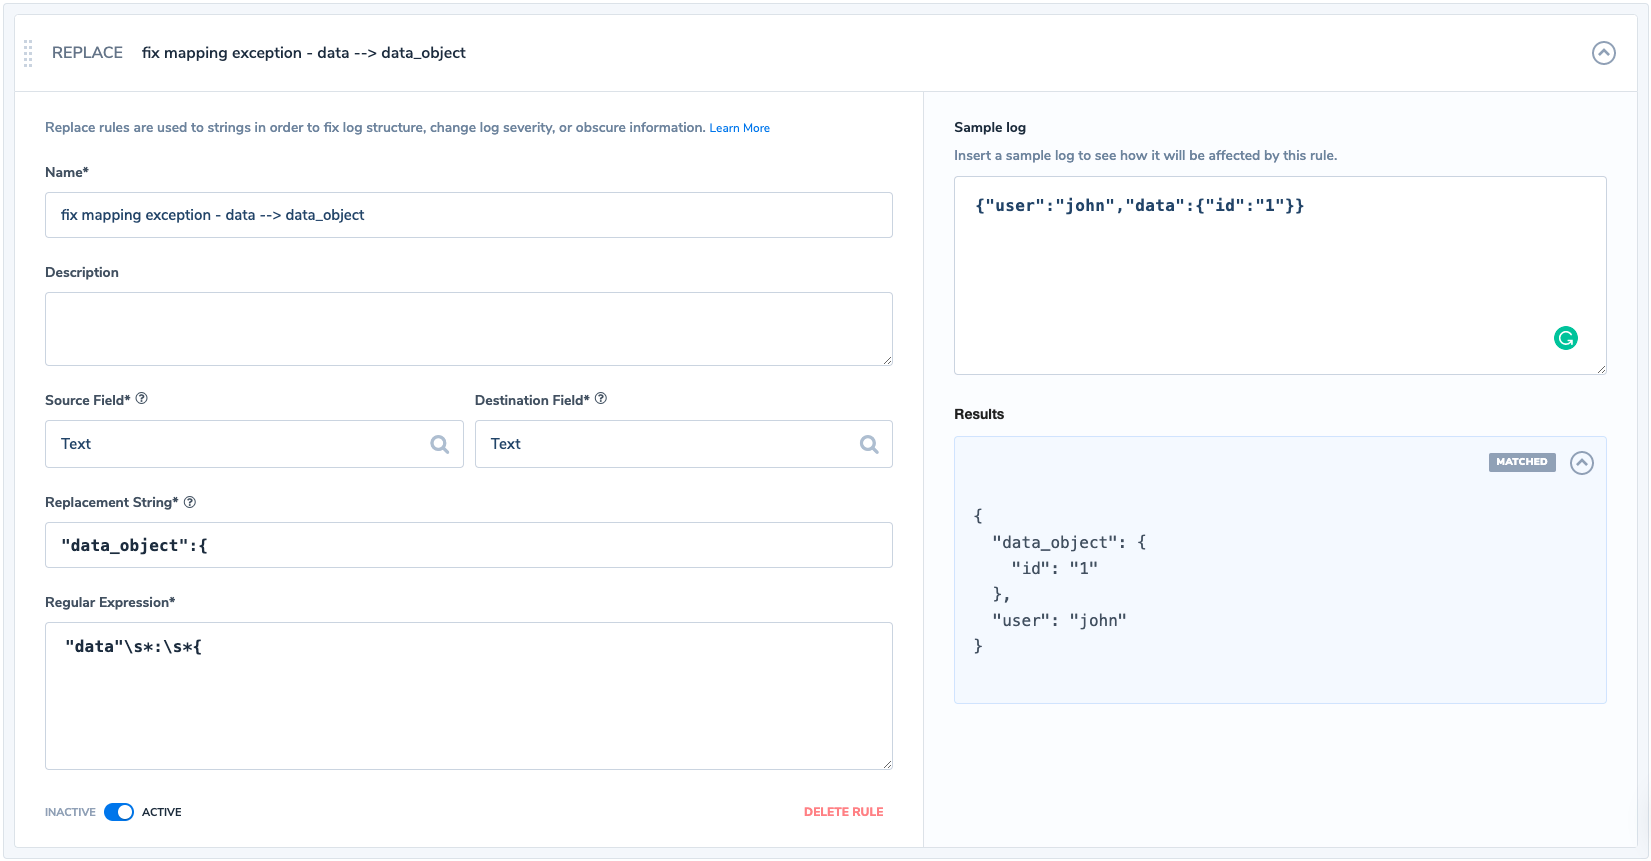
Coralogix offers a parsing rule engine. Among other useful parsing options, you can find the ‘Replace’ rule that enables the user to replace a given text, using REGEX, with a different one before the log is getting mapped and indexed in Elasticsearch.

What we would like to do is to use Regex and match any log entry that contains the ‘results.data field as an object (starts with an opening curly bracket) and replaces ‘data’ with’data_object’. Any similar occurrence from this point will assign the object to the new key ‘results.data_object‘.

This new key was created and added to the mapping of our index on the arrival of the first entry that matched after applying our rule. This is how our rule would look like in Coralogix:

  • REGEX: “data”s*:s*{
  • Replace To: “data_object”:{

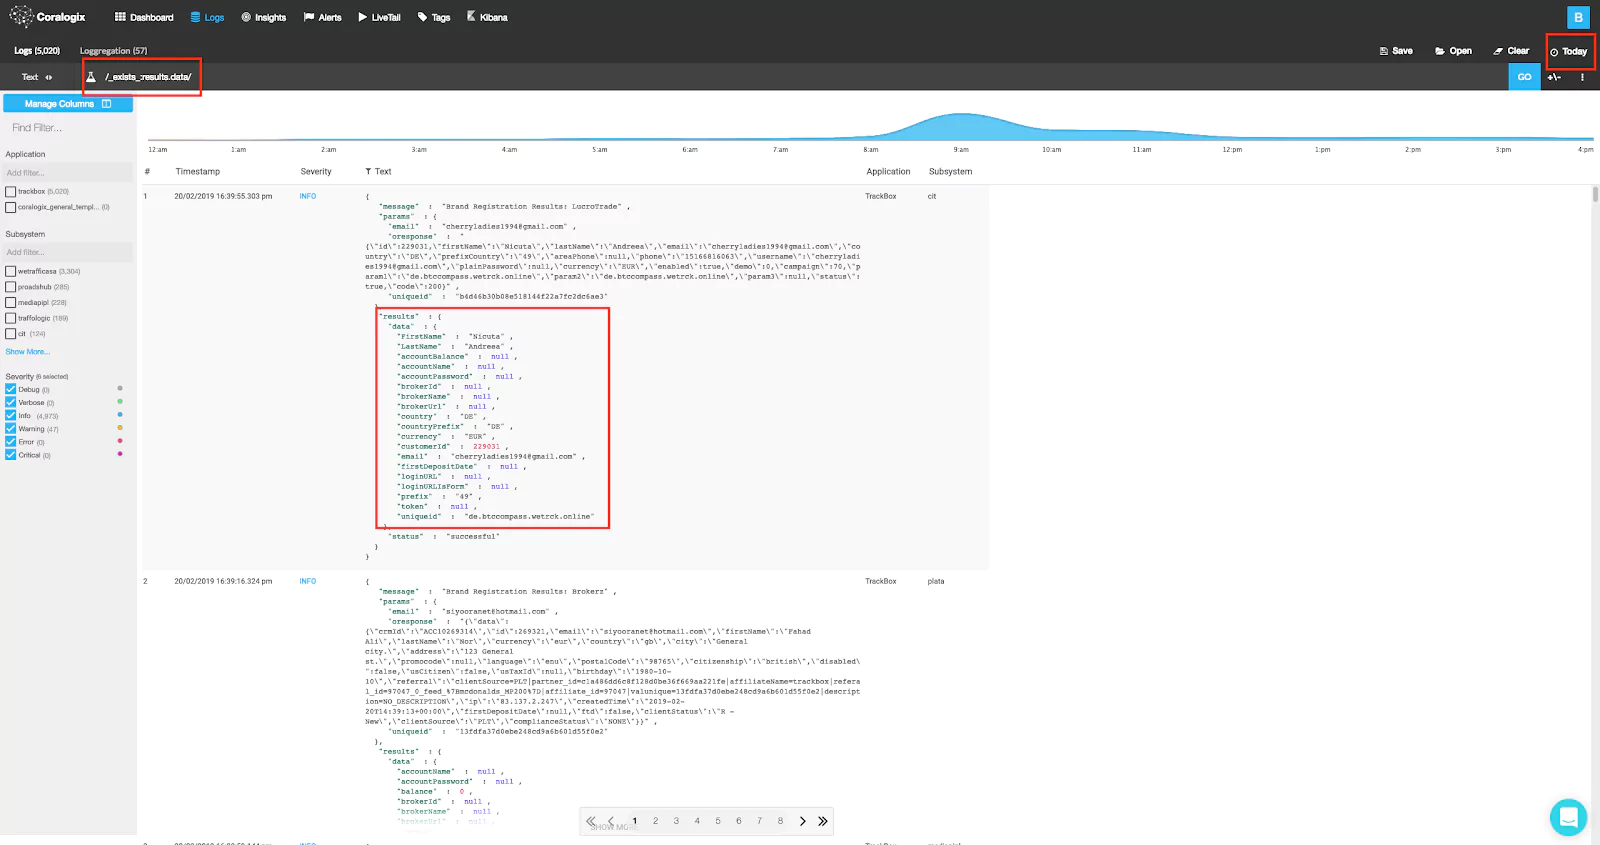
If we are not sure of which rule to configure we can use the Coralogix ‘Logs’ screen to run some queries and see the valid logs and the logs which encountered a mapping exception.

In Coralogix:

coralogix resul.data-object search with no mapping conflict

Run the following query: _exists_:results.data, and you should retrieve logs with existing (meaning correctly mapped) results.data field, we can easily notice that all of these valid logs present a JSON object within results.data.

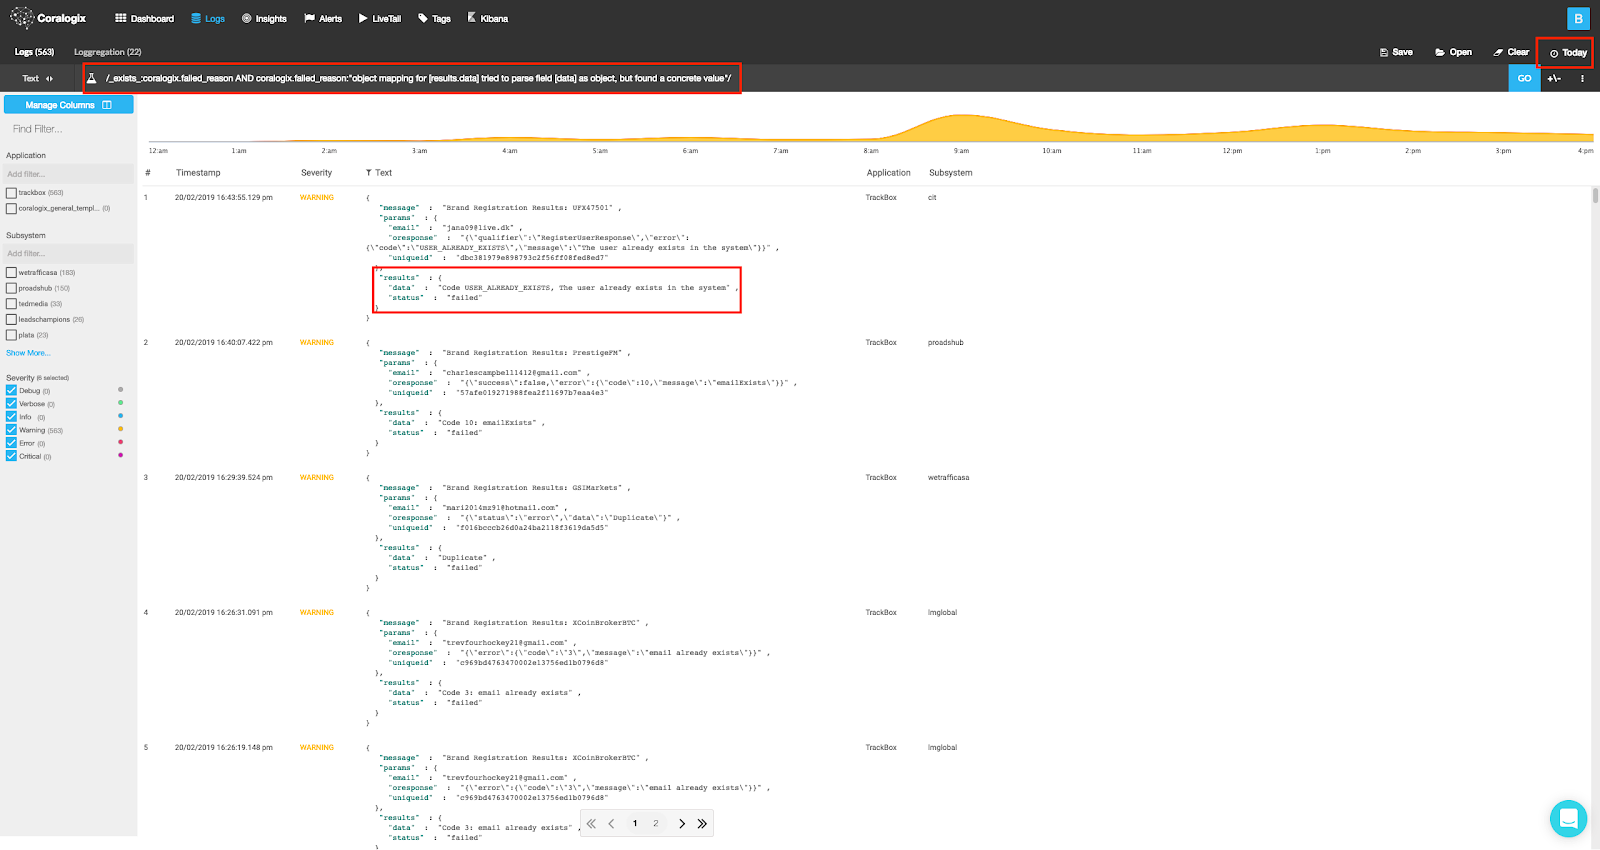
coralogix result.data-string-exception search

The query: _exists_:coralogix.failed_reason AND coralogix.failed_reason:”object mapping for [results.data] tried to parse field [data] as object, but found a concrete value”, will show us logs that encountered the specific mapping clash found in our Coralogix Mapping Exceptions Dashboard, confirming our analysis.

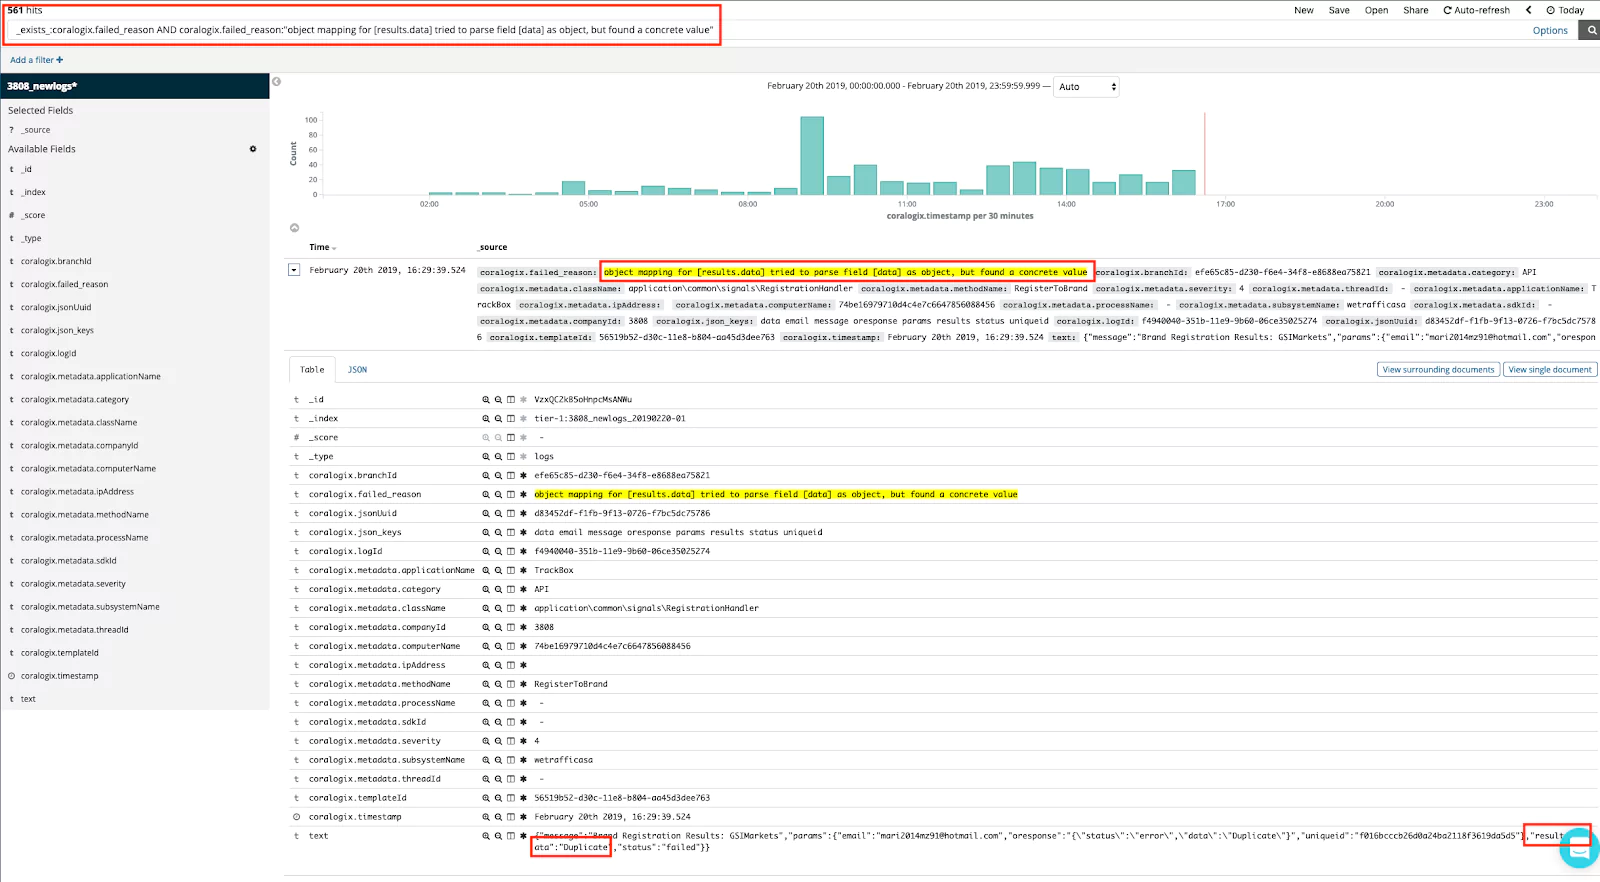
In Kibana:

coralogix result.data-string-exception-kibana search

Running the same query in Kibana will retrieve logs that failed to be mapped by Elasticsearch. We can see that the entire JSON payload of the log was stringified and stored into column text, verifying the fix action we should take.

Let’s take another example of an exception message: “failed to parse [response]”. We’ll encounter such exception in either of the following cases:

“response” field is of type string and the logs that triggered the exception include a JSON object in it.
Our replace rule:

  • REGEX: “data”s*:s*{
  • Replace To: “data_object”:{

“response” field is of type boolean and the logs that triggered the exception included a numeric value (0/1) or “false”/”true” in double-quotes (represents a string type in Elasticsearch), instead of the terms false/true which represent a Boolean type.

This case will require 2 rules for fixing each mapping exception type:
Our #1 replace rule:

  • REGEX: “data”s*:s*”false” Or “data”s*:s*0
  • Replace To: “data”s*:s*false

Our #2 replace rule:

  • REGEX: “data”s*:s*”true” Or “data”s*:s*1
  • Replace To: “data”s*:s*true

Create an alert for mapping exceptions

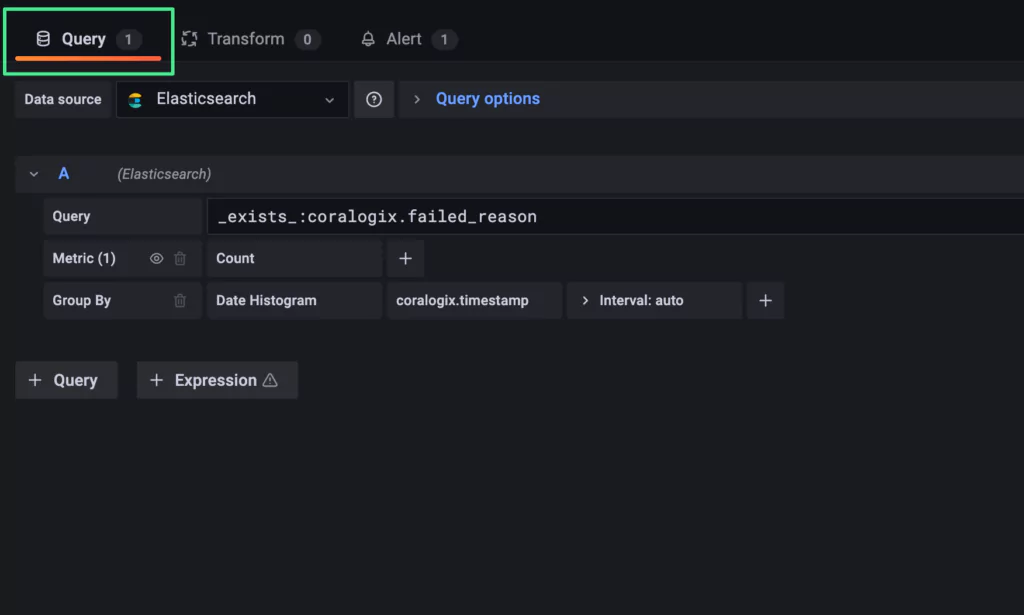
Mapping exceptions are reported in the field ‘coralogix.failed_reason’. An alert aggregation on this field will provide us the desired result. Since the mapping exception data is added at indexing time, the regular Coralogix Alerts mechanism would not have access to this information, therefore it could not be used to configure this type of alert. However, we could use Grafana alerts to achieve this goal.

I will show you how to configure your own Grafana Mapping Exceptions Dashboard, so you could use a Grafana alert for this. This tutorial assumes that Grafana has already been installed, and Coralogix defined as a Data Source in Grafana. For instructions on configuring the Grafana plugin, please refer to: https://coralogixstg.wpengine.com/tutorials/grafana-plugin/

In order to install the Dashboard, please follow these steps:

1. Download and decompress the Grafana Dashboard file: “Grafana – Mapping Exceptions Alerts Dashboard.json.zip”.

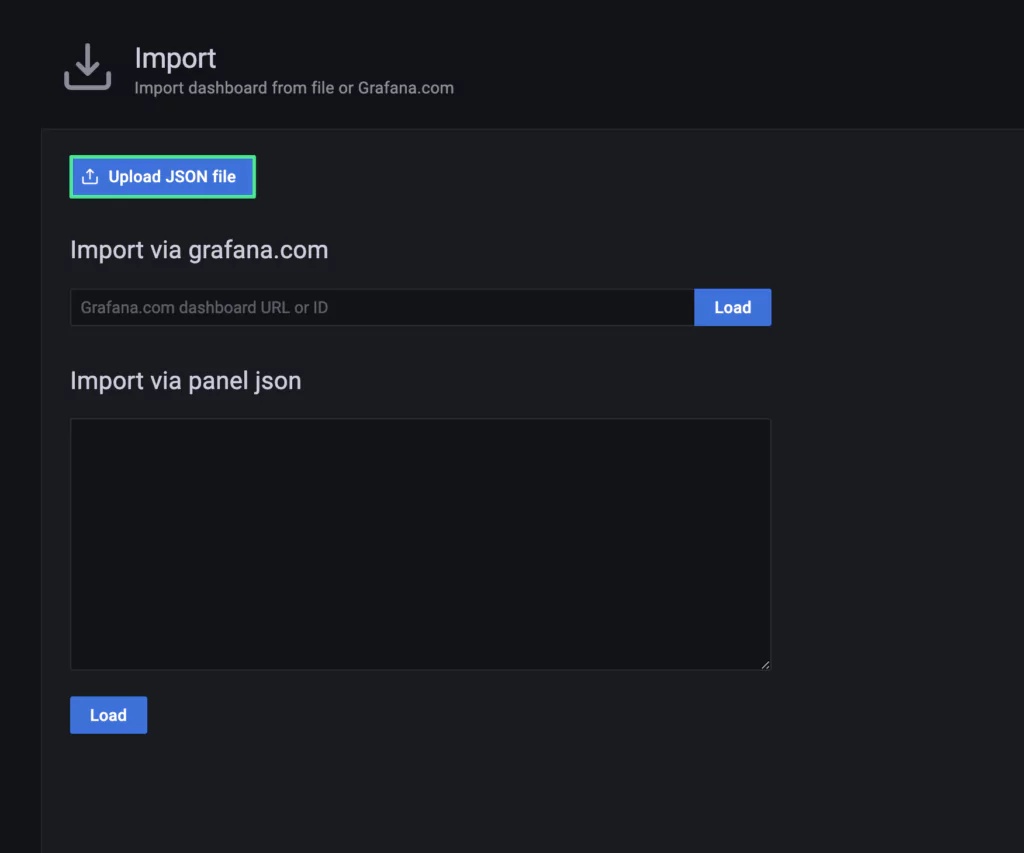
2. Go to Grafana and click the plus sign (+) / Create / Import.

3. Click “Upload JSON file” and select the “Grafana – Mapping Exceptions Alerts Dashboard.json”, followed by “Open”.

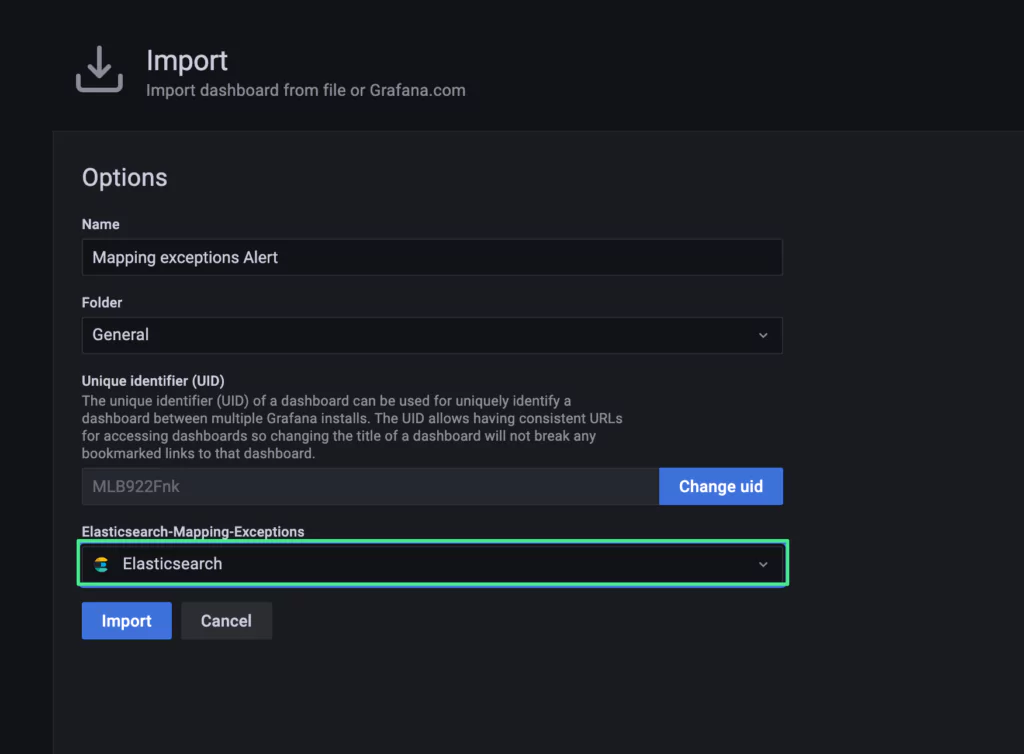
4. Please make sure the correct Data Source has been selected, then click “Import” (“Elasticsearch” in this example).

5. Please click “Save dashboard” on the top-right of the Grafana UI.

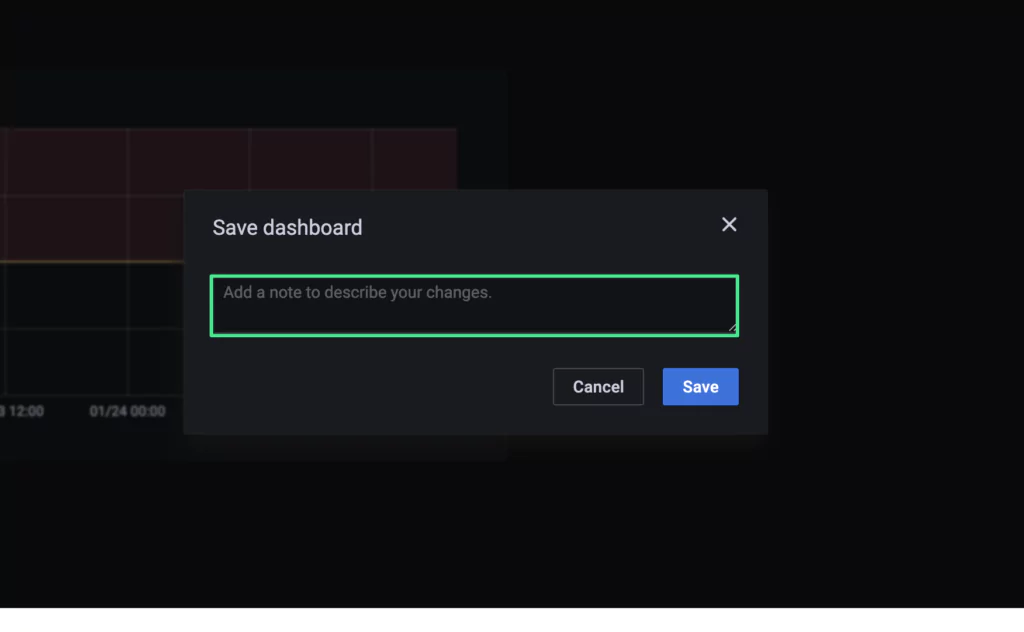
6. Enter an optional note describing your changes, followed by “Save”.

7. At this point, the Grafana Dashboard will be saved, and the alerting mechanism activated.

8. In order to review the alert settings, please click the bell icon on the left-side of the Grafana UI, followed by “Alerting” / “Alert rules”.

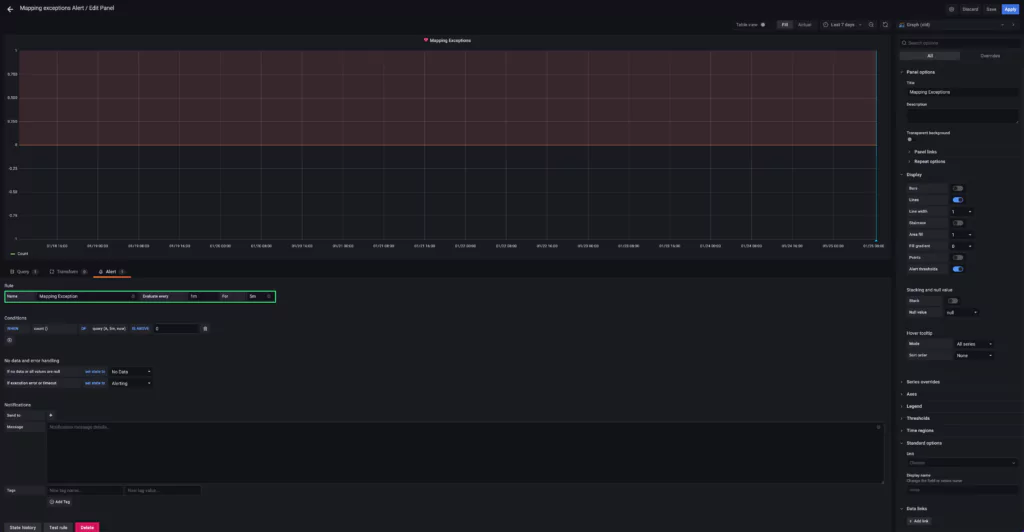
9. Click “Edit alert”.

10. Review the alert settings.

11. Click “Query” on the left, to Review the query settings.

That’s it! 🙂

At this point, the Admin must determine how to receive alert notifications when a Mapping Exception occurs. For this information, please refer to the Grafana alert notifications documentation. We sincerely hope that you found this document useful. Enjoy your Dashboard! 😎

To sum up

We should definitely take Mapping exceptions into consideration as they can cause data losses and dramatically reduce the power of Kibana and the Elasticsearch APIs. It is recommended to develop best practices across different engineering teams and team members so that logs are written correctly and consistently, or at the very least, choose the right logging solution that will give you tools to handle such issues and get your data on the right path.