Metricbeat, an Elastic Beat based on the libbeat framework from Elastic, is a lightweight shipper that you can install on your servers to periodically collect metrics from the operating system and from services running on the server. Everything from CPU to memory, Redis to NGINX, etc… Metricbeat takes the metrics and statistics that it collects and ships them to the output that you specify, such as Elasticsearch or Logstash.
In this post, we will cover some of the main use cases Metricbeat supports and we will examine various Metricbeat configuration use cases.
Metricbeat Installation
Metricbeat installation instructions can be found on the Elastic website.
Metricbeat Configuration
To configure Metricbeat, edit the configuration file. The default configuration file is called metricbeat.yml. The location of the file varies by platform. For rpm and deb, you’ll find the configuration file at this location /etc/metricbeat. There’s also a full example configuration file at /etc/metricbeat/metricbeat.reference.yml that shows all non-deprecated options.
The Metricbeat configuration file uses YAML for its syntax as it’s easier to read and write than other common data formats like XML or JSON. The syntax includes dictionaries, an unordered collection of name/value pairs, and also supports lists, numbers, strings, and many other data types.
All members of the same list or dictionary must have the same indentation level. Lists and dictionaries can also be represented in abbreviated form, which is somewhat similar to JSON using {} for dictionaries and [] for lists. For more info on the config file format.
The Modules configuration section can help with the collection of metrics from various systems.
The Processors section is used to configure processing across data exported by Metricbeat (optional). You can define a processor globally at the top-level in the configuration or under a specific module so the processor is applied to the data collected for that module.
The Output section determines the output destination of the processed data.
There are other sections you may include in your YAML such as a Kibana endpoint, internal queue, etc. You may view them and their different options at the configuring Metricbeat link. Each of the sections has different options and there are numerous module types, processors, different outputs to use, etc…
In this post, I will go over the main sections you may use and focus on giving examples that worked for us here at Coralogix.
Modules
The Modules section defines the Metricbeat input, the metrics that will be collected by Metricbeat, each module contains one or multiple metric sets. There are various module types you may use with Metricbeat, you can configure modules in the modules.d directory (recommended), or in the Metricbeat configuration file. In my examples, I’ll configure the module in the Metricbeat configuration file. Here is an example of the System module. For more info on configuring modules and module types.
#============================= Metricbeat Modules =============================
metricbeat.modules:
- module: system
  metricsets:
    - cpu # CPU usage
    - load # CPU load averages
    - memory # Memory usage
    - network # Network IO
    #- core # Per CPU core usage
    #- diskio # Disk IO
    #- filesystem # File system usage for each mountpoint
    #- fsstat # File system summary metrics
    #- raid # Raid
    #- socket # Sockets and connection info (linux only)
    #- service # systemd service information
  enabled: true
  period: 10s
There are some more options to this module type as you can observe in the full example config file. These are all the available metric sets with the system module type, the enable parameter is optional, by default if not specified it is set to true and the period parameter is setting how often the metric sets are executed. This setting is required for all module types. You may include multiple module types, all in the same YAML configuration. If you are working with Coralogix and wish to send your metrics to your Coralogix account you will have to include the fields parameter with our required fields, this is beside the fact you need to choose our Logstash endpoint in your config output, we will see a similar example later.
Processors
You can use Processors in order to process events before they are sent to the configured output. The libbeat library provides processors for reducing the number of exported fields, performing additional processing and decoding, etc… Each processor receives an event, applies a defined action to the event, and returns the event. If you define a list of processors, they are executed in the order they are defined in the configuration file. This is an example of several processors configured. For more information on filtering and enhancing your data.
# ================================= Processors =================================
# Processors are used to reduce the number of fields in the exported event or to
# enhance the event with external metadata. This section defines a list of
# processors that are applied one by one and the first one receives the initial
# event:
#
# event -> filter1 -> event1 -> filter2 ->event2 ...
#
# The supported processors are drop_fields, drop_event, include_fields,
# decode_json_fields, and add_cloud_metadata.
#
# For example, you can use the following processors to keep the fields that
# contain CPU load percentages, but remove the fields that contain CPU ticks
# values:
#
processors:
- include_fields:
fields: ["cpu"]
- drop_fields:
fields: ["cpu.user", "cpu.system"]
#
# The following example drops the events that have the HTTP response code 200:
#
processors:
- drop_event:
when:
equals:
http.code: 200
#
# The following example renames the field a to b:
#
processors:
- rename:
fields:
- from: "a"
to: "b"
#
# The following example enriches each event with the machine's local time zone
# offset from UTC.
#
processors:
- add_locale:
format: offset
#
# The following example enriches each event with host metadata.
#
processors:
- add_host_metadata: ~
#
# The following example decodes fields containing JSON strings
# and replaces the strings with valid JSON objects.
#
processors:
- decode_json_fields:
fields: ["field1", "field2", ...]
process_array: false
max_depth: 1
target: ""
overwrite_keys: false
#
# The following example copies the value of message to message_copied
#
processors:
- copy_fields:
fields:
- from: message
to: message_copied
fail_on_error: true
ignore_missing: false
#
# The following example preserves the raw message under event_original, which then cut at 1024 bytes
#
processors:
- copy_fields:
fields:
- from: message
to: event_original
fail_on_error: false
ignore_missing: true
- truncate_fields:
fields:
- event_original
max_bytes: 1024
fail_on_error: false
ignore_missing: true
#
# The following example URL-decodes the value of field1 to field2
#
processors:
- urldecode:
fields:
- from: "field1"
to: "field2"
ignore_missing: false
fail_on_error: true
#
# The following example is a great method to enable sampling in Metricbeat, using Script processor#
processors:- script:
lang: javascript
id: my_filter
source:>function process(event){if(Math.floor(Math.random()*100)<50){event.Cancel();}}
Metricbeat offers more types of processors as you can see here and you may also include conditions in your processor definition. If you use Coralogix, you have an alternative to Metricbeat Processors, to some extent, as you can set different kinds of parsing rules through the Coralogix UI instead. If you are maintaining your own ELK stack or other 3rd party logging tool you should check for processors when you have any need for parsing.
Output
You configure Metricbeat to write to a specific output by setting options in the Outputs section of the metricbeat.yml config file. Only a single output may be defined. In this example, I am using the Logstash output. This is the required option if you wish to send your logs to your Coralogix account, using Metricbeat. For more output options.
# ================================= Logstash Output =================================
output.logstash:
  # Boolean flag to enable or disable the output module.
  enabled: true

  # The Logstash hosts
  hosts: ["localhost:5044"]

  # Configure escaping HTML symbols in strings.
  escape_html: true

  # Number of workers per Logstash host.
  worker: 1

  # Optionally load-balance events between Logstash hosts. Default is false.
  loadbalance: false

  # The maximum number of seconds to wait before attempting to connect to
  # Logstash after a network error. The default is 60s.
  backoff.max: 60s

  # Optional index name. The default index name is set to filebeat
  # in all lowercase.
  index: 'filebeat'

  # The number of times to retry publishing an event after a publishing failure.
  # After the specified number of retries, the events are typically dropped.
  # Some Beats, such as Filebeat and Winlogbeat, ignore the max_retries setting
  # and retry until all events are published.  Set max_retries to a value less
  # than 0 to retry until all events are published. The default is 3.
  max_retries: 3

  # The maximum number of events to bulk in a single Logstash request. The
  # default is 2048.
  bulk_max_size: 2048

  # The number of seconds to wait for responses from the Logstash server before
  # timing out. The default is 30s.
  timeout: 30s
This example only shows some of the configuration options for the Logstash output, there are more. It’s important to note that when using Coralogix, you specify the following Logstash host: logstashserver.coralogixstg.wpengine.com:5044 under hosts and that some other options are redundant, such as index name, as it is defined by us.
At this point, we have enough Metricbeat knowledge to start exploring some actual configuration files. They are commented and you can use them as references to get additional information about different plugins and parameters or to learn more about Metricbeat.
Metricbeat Configuration Examples
Example 1
This example uses the system module to monitor your local server and send different metric sets. The Processors section includes a processor to drop unneeded beat metadata. The chosen output for this example is stdout.
This example uses the system module to monitor your local server and send different metric sets, forwarding the events to Coralogix’s Logstash server (output) with the secured connection option. The Processors section includes a processor to sample the events to send 50% of the data.
#============================= Metricbeat Modules =============================
metricbeat.modules:
- module: system
  metricsets:
    - cpu             # CPU usage
    - load            # CPU load averages
    - memory          # Memory usage
    - network         # Network IO
  enabled: true
  period: 10s
#============================= General =============================
fields_under_root: true
fields:
  PRIVATE_KEY: "XXXXXXXX-XXXX-XXXX-XXXX-XXXXXXXXXXXX"
  COMPANY_ID: XXXXX
  APP_NAME: "metricbeat"
  SUB_SYSTEM: "system"
#================================= Processors =================================
processors:
# The following example is a great method to enable sampling in Filebeat, using Script processor. This script processor drops 50% of the incoming events
  - script:
      lang: javascript
      id: my_filter
      source: >
        function process(event) {
            if (Math.floor(Math.random() * 100) < 50) {
              event.Cancel();
            }
        }
#================================= Logstash output =================================
output.logstash:
  enabled: true
  hosts: ["logstashserver.coralogixstg.wpengine.com:5015"]
  ssl.certificate_authorities: ["/var/log/metricbeat/ca.crt"]
Syslog takes its name from the System Logging Protocol. It is a standard for message logging monitoring and has been in use for decades to send system logs or event messages to a specific server, called a Syslog Server.
Syslog Components
To achieve the objective of offering a central repository for logs from multiple sources, Syslog servers have several components including:
Syslog Listener: This gathers and processes Syslog data sent over UDP port 514.
Database: Syslog servers need databases to store the massive amounts of data for quick access.
Management and Filtering Software: The Syslog Server needs help to automate the work, as well as to filter to view specific log messages. This software is able to extract specific parameters and filter logs as needed.
Message Components
The Syslog message format is divided into three parts:
PRI: A calculated Priority Value which details the message priority levels.
HEADER: Consists of two identifying fields which are the Timestamp and the Hostname (the machine name that sends the log).
MSG: This contains the actual message about the event that happened. It is UTF-8 encoded and is also divided into a TAG and a CONTENT field. The information includes event messages, severity, host IP addresses, diagnostics and more.
More About PRI
This is derived from two numeric values that help categorize the message, Facility Code and Severity Level.
Facility Code: This value is one of 15 predefined codes or various locally defined values in the case of 16 to 23. These codes specify the type of program that is logging the message. Messages with different facilities may be handled differently. The list of facilities available is defined by the standard:
Facility Code
Keyword
Description
0
kern
Kernel messages
1
user
User-level messages
2
mail
Mail system
3
daemon
System daemons
4
auth
Security/authentication messages
5
syslog
Messages generated internally by syslogd
6
lpr
Line printer subsystem
7
news
Network news subsystem
8
uucp
UUCP subsystem
9
cron
Clock daemon
10
authpriv
Security/authentication messages
11
ftp
FTP daemon
12
ntp
NTP subsystem
13
security
Log audit
14
console
Log alert
15
solaris-cron
Scheduling daemon
16-23
local0 – local7
Locally-used facilities
The mapping between facility code and keyword is not uniform in different operating systems and Syslog implementations.
Severity Level: The second value of a Syslog message categorizes the importance or severity of the message in a numerical code from 0 to 7.
Level
Severity
Description
0
Emergency
System is unusable
1
Alert
Action must be taken immediately
2
Critical
Critical conditions
3
Error
Error conditions
4
Warning
Warning conditions
5
Notice
Normal but significant condition
6
Informational
Informational messages
7
Debug
Debug-level messages
The PRI value is calculated by taking the Facility Code, multiplying it by eight and then adding the Severity Level. Messages are typically no longer than 1024 bytes.
Advantages
Syslog allows the separation of the software that generates messages, the system that stores them and the software that reports and analyzes them. Therefore it provides a way to ensure that critical events are logged and stored off the original server. An attacker’s first effort after compromising a system is usually to cover their tracks left in the logs. Logs forwarded via Syslog are out of reach.
Monitoring numerous logs from numerous systems is time consuming and impractical. Syslog helps solve this issue by forwarding those events to the centralized Syslog server, consolidating logs from multiple sources into a single location.
While Syslog is not the best way to monitor the status of networked devices, it can be a good way to monitor the overall health of network equipment. Sudden spikes in event volume, for example, might indicate sudden traffic spikes. Learning about this at the edge of your system lets you get ahead of the problem before it happens.
Syslog can be configured to forward authentication events to a Syslog server, without the overhead of having to install and configure a full monitoring agent.
Limitations
Syslog does not include an authentication mechanism and is therefore weak on security. Therefore, it is possible for one machine to impersonate another machine and send fake log events. It is also susceptible to replay attacks.
Also, it is possible to lose Syslog messages because of its reliance on UDP transport. UDP is connectionless and not guaranteed, so messages could be lost due to network congestion or packet loss.
Another limitation of the Syslog protocol is that the device being monitored must be up and running and connected to the network to generate and send a message. A critical error from a server may never send an error at all if the system goes offline. Therefore, Syslog is not a good way to monitor the up and down status of devices.
Finally, although there are standards about the components of a message, there is a lack of consistency in terms of how message content is formatted. The protocol does not define standard message formatting. Some messages may be human readable, some not. Syslog just provides a method to transport the message.
Log Messages Best Practices
To help create the most useful Syslog messages possible, follow these best practices:
Use Parsable Log Formats
There is no universal structure for log messages. Working with large volumes of logs is almost impossible if you don’t have a way to automatically parse log entries to find what you’re searching for. Tools are far more likely to work with a parseable format.
One example is JSON, a structured-data log format that’s become the standard used for many logging applications. It is both machine and human-readable and is supported by most languages and runtimes. It also has the added benefit of being compact and efficient to parse.
Use a Logging Library or Framework
There are many logging libraries for programming languages and runtime environments. Whatever the language your app is developed with, use a compatible framework to transmit logs from your app or service to a Syslog server.
Standardized Formats
Set in the operating standards, the format or schema of the messages, for all users to follow. Standardizing the formats will mean less clutter in the logs and they become more searchable. Avoid long sentences and use standard abbreviations i.e use ‘ms’ for ‘milliseconds’.
There should be non-negotiable fields in your logs. IP address, timestamp, whatever you need. It’s important to have basic fields that are always set, every time. Additionally, log formats without schemas are difficult to maintain as new logging code is added to your software, new team members join and new features are developed.
Knowing exactly what information needs to be embedded in log messages helps users write them and helps everyone else read them.
Include Identifiers
Closely linked with using a format to precisely describe the log format is the best practice of using identifiers in the messages. Identifiers help identify where a message came from and figure out how multiple messages are related. For example, including a transaction or session ID in your log message allows you to link two separate errors to the same user session.
Include Syslog Severity Levels
Correctly using the most appropriate logging Severity Level when sending a message can make future troubleshooting easier. Allowing logging to be set at the wrong level and can cause monitoring issues creating false alarms or masking urgent issues.
Include the Right Amount of Context
The best Syslog messages include all the relevant context to recreate the state of your application at the time of the logging call. This means adding the source of the problem in error messages and concise reasons for sending emergency log messages.
Avoid Multi-line Log Messages
The Syslog protocol specification allows multiple lines to be contained within a single log message, but this can cause some parsing issues. Line breaks in log lines aren’t friendly with every log analysis tool. For example, sed and grep commands, don’t handle searching for patterns across lines very well. Therefore, review and declutter the messages following the agreed message format.
However, if you absolutely must include multiline messages then investigate using a cloud-based log aggregation tool such as Papertrail. This has the ability to find the separate parts of a single log message when it’s split across lines.
Don’t Log Sensitive Data
Never ever write any passwords to the log files. The same applies for sensitive data like credit card details, bank account details and personal information. Syslog messages are rarely encrypted at rest. A malicious attacker will be able to easily read them.
Refine Your Logging Code
Another good practice is to review the logging code to:
Add more content in the Emergency, Alert, Critical, Error and Warning log statements.
Keep the Notice, Informational and Debug messages short.
Log in decision points, don’t log inside short loops.
Common Tooling
Some of best Syslog tools for Linux and Windows include:
SolarWinds Kiwi Syslog Server
One of best tools for collecting, viewing and archiving Syslog messages. It is a versatile, user friendly viewer with automated message responses. This tool is easy to install and generates reports in plain text or HTML.
The software handles Syslog and SNMP from Windows, Linux and UNIX hosts.
LOGalyzer is another free open-source, centralized log management and network monitoring tool.
It supports Linux and Unix servers, network devices and Windows hosts, providing real-time event detection and extensive search capabilities.
Summary
Complete network monitoring requires using multiple tools. Syslog is an important tool in network monitoring because it ensures that events occurring without a dramatic effect do not fall through any monitoring gaps. The best practice is to use software that combines all the tools, so to always have an overview of what is happening in your network.
As Syslog is a standard protocol, many applications support sending data to Syslog. By centralizing this data, you can easily audit security, monitor application behavior and keep track of other important server information.
The Syslog log message format is supported by most programming tools and runtime environments so it’s a useful way to transmit and record log messages. Creating log messages with the right data requires users to think about the situations and to tailor the messages appropriately. Following best practices makes the job easier.
In a previous post, we explored the basic concepts behind using Grok patterns with Logstash to parse files. We saw how versatile this combo is and how it can be adapted to process almost anything we want to throw at it. But the first few times you use something, it can be hard to figure out how to configure for your specific use case. Looking at real-world examples can help here, so let’s learn how to use Grok patterns in Logstash to parse common logs we’d often encounter, such as those generated by Nginx, MySQL, Elasticsearch, and others.
First, Some Preparation
We’ll take a look at a lot of example logs and Logstash config files in this post so, if you want to follow along, instead of downloading each one at each step, let’s just copy all of them at once and place them in the “/etc/logstash/conf.d/logstash” directory.
First, install Git if it’s not already installed:
sudo apt update && sudo apt install git
Now let’s download the files and place them in the directory:
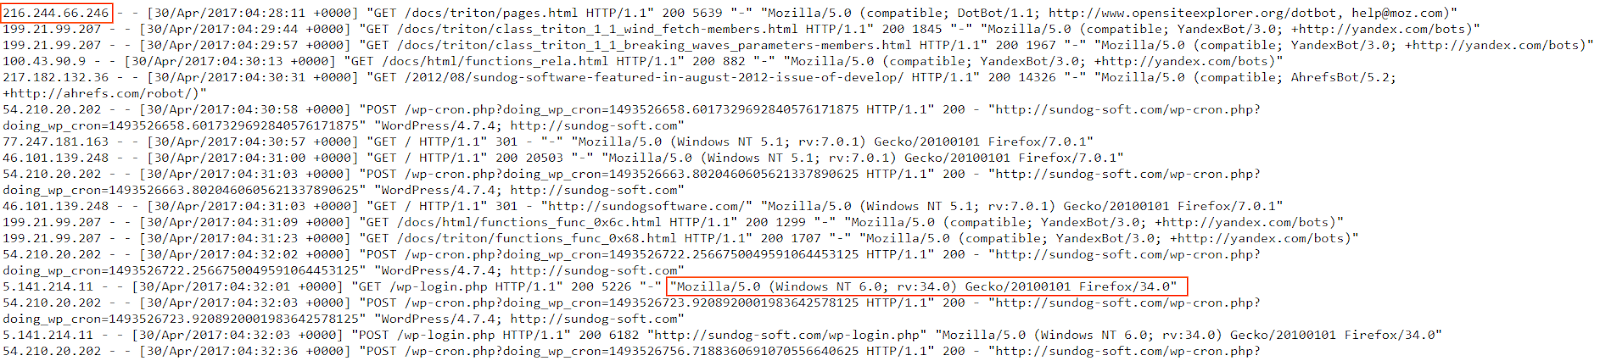
NGINX and Apache are the most popular web servers in the world. So, chances are, we will often have contact with the logs they generate. These logs reveal information about visits to your site like file access requests, NGINX responses to those requests, and information about the actual visitors, including their IP, browser, operating system, etc. This data is helpful for general business intelligence, but also for monitoring for security threats by malicious actors.
Let’s see how a typical Nginx log is structured.
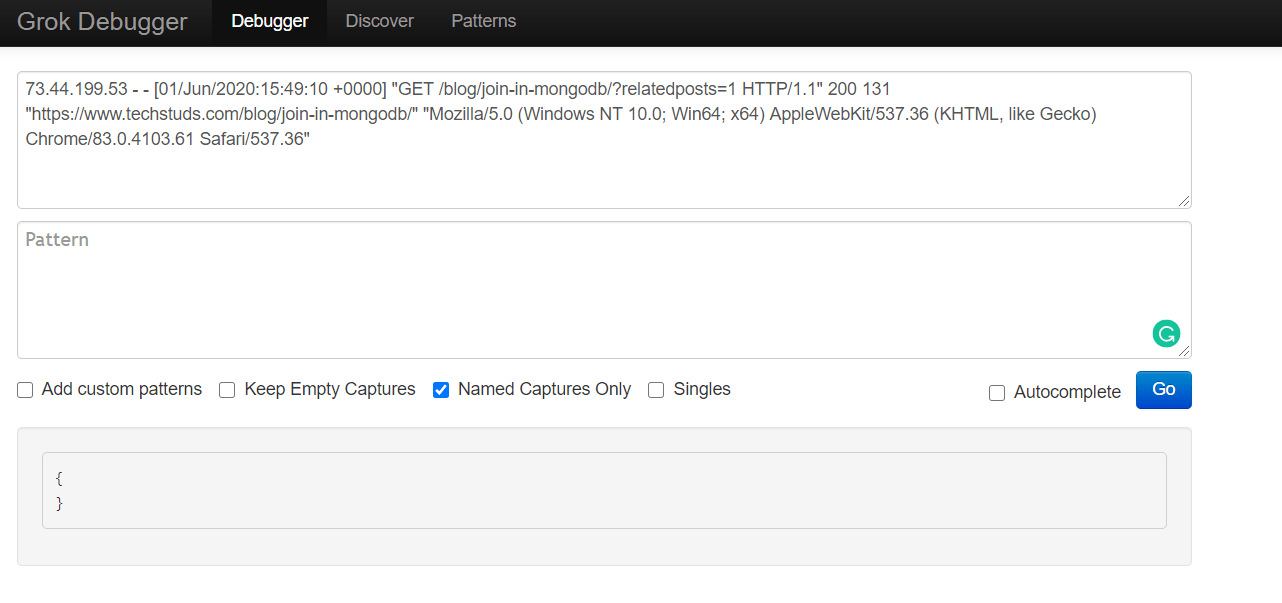
We’ll open the following link in a web browser https://raw.githubusercontent.com/coralogix-resources/logstash/master/nginx/access.log and then copy the first line. Depending on your monitor’s resolution, the first line might actually be broken into two lines, to fit on the screen (otherwise called “line wrapping”). To avoid any mistakes, here is the exact content of the line we will copy:
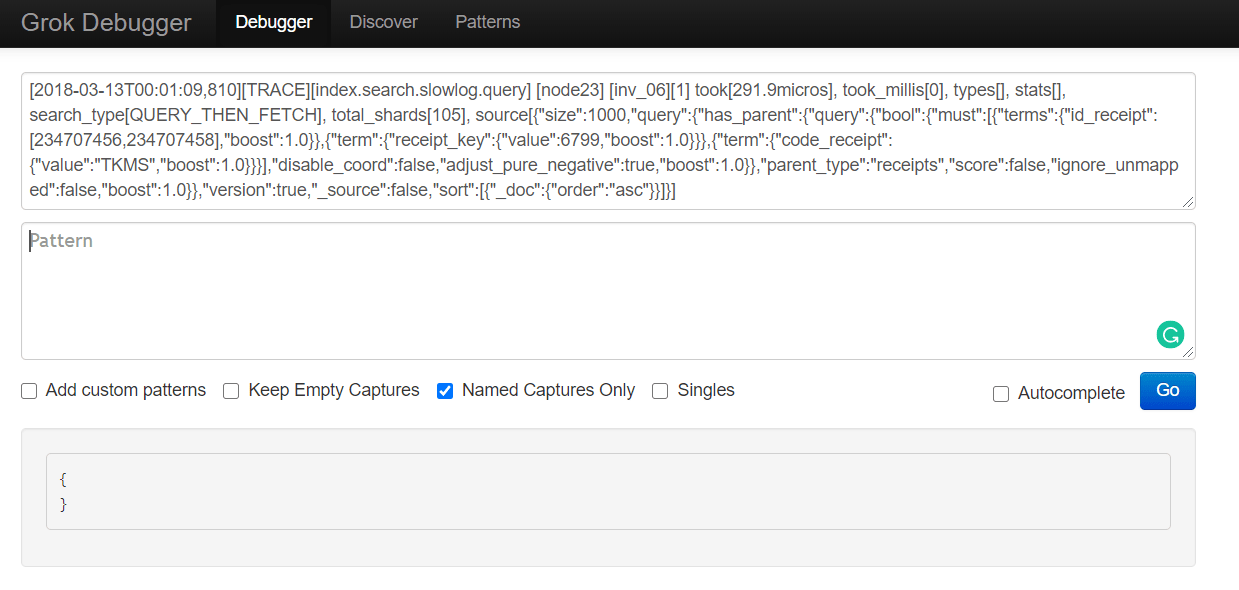
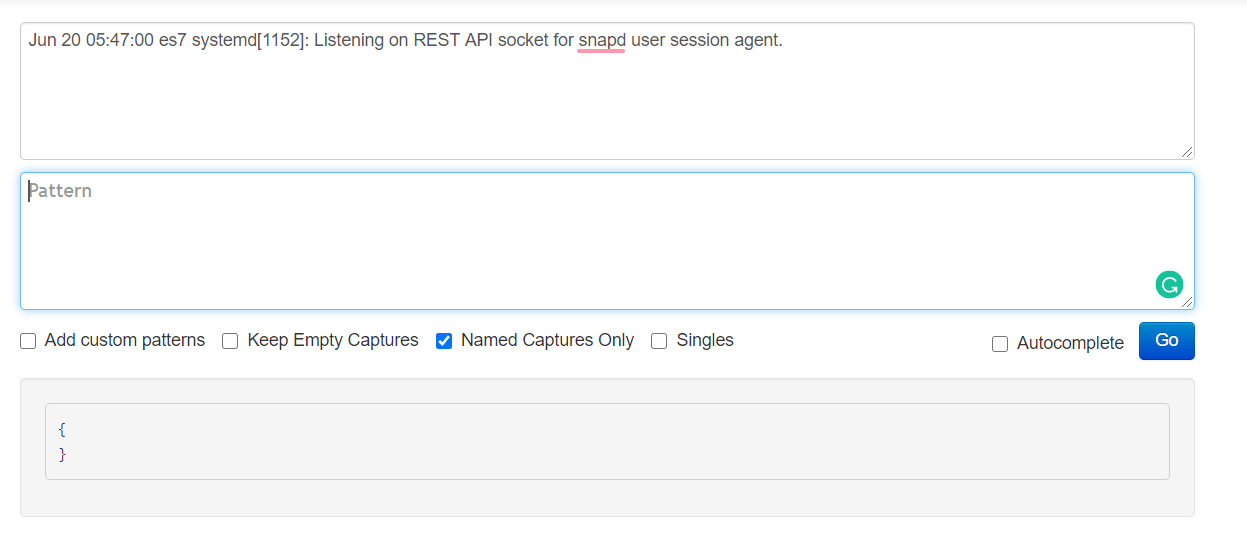
Next, let’s open the Grok Debugger Tool at https://grokdebug.herokuapp.com/ to help us out. In the first field, the input section, we’ll paste the previously copied line.
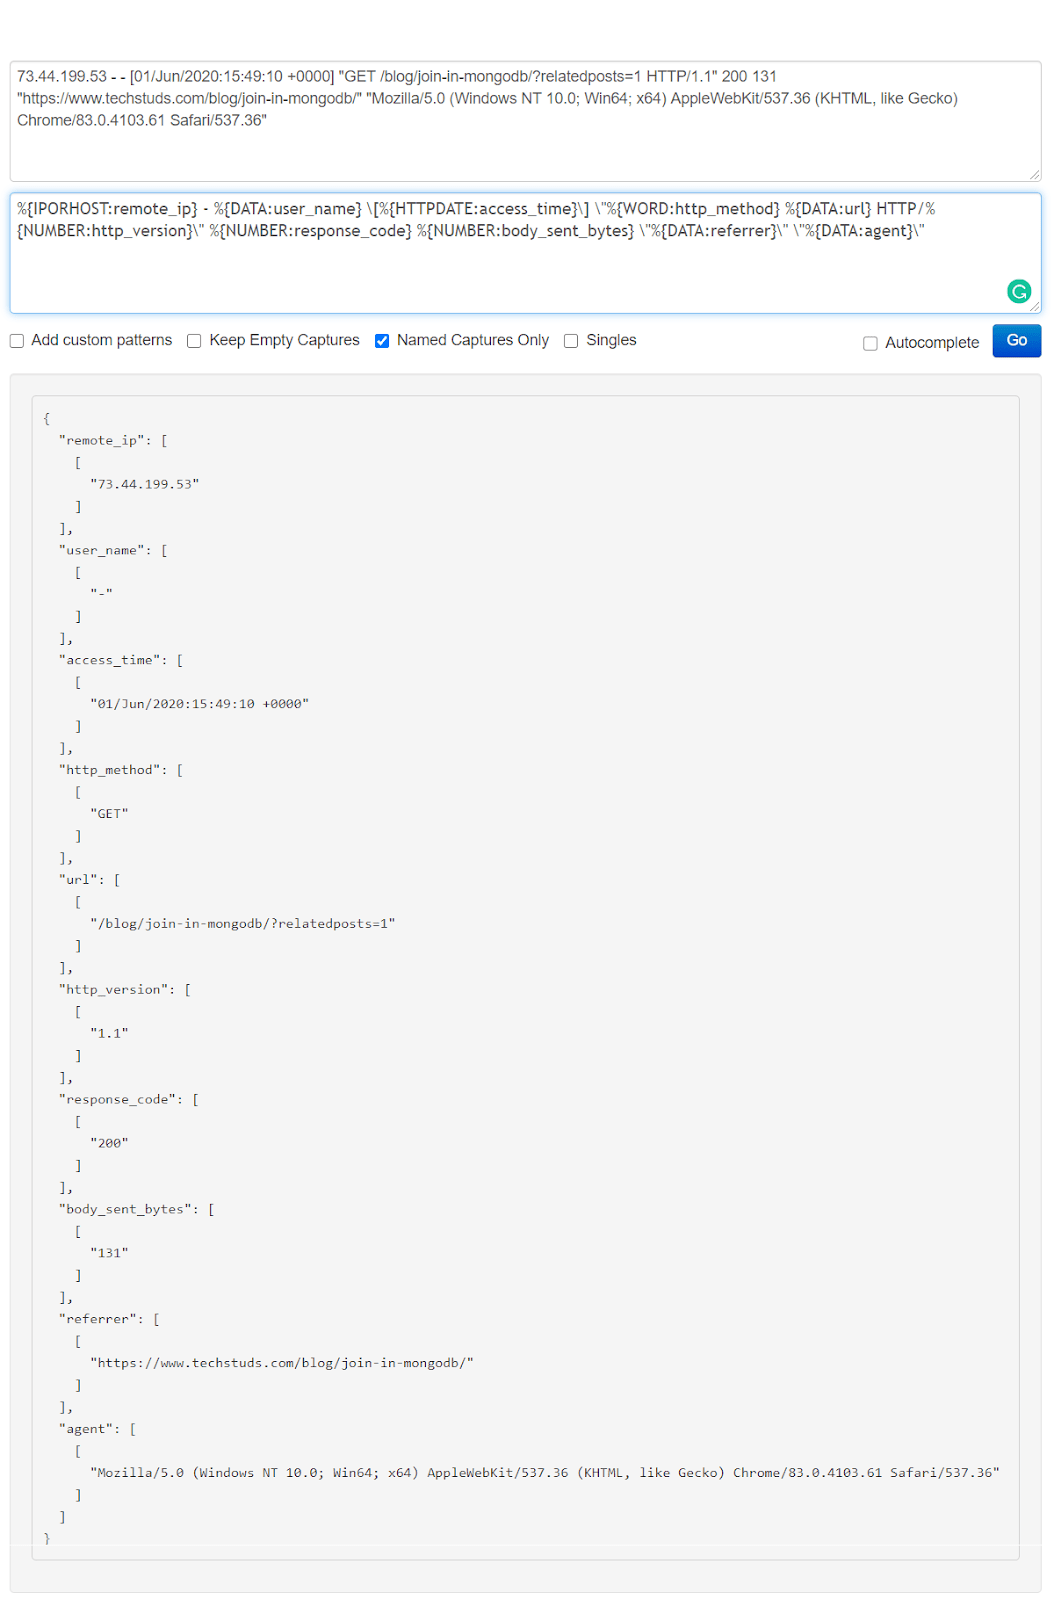
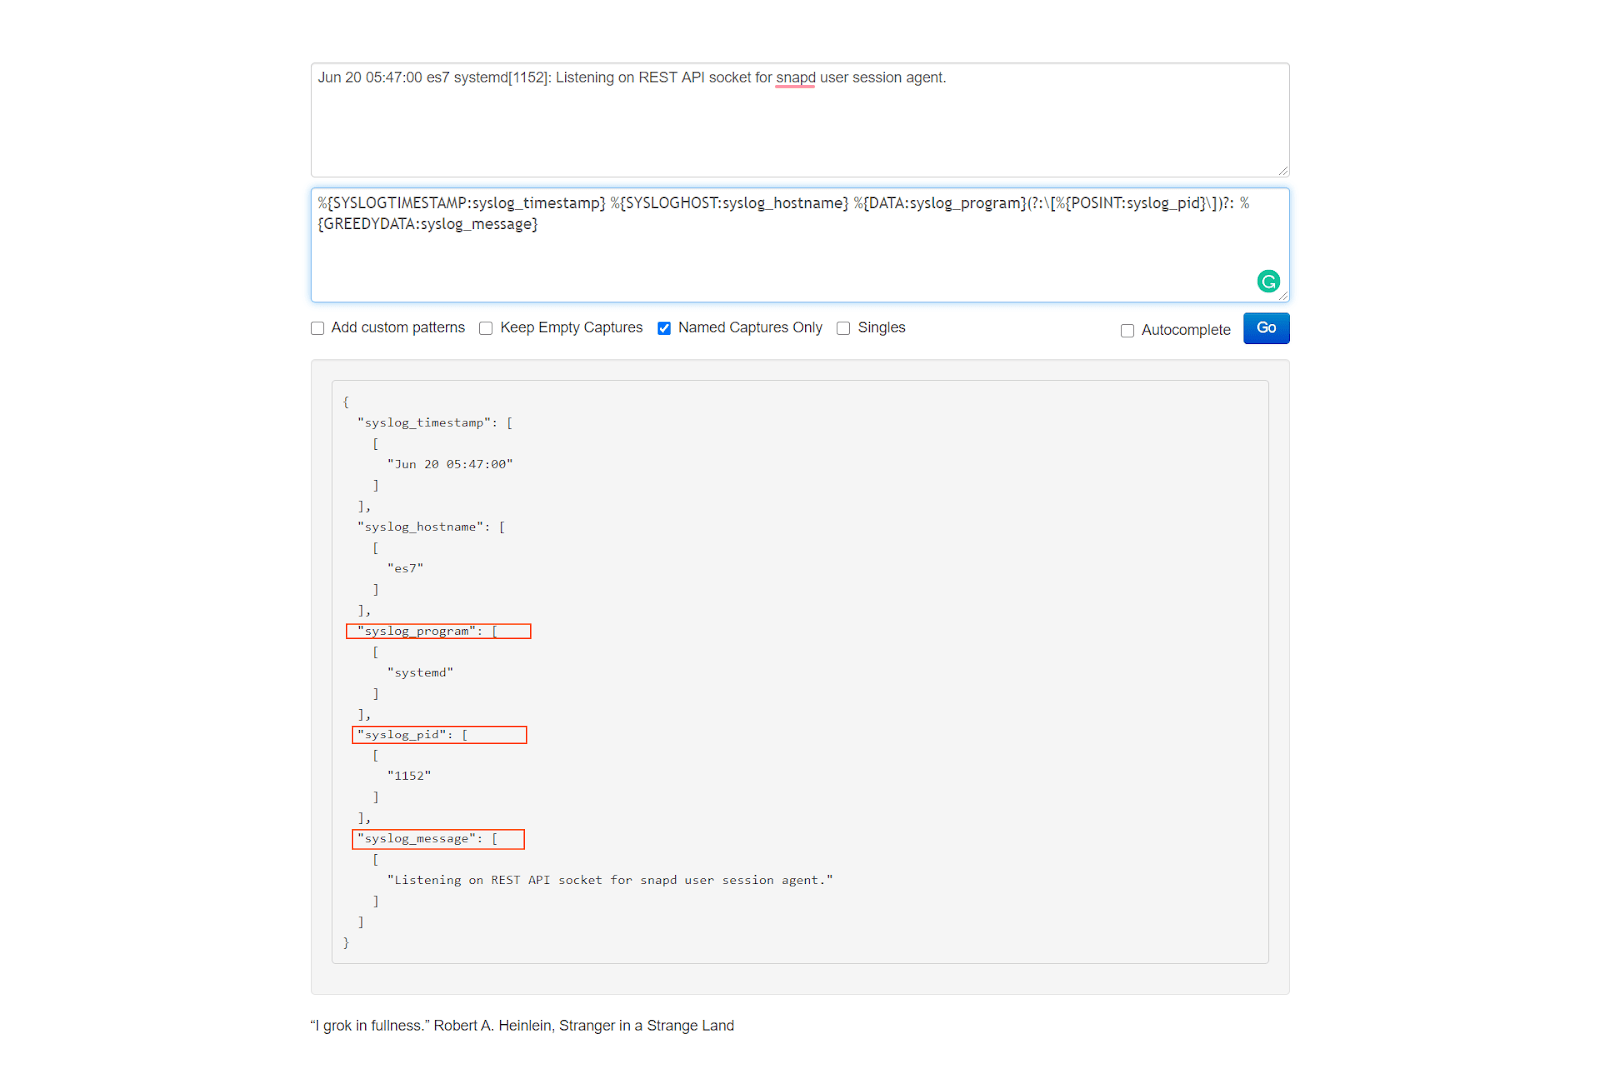
We go back to the https://grokdebug.herokuapp.com/ website and paste the Grok pattern in the second field, the pattern section. We’ll also tick the “Named captures only” checkbox and then click the “Go” button.
Note: For every line you copy and paste, make sure there are no empty lines before (or after) the actual text in the pattern field. Depending on how you copy and paste text, sometimes an empty line might get inserted before or after the copied string, which will make the Grok Debugger fail to parse your text. If this happens, just delete the empty line(s).
This tool is useful to test if our Grok patterns work as intended. It makes it convenient to try out new patterns, or modify existing ones and see in advance if they produce the desired results.
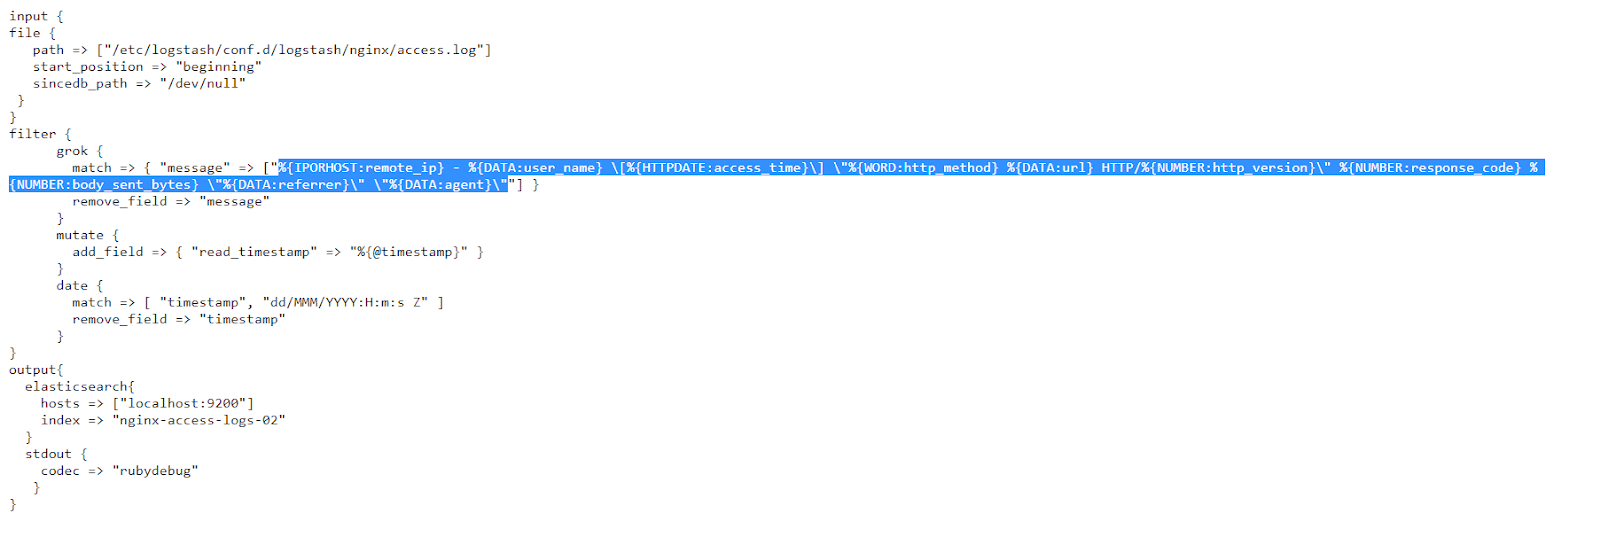
Now that we’ve seen that this correctly separates and extracts the data we need, let’s run Logstash with the configuration created specifically to work with the Nginx log file:
We can see the fields and their associated values neatly extracted by the Grok patterns.
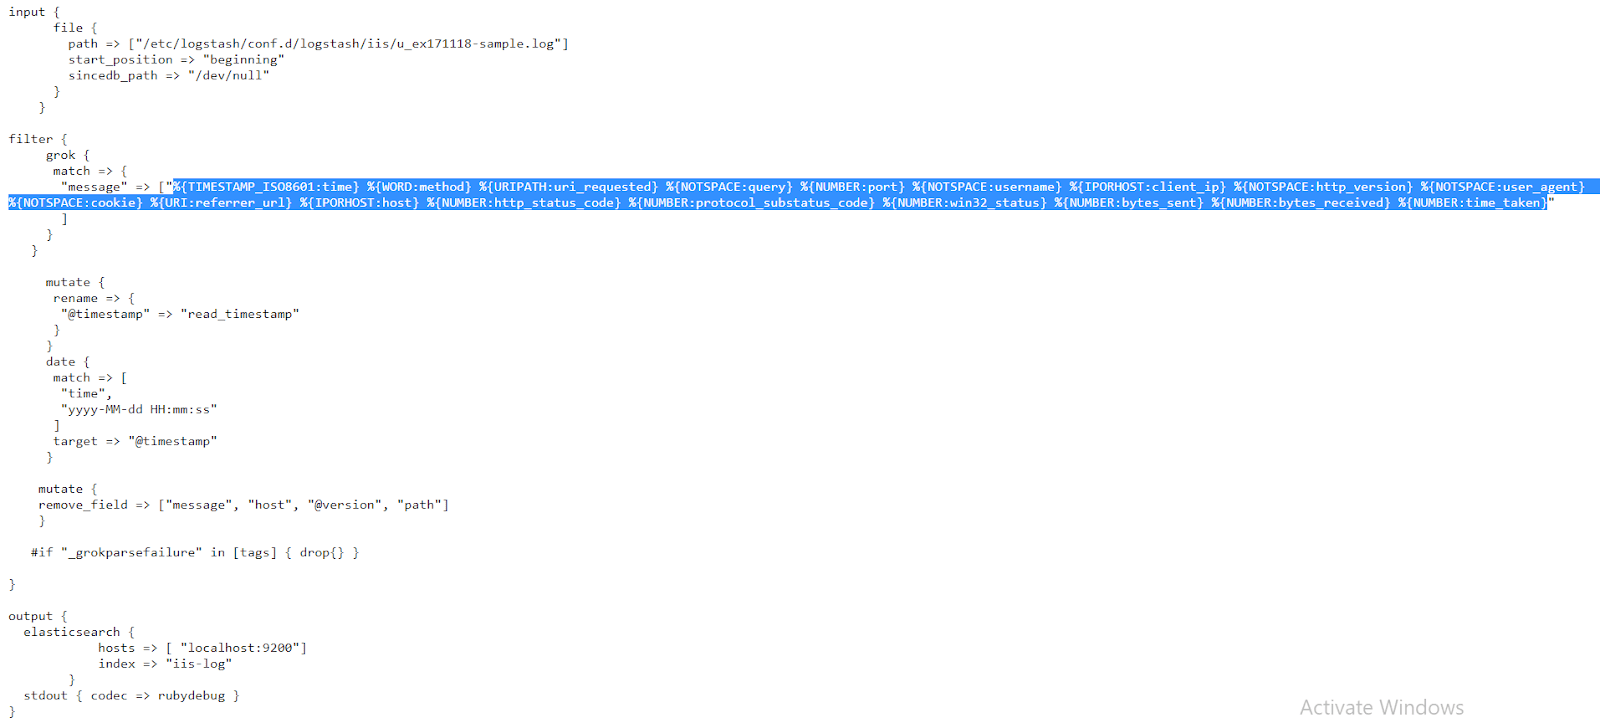
IIS Logs
While we’ll often see Apache and Nginx web servers on the Linux operating system, Microsoft Windows has its own web server included in IIS (Internet Information Services). These generate their own logs that can be helpful to monitor the state and activity of applications. Let’s learn how to parse logs generated by IIS.
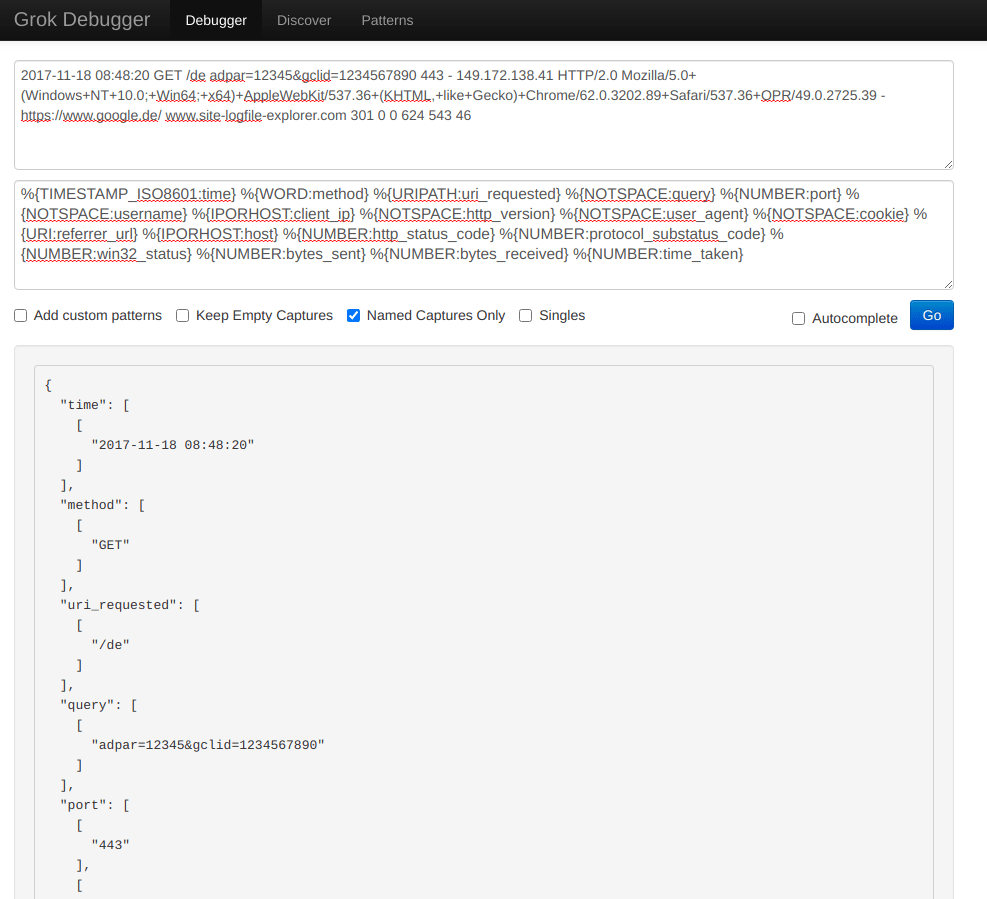
Once again, to take a closer look at how our specific Grok patterns will work, we’ll paste our log line into the Grok Debugger Tool tool, in the first field, the input section.
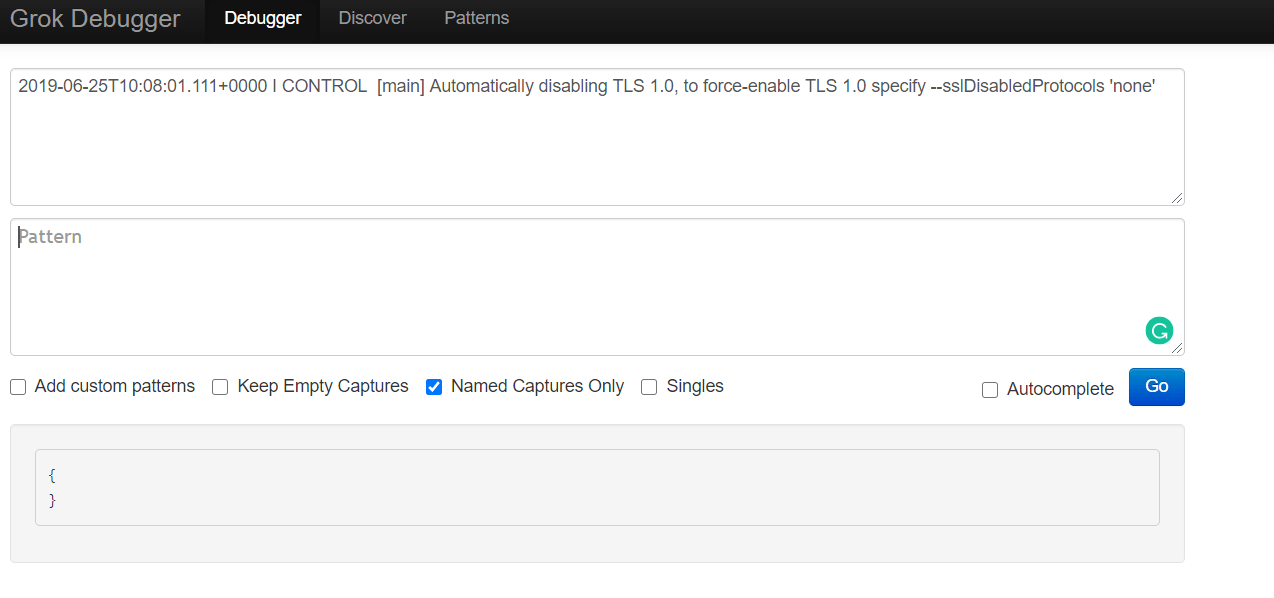
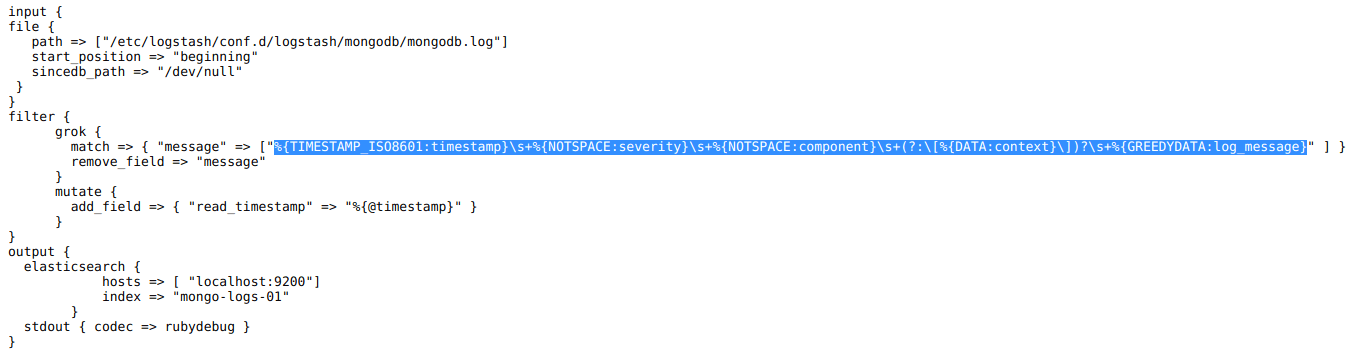
While not as popular as MySQL, the MongoDB database engine still has a fairly significant market share and is used by many leading companies. The MongoDB logs can help us track the database performance and resource utilization to help with troubleshooting and performance tuning.
User Agent Mapping and IP to Geo Location Mapping in Logs
Very often, when a web browser requests a web page from a web server, it also sends a so-called “user agent”. This can contain information such as the operating system used by a user, the device, the web browser name and version and so on. Obviously, this can be very useful data in certain scenarios. For example, it can help you find out if users of a particular operating system are experiencing issues.
Web servers also log the IP addresses of the visitors. While that’s useful to have in raw logs, those numbers themselves are not always useful to humans. They might be nice to have when trying to debug connectivity issues, or block a class of IPs, but for statistics and charts, it might be more relevant to have the geographic location of each IP, like country/city and so on.
to the actual names of the specific operating system, device and/or browser that was used, and other info which is much more easy to read and understand by humans. Likewise, IP addresses can be transformed to estimated geographical locations. The technical term for these transformations is mapping.
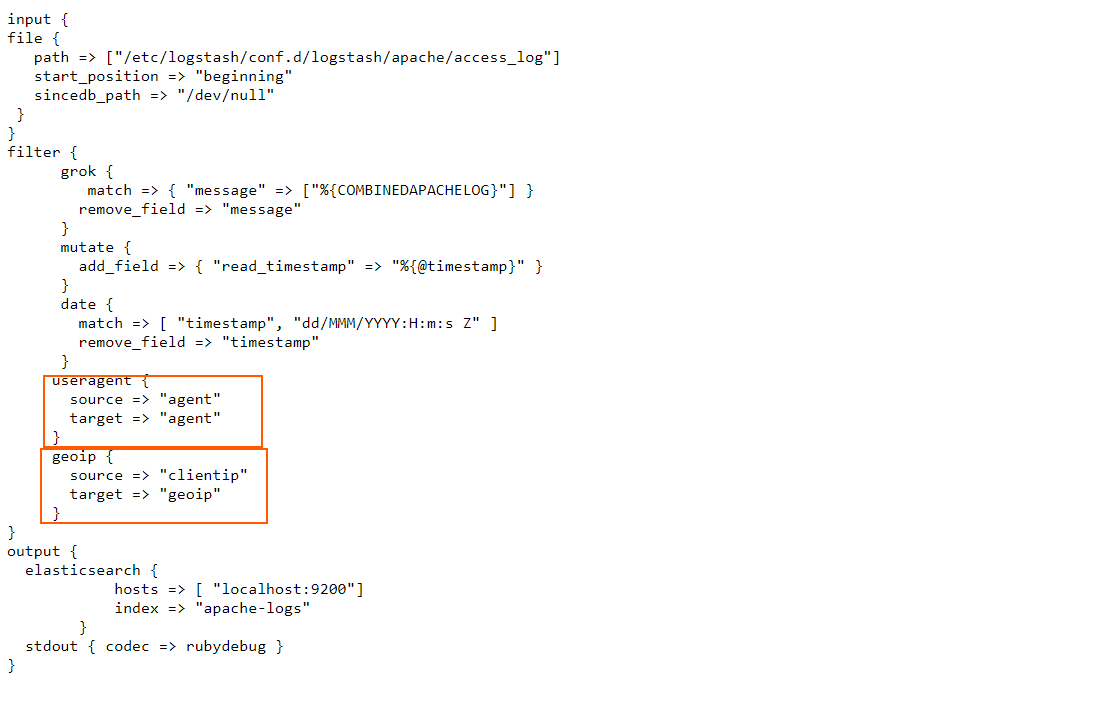
In the useragent filter section, we simply instruct Logstash to take the contents of the agent field, process them accordingly, and map them back to the agent field.
In the geoip filter, we instruct Logstash to take the information from the clientip field, process it, and then insert the output in a new field, called geoip.
Let’s run Logstash with this config and see what happens:
We’ll need to wait for a longer period of time for this to be done as there are many more lines the utility has to process (tens of thousands). As usual, when it’s done, we’ll press CTRL+C to exit.
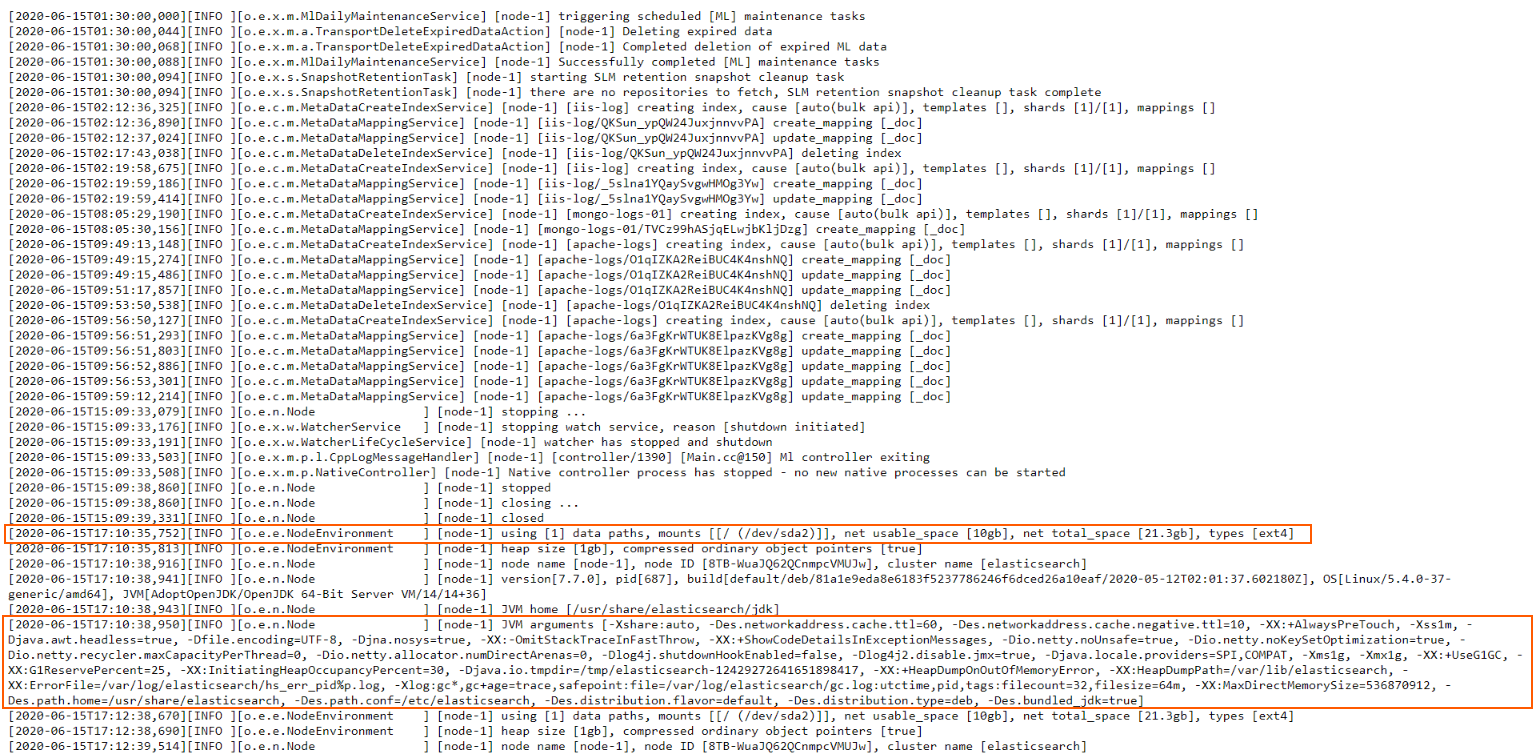
Now let’s explore how this log was parsed and what was inserted to the index:
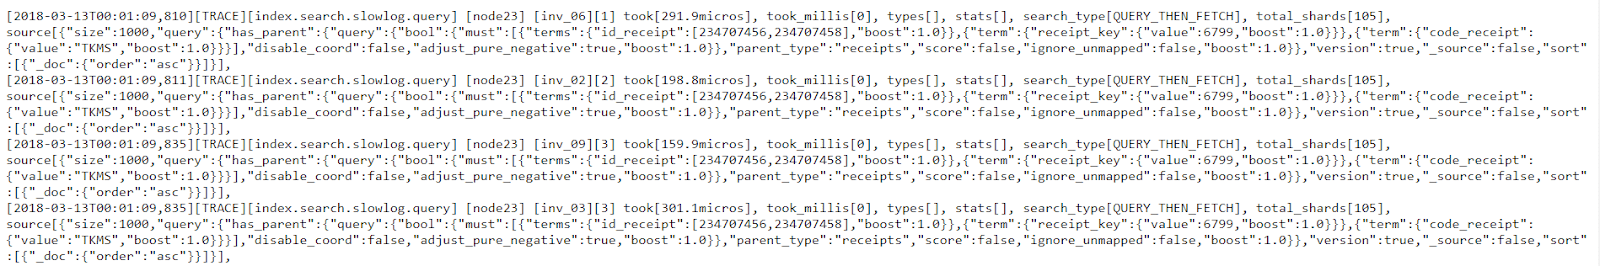
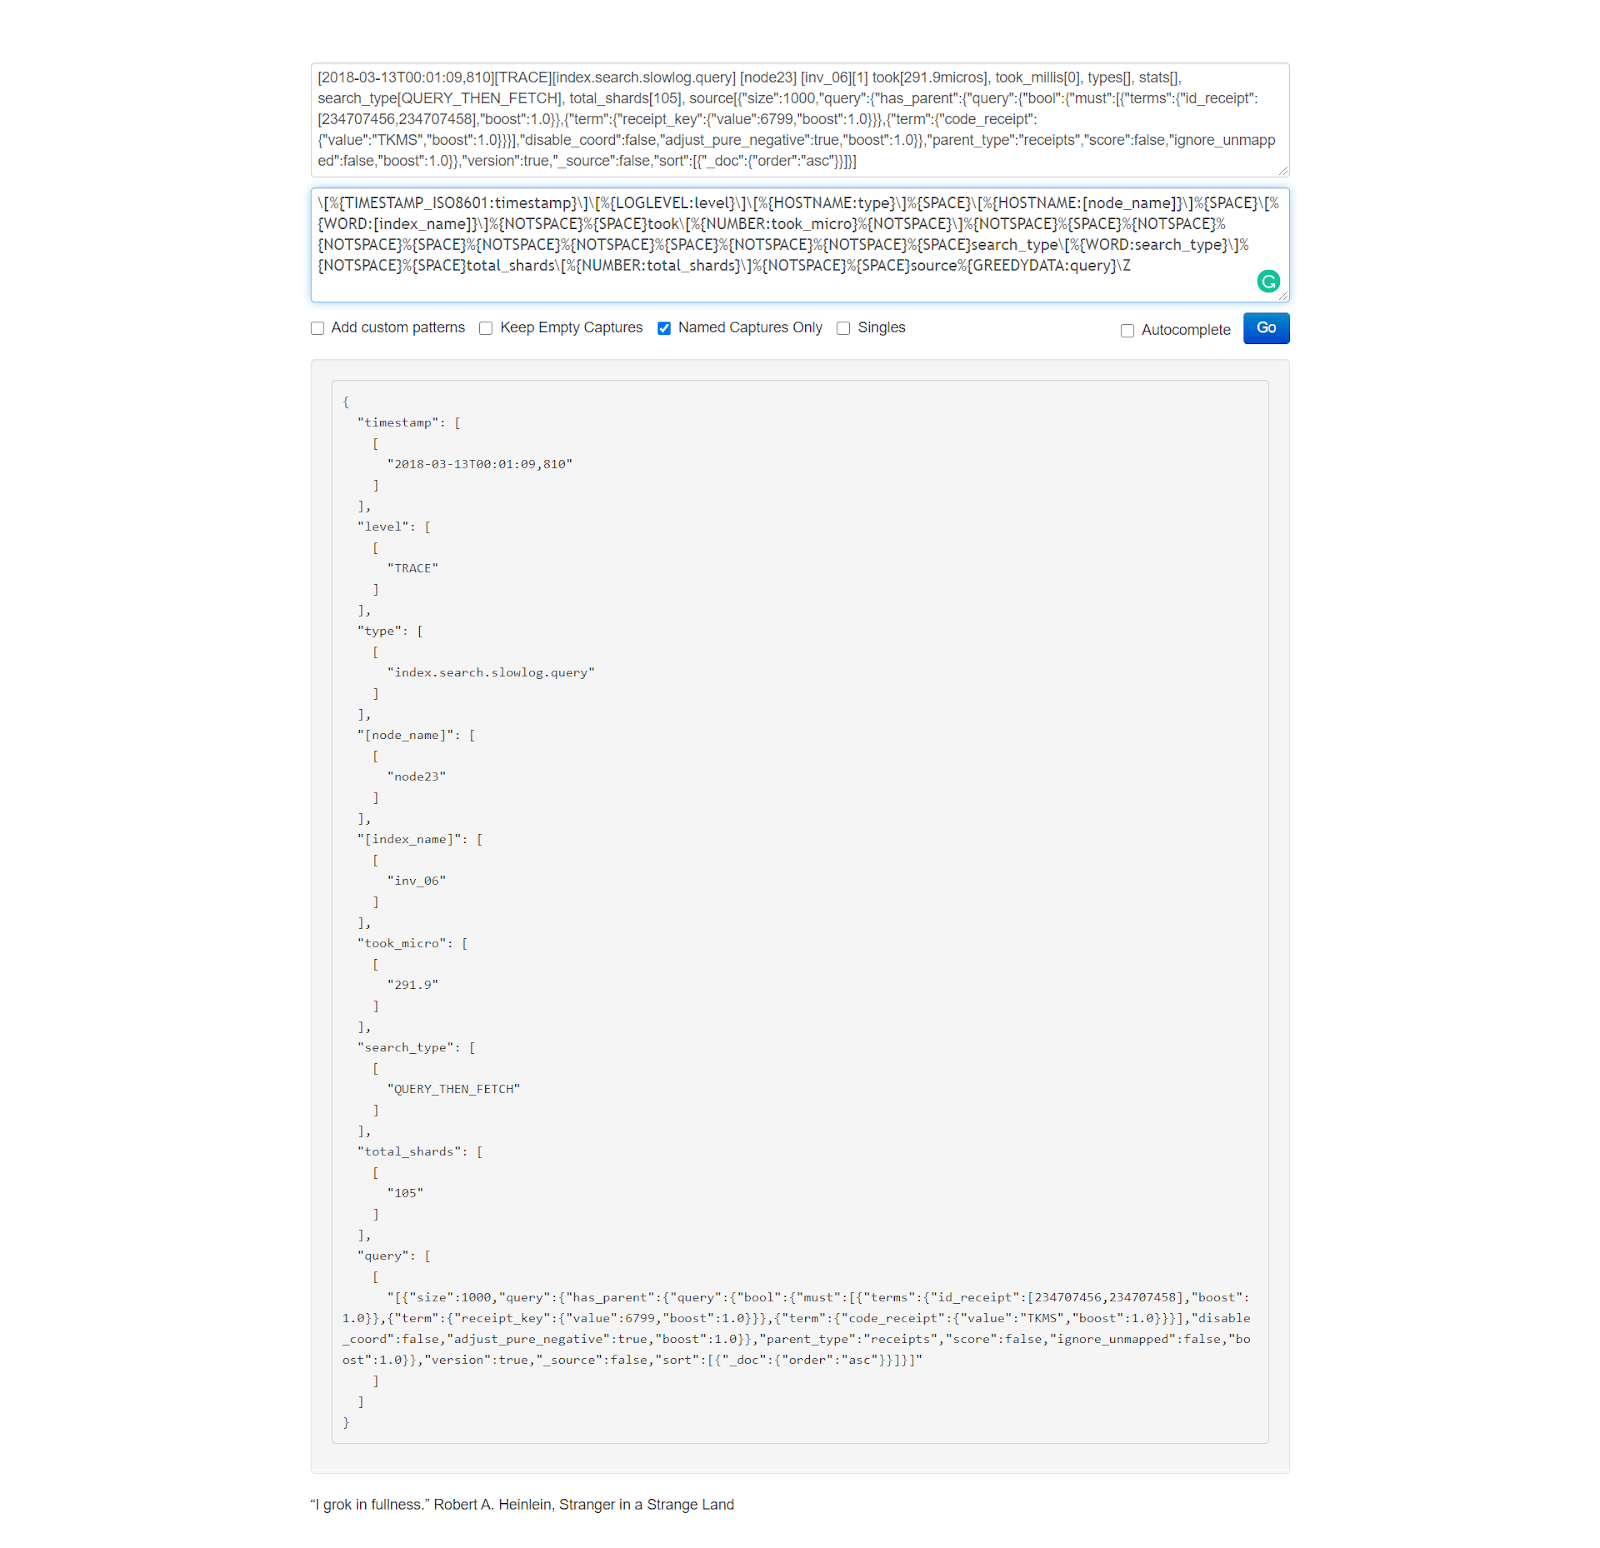
Now, this is slightly different from what we’ve worked with up until now. In all the other logs, each line represented one specific log entry (or message). That meant we could process them line by line and reasonably expect that each logged event is contained within a single line, in its entirety.
Here, however, we sometimes encounter multi-line log entries. This means that a logged event can span across multiple lines, not just one. Fortunately, though, Elasticsearch clearly signals where a logged event begins and where it ends. It does so by using opening [ and closing ] square brackets. If you see that a line opens a square bracket [ but doesn’t close it on the same line, you know that’s a multi-line log entry and it ends on the line that finally uses the closing square bracket ].
Logstash can easily process these logs by using the multiline input codec.
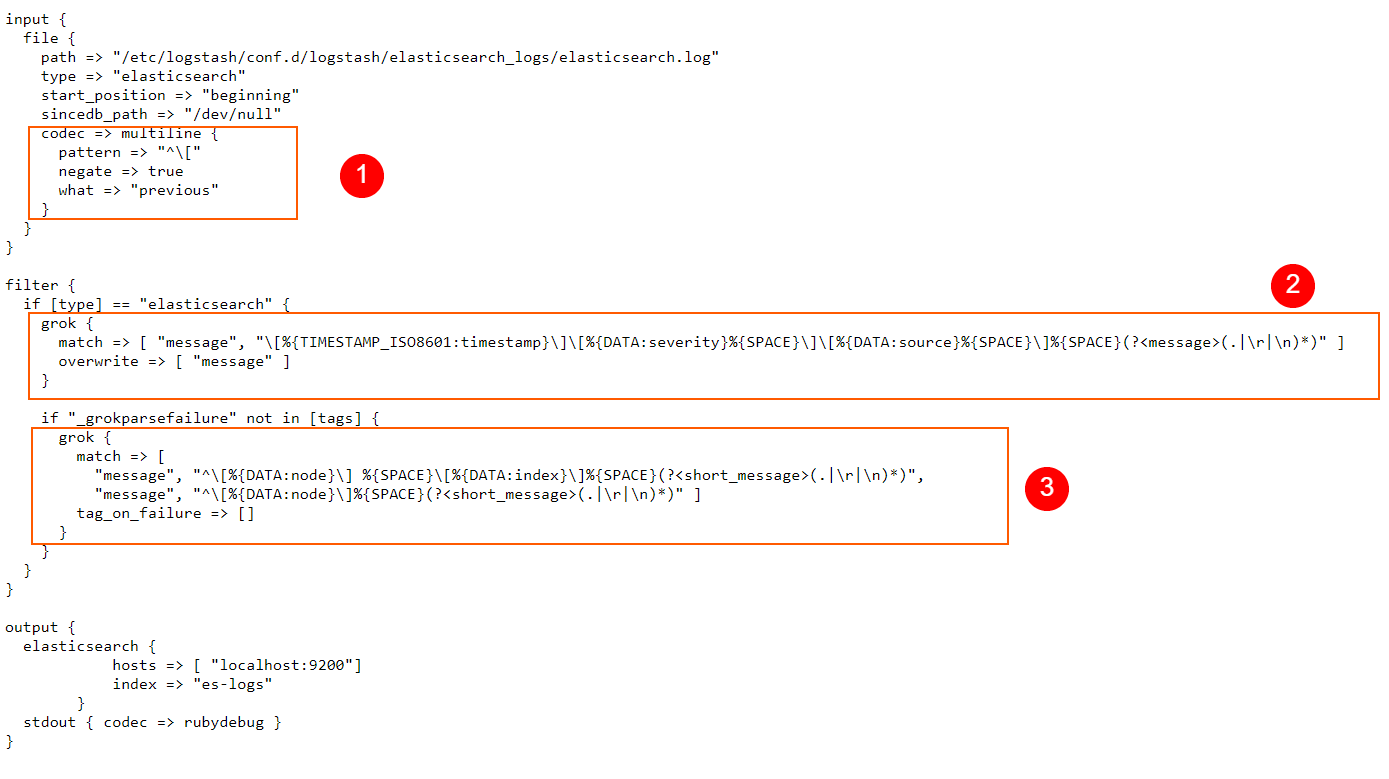
In the codec => multiline section of our config, we define the pattern that instructs Logstash on how to identify multiline log entries. Here, we use a RegEx pattern, but of course, we can also use Grok patterns when we need to.
With negate set to true, a message that matches the pattern is not considered a match for the multiline filter. By default, this is set to false and when it is false, a message that matches the pattern is considered a match for multiline.
“what” can be assigned a value of “previous” or “next“. For example, if we have a match, negate is set to false, and what has a value set to previous, this means that the current matched line belongs to the same event as the previous line.
In a nutshell, what we are doing for our scenario here is telling Logstash that if a line does not start with an opening square bracket [ then the line in the log file is a continuation of the previous line, so these will be grouped in a single event. Logstash will apply a “multiline” tag to such entries, which can be useful for debugging, or other similar purposes if we ever need to know which entry was contained in a single line, and which on multiple lines.
In the filter section we use a typical Grok pattern, just like we did many times before, and replace the message field with the parsed content.
Finally, a second Grok pattern will process the content in the message field even further, extracting things like the logged node name, index name, and so on.
After the program does its job, we press CTRL+C to exit.
Logstash has now parsed both single-line events and multiline events. We will now see how useful it can be that multiline events have been tagged appropriately. Because of this tag, we can now search entries that contain only single-line events. We do this by specifying in our cURL request that the matches must_not contain the tags called multiline.
Elasticsearch can also generate another type of logs, called slow logs and are used to optimize Elasticsearch search and indexing operations. These are easier to process since they don’t contain multiline messages.
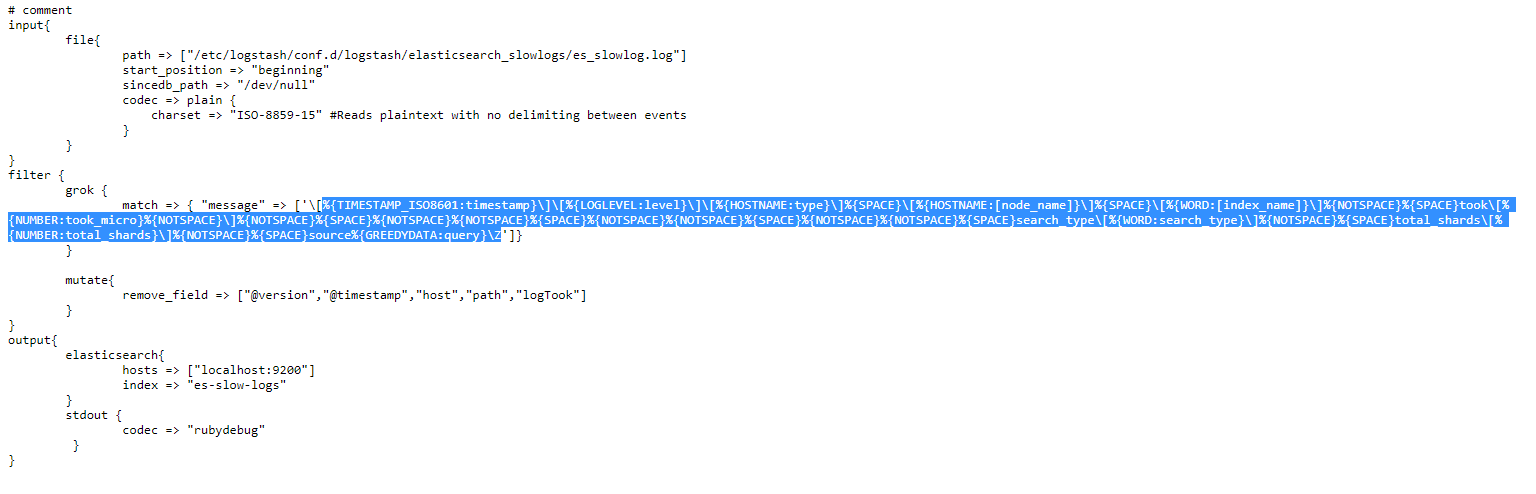
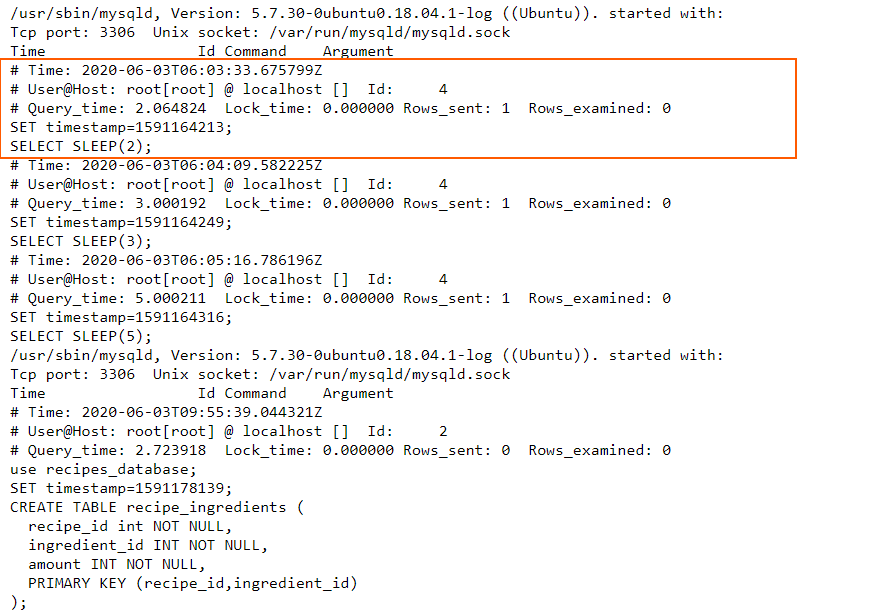
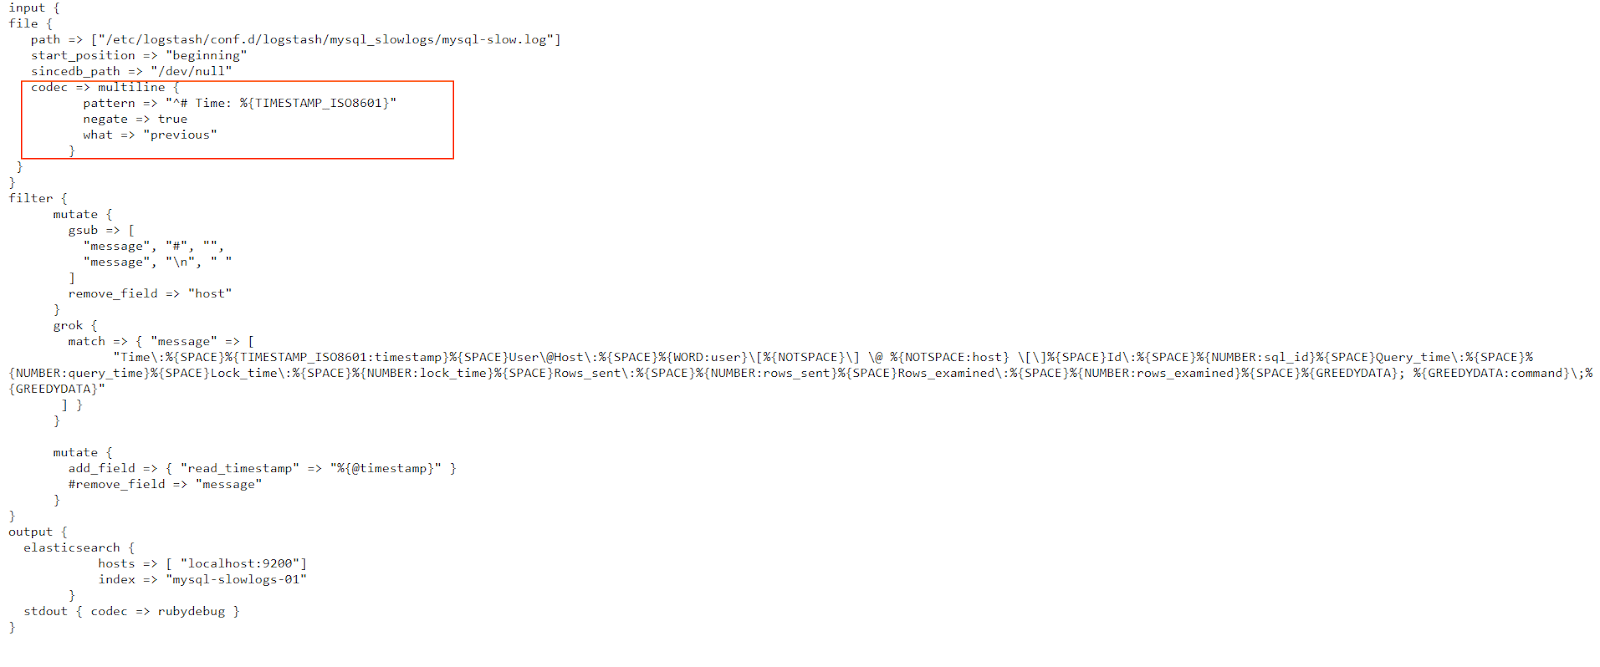
MySQL can also generate slow logs to help with optimization efforts. However, these will log events on multiple lines so we’ll need to use the multiline codec again.
In the multilinecodec configuration, we use a Grok pattern. Simply put, we instruct Logstash that if the line doesn’t begin with the “# Time:” string, followed by a timestamp in the TIMESTAMP_ISO8601 format, then this line should be grouped together with previous lines in this event. This makes sense, since all logged events in this slow log begin with that specific timestamp, and then describe what has happened at that time, in the next few lines. Consequently, whenever a new timestamp appears, it signals the end of the current logged event and the beginning of the next.
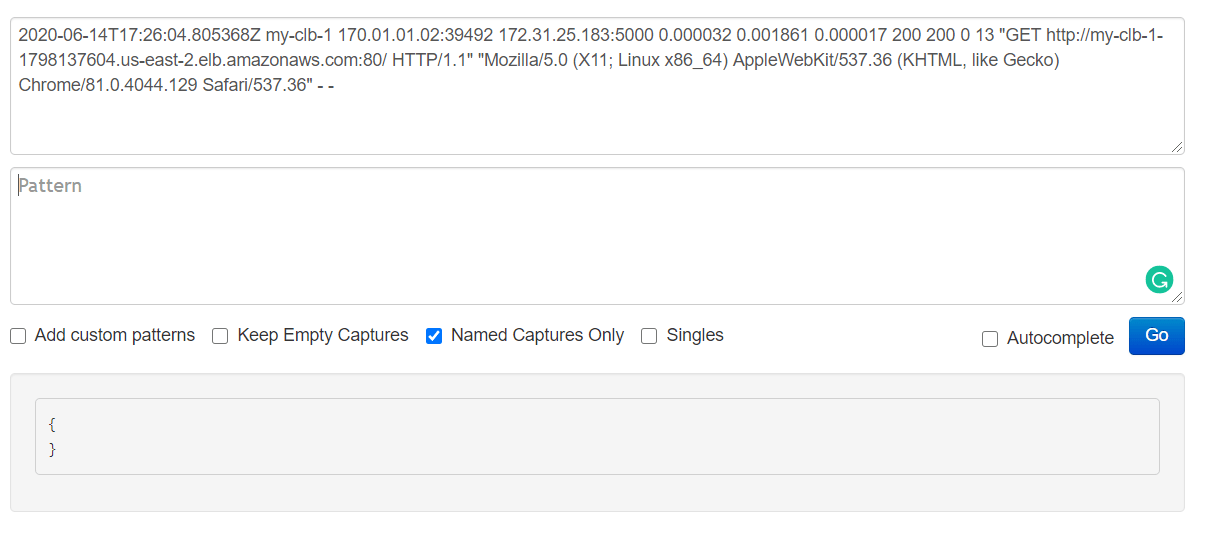
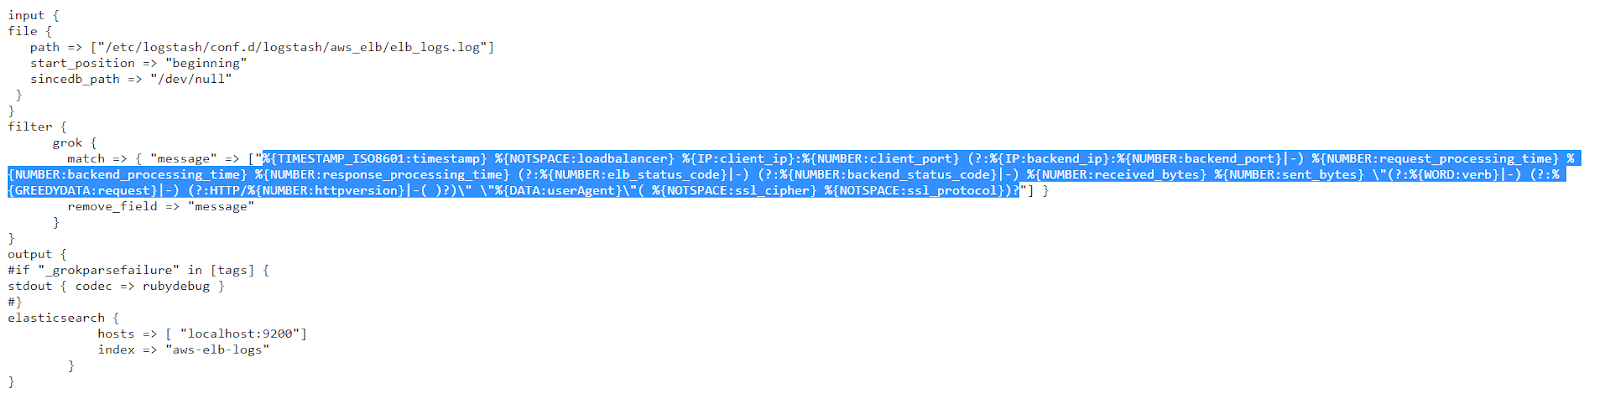
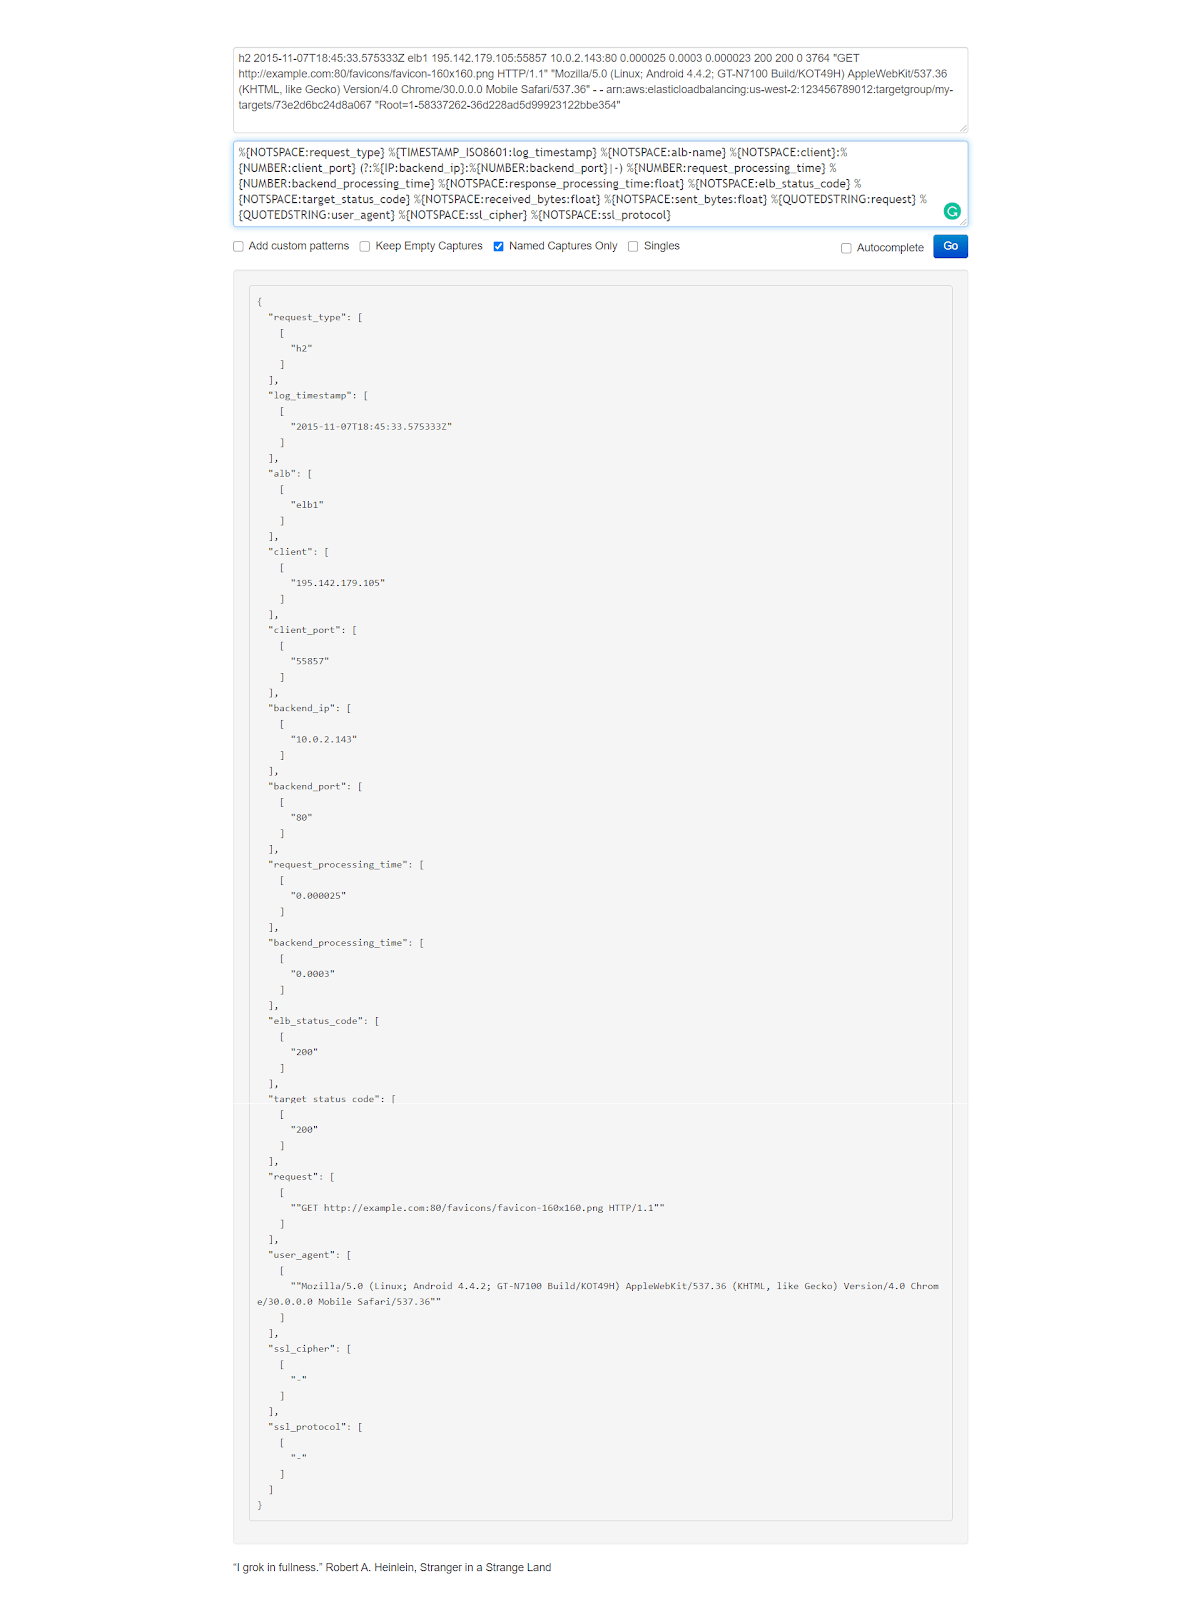
AWS Elastic Load Balancer is a popular service that intelligently distributes traffic across a number of instances. ELB provides access logs that capture detailed information about requests sent to your load balancer. Each ELB log contains information such as the time the request was received, the client’s IP address, latencies, request paths, and server responses.
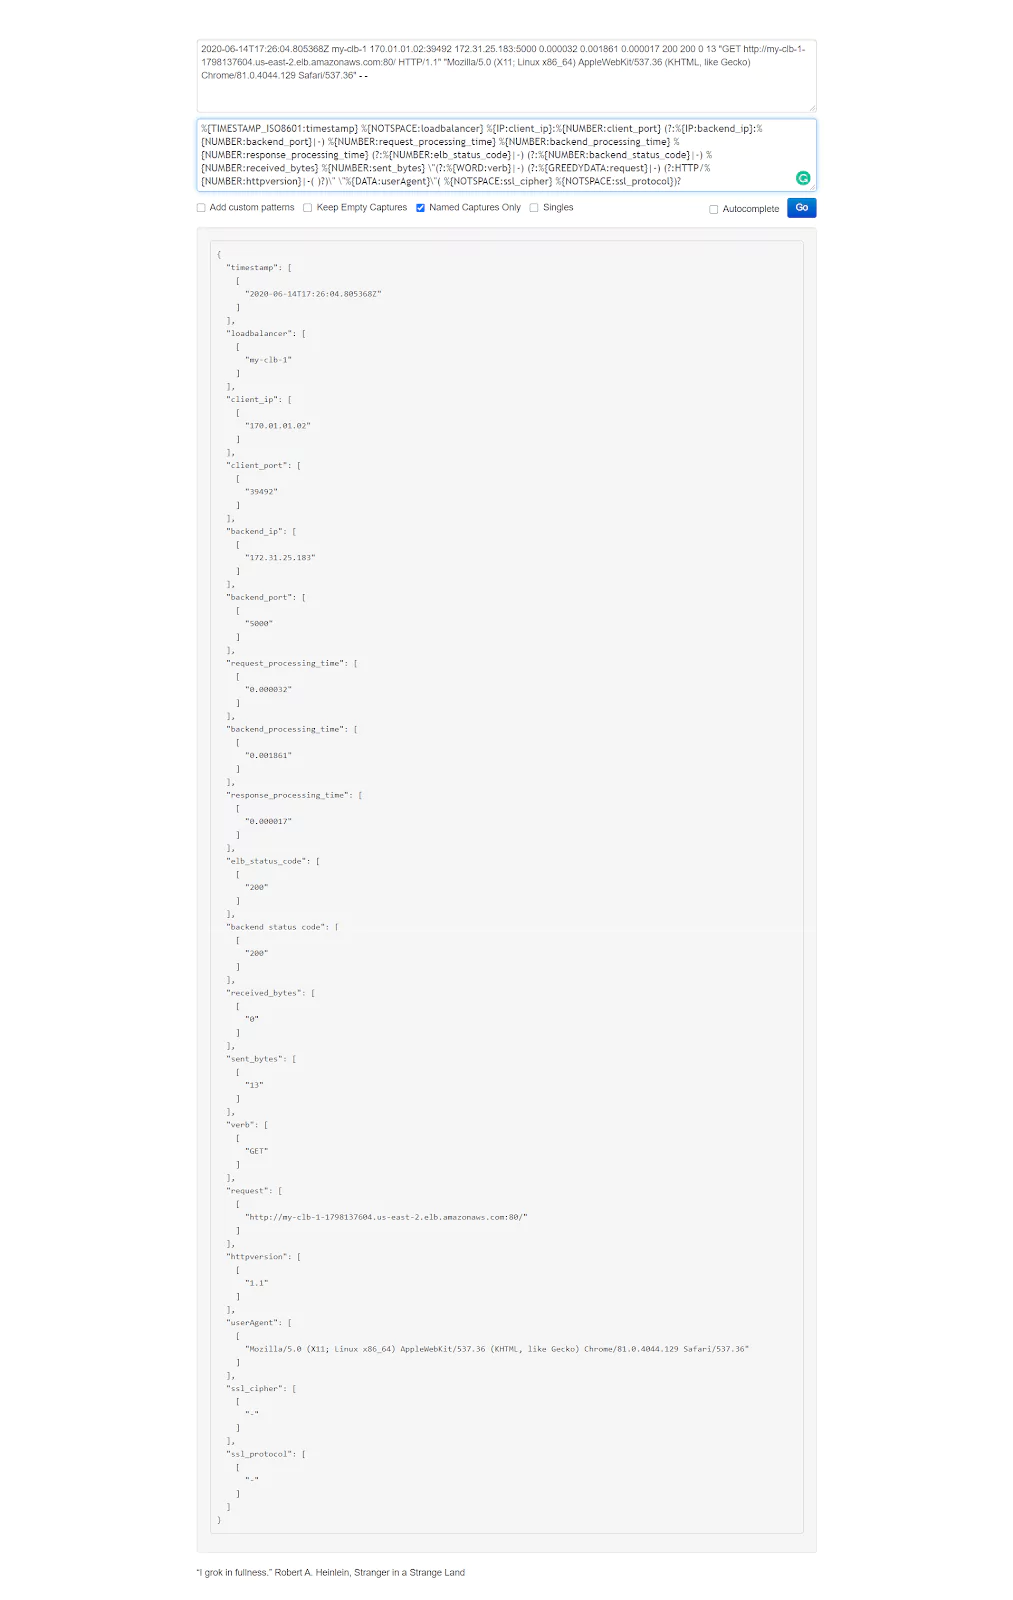
If you want to test things out in the https://grokdebug.herokuapp.com/ website, the input line you can copy and paste into the first field is the following:
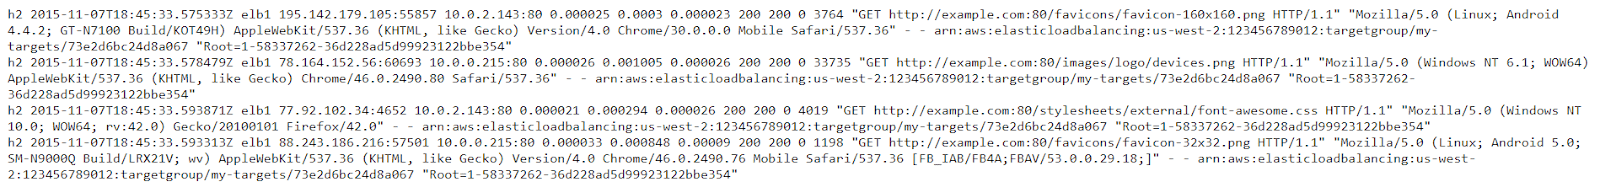
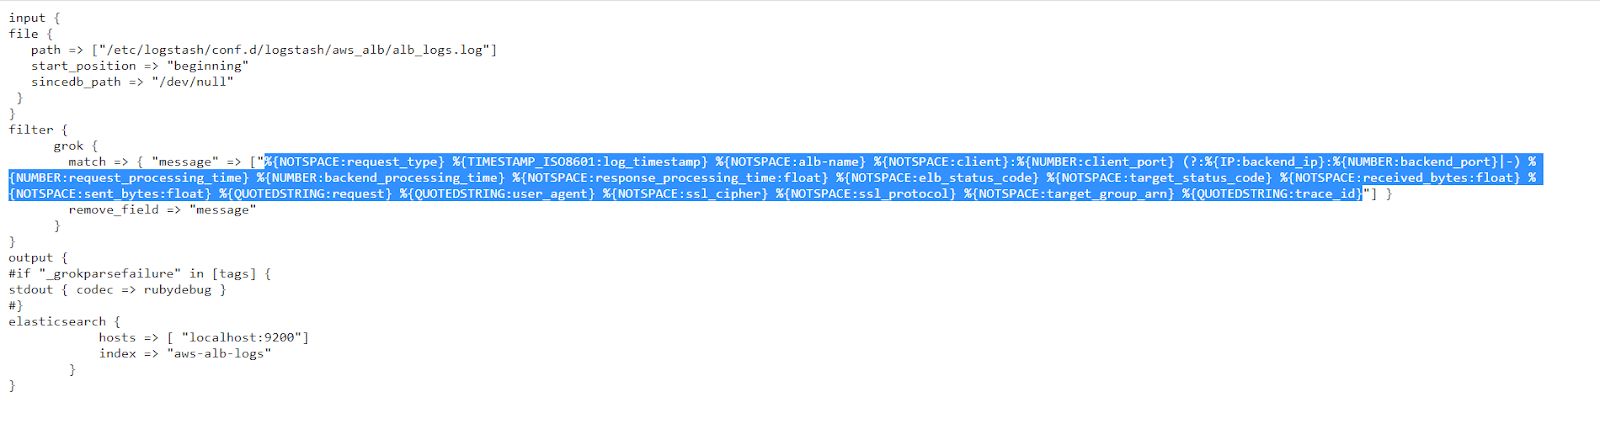
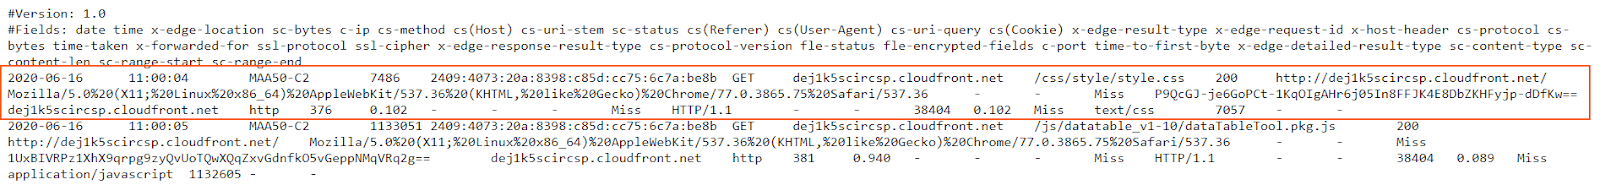
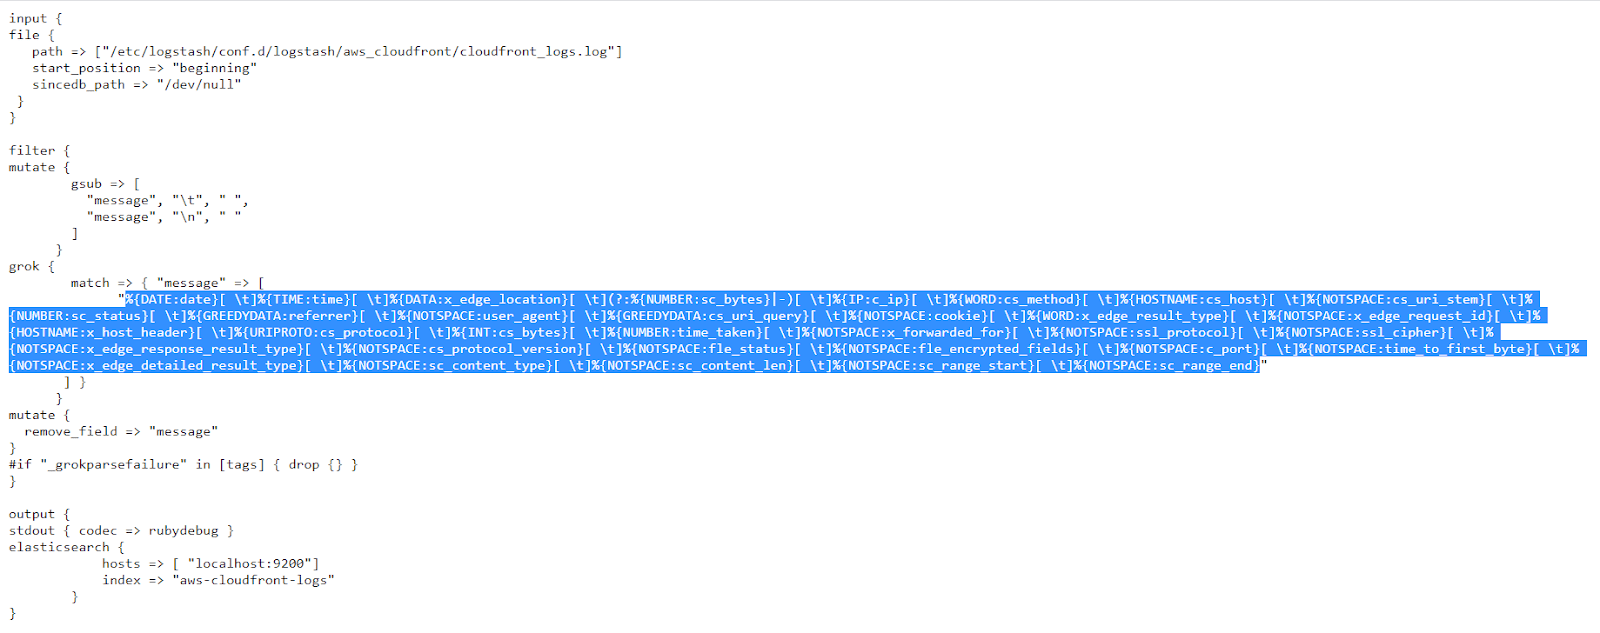
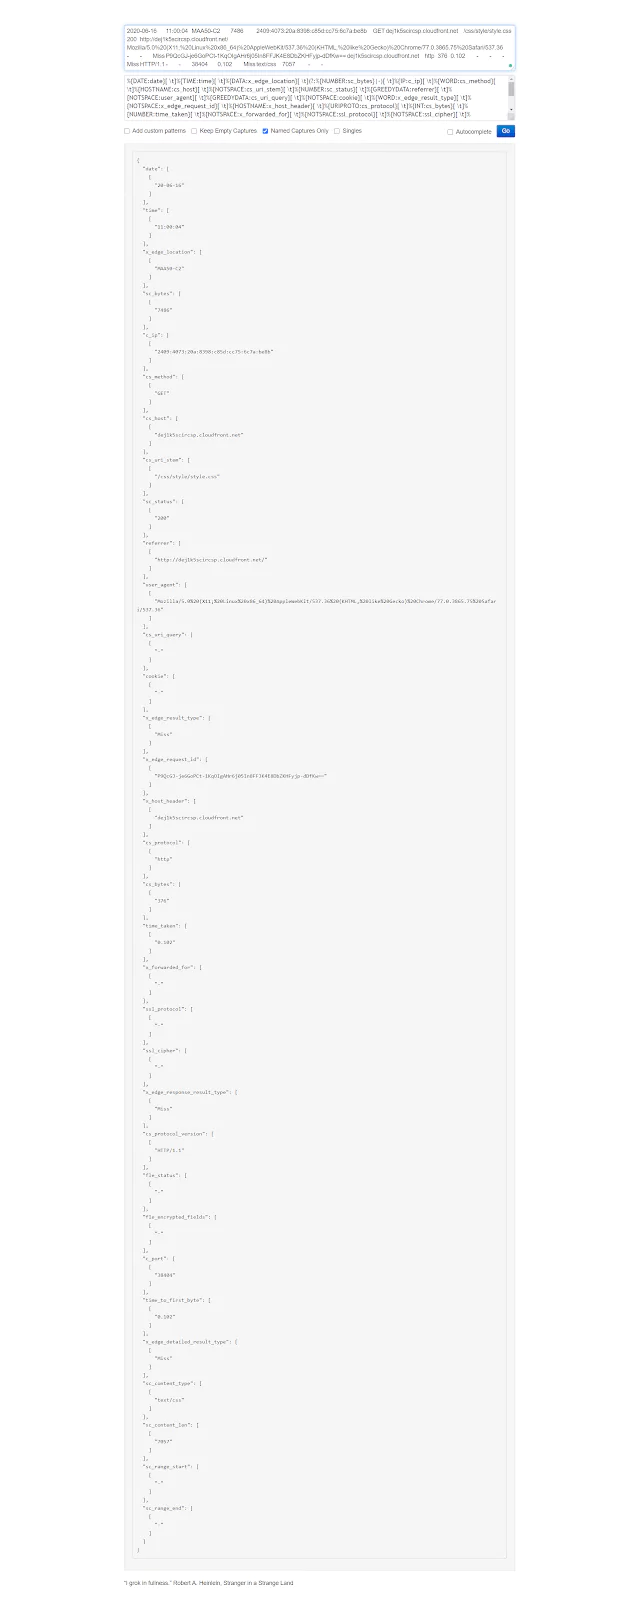
Once again, If you want to test how things work, in the https://grokdebug.herokuapp.com/ website, the input line you can copy and paste into the first field is this one:
2020-06-16 11:00:04 MAA50-C2 7486 2409:4073:20a:8398:c85d:cc75:6c7a:be8b GET dej1k5scircsp.cloudfront.net /css/style/style.css 200 https://dej1k5scircsp.cloudfront.net/ Mozilla/5.0%20(X11;%20Linux%20x86_64)%20AppleWebKit/537.36%20(KHTML,%20like%20Gecko)%20Chrome/77.0.3865.75%20Safari/537.36 - - Miss P9QcGJ-je6GoPCt-1KqOIgAHr6j05In8FFJK4E8DbZKHFyjp-dDfKw== dej1k5scircsp.cloudfront.net http 376 0.102 - - - Miss HTTP/1.1 - - 38404 0.102 Miss text/css 7057 - -
I hope this arsenal of Grok patterns for common log types are useful for most of your future Logstash needs. Keep in mind that if the log you encounter is just slightly different, only slight changes need to be made to these patterns, which you can use as your starting templates.
Syslog is a popular standard for centralizing and formatting log data generated by network devices. It provides a standardized way of generating and collecting log information, such as program errors, notices, warnings, status messages, and so on. Almost all Unix-like operating systems, such as those based on Linux or BSD kernels, use a Syslog daemon that is responsible for collecting log information and storing it.
They’re usually stored locally, but they can also be streamed to a central server if the administrator wants to be able to access all logs from a single location. By default, port 514 and UDP are used for the transmission of Syslogs.
Note: It’s recommended to avoid UDP whenever possible, as it doesn’t guarantee that all logs will be sent and received; when the network is unreliable or congested, some messages could get lost in transit.
For more security and reliability, port 6514 is often used with TCP connections and TLS encryption.
In this post, we’ll learn how to collect Syslog messages from our servers and devices with Logstash and send it to Elasticsearch. This will allow us to take advantage of its super-awesome powers of ingesting large volumes of data and then allowing us to quickly and efficiently search for what we need.
We’ll explore two methods. One involves using the Syslog daemon to send logs through a TCP connection to a central server running Logstash. The other method uses Logstash to monitor log files on each server/device and automatically index messages to Elasticsearch.
Getting Started
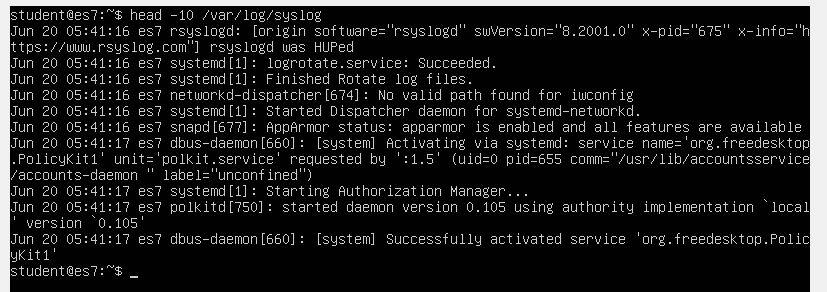
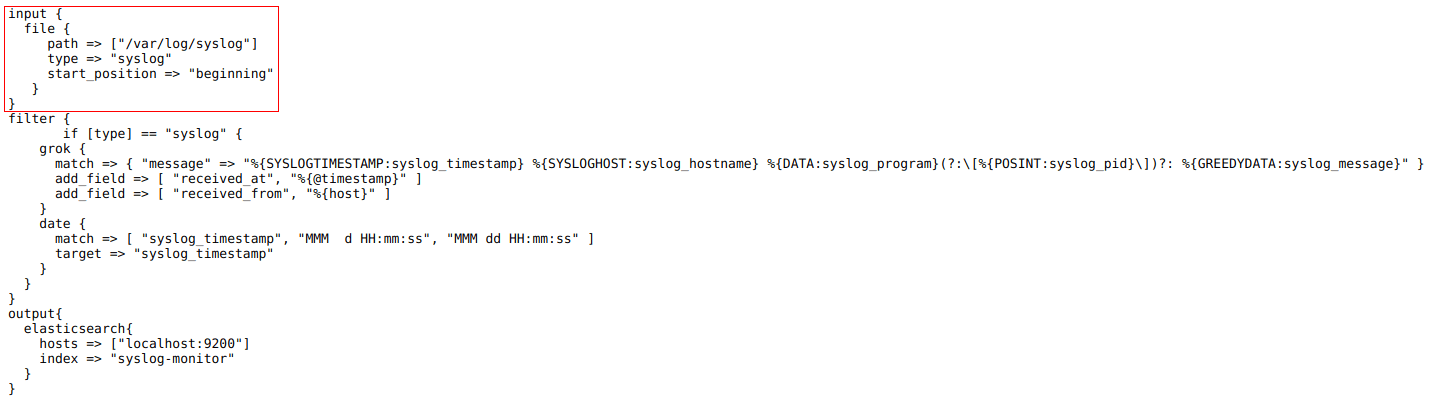
Let’s take a look at how typical syslog events look like. These are usually collected locally in a file named /var/log/syslog.
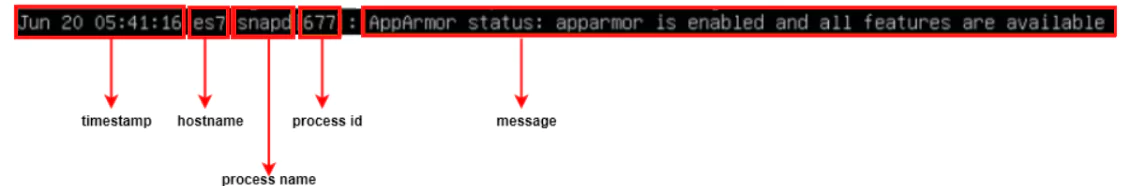
We can see the line starts with a timestamp, including the month name, day of month, hour, minute and second at which the event was recorded. The next entry is the hostname of the device generating the log. Next is the name of the process that created the log entry, its process ID number, and, finally, the log message itself.
Logs are very useful when we want to monitor the health of our systems or debug errors. But when we have to deal with tens, hundreds, or even thousands of such systems, it’s obviously too complicated to log into each machine and manually look at syslogs. By centralizing all of them into Elasticsearch, it makes it easier to get a birds-eye view over all of the logged events, filter only what we need and quickly spot when a system is misbehaving.
Collecting syslog Data with Logstash
In this post, we’ll explore two methods with which we can get our data into Logstash logs, and ultimately into an Elasticsearch index:
Using the syslog service itself to forward logs to Logstash, via TCP connections.
Configuring Logstash to monitor log files and collect their contents as soon as they appear within those files.
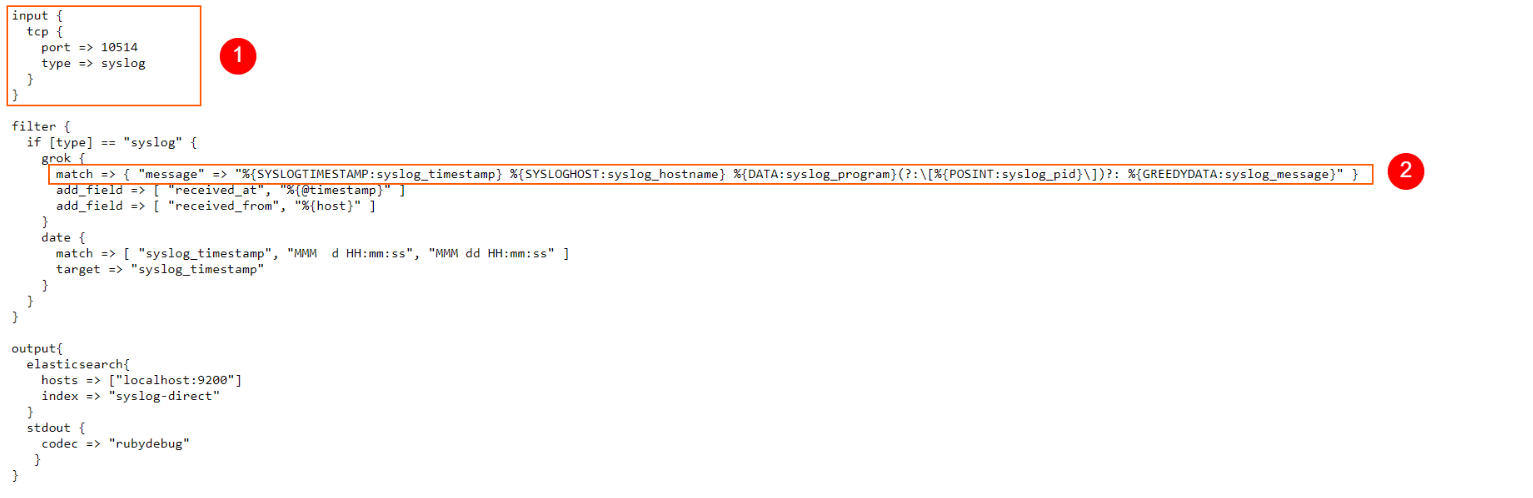
Forwarding Syslog Messages to Logstash via TCP Connections
The syslog daemon has the ability to send all the log events it captures to another device, through a TCP connection. Logstash, on the other hand, has the ability to open up a TCP port and listen for incoming connections, looking for syslog data. Sounds like a perfect match! Let’s see how to make them work together.
For simplicity, we will obviously use the same virtual machine to send the logs and also collect them. But in a real-world scenario, we would configure a separate server with Logstash to listen for incoming connections on a TCP port. Then, we would configure the syslog daemons on all of the other servers to send their logs to the Logstash instance.
Important: In this exercise, we’re configuring the syslog daemon first, and Logstash last, since we want the first captured logged events to be the ones we intentionally generate. But in a real scenario, configure Logstash listening on the TCP port first. This is to ensure that when you later configure the syslog daemons to send their messages, Logstash is ready to ingest them. If Logstash isn’t ready, the log entries sent while you configure it, won’t make it into Elasticsearch.
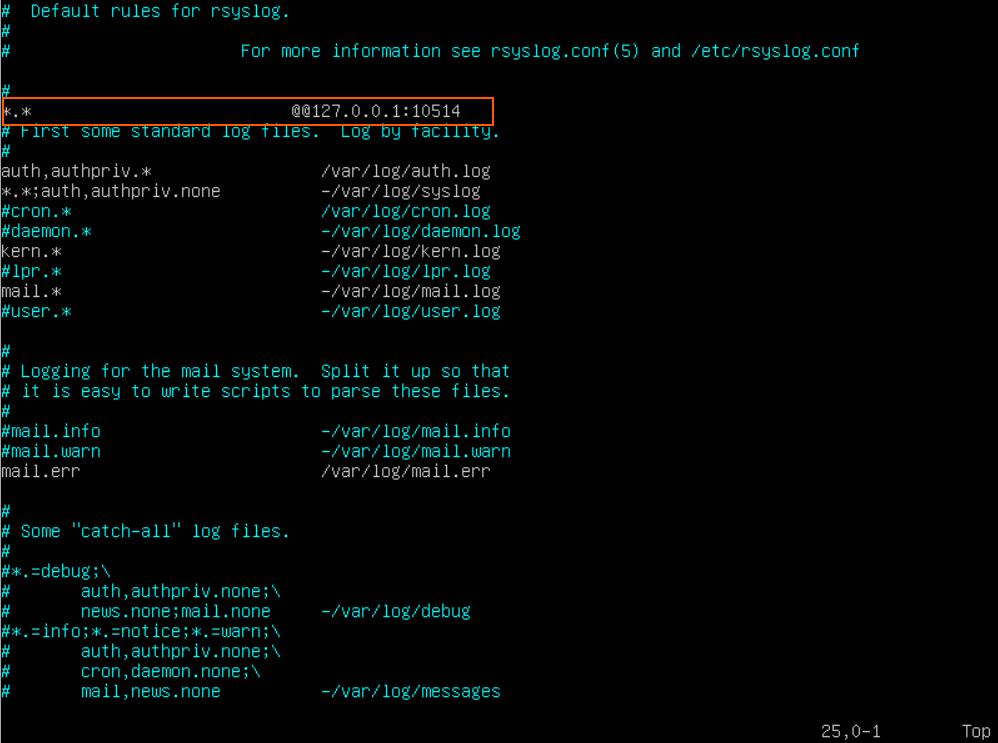
We will forward our syslogs to TCP port 10514 of the virtual machine. Logstash will listen to port 10514 and collect all messages.
Let’s edit the configuration file of the syslog daemon.
sudo nano /etc/rsyslog.d/50-default.conf
Above the line “#First some standard log files. Log by facility” we’ll add the following:
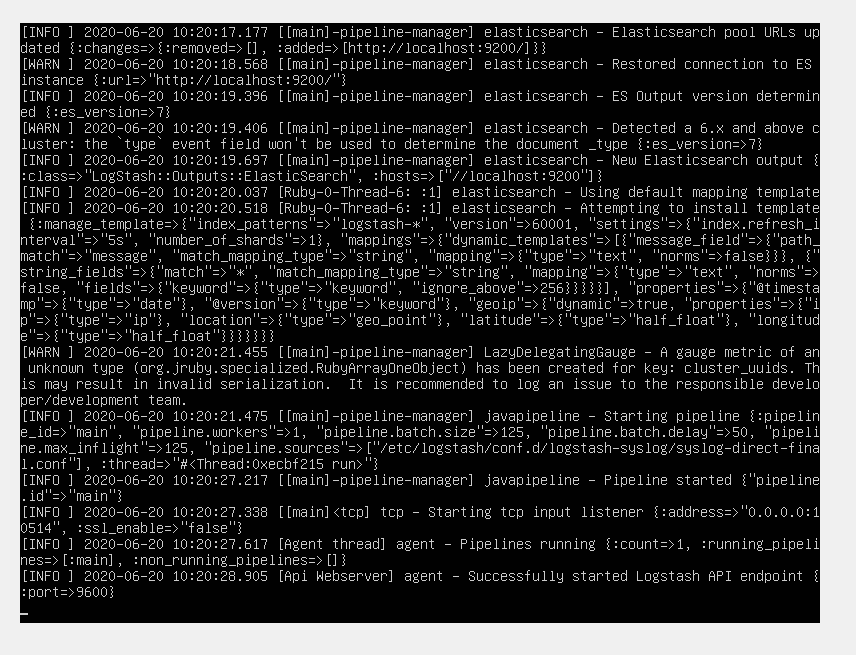
Specifically, we’re looking for the “Successfully started Logstash” message.
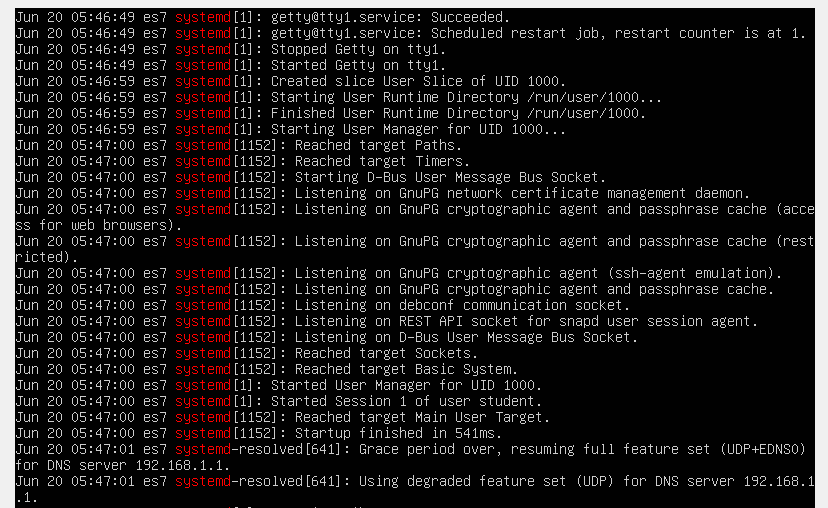
Let’s leave Logstash running in the background, collecting data. Leave its terminal window open (so you can see it catching syslog events) and open up a second terminal window to enter the next commands.
It’s very likely that at this point no syslog events have been collected yet, since we just started Logstash. Let’s make sure to generate some log entries first. A simple command such as
sudo ls
will ensure we’ll generate a few log messages. We’ll be able to see in the window where Logstash is running that sudo generated some log entries and these have been added to the Elasticsearch index.
Awesome! Everything worked perfectly. Now let’s test out the other scenario.
Monitoring syslog Files with Logstash
We’ll first need to stop the Logstash process we launched in the previous section. Switch to the terminal where it is running and press CTRL+C to stop it.
and also delete the directory where we placed our Logstash config files.
sudo rm -r /etc/logstash/conf.d/logstash-syslog
Conclusion
As you can see, it’s fairly easy to gather all of your logs in a single location, and the advantages are invaluable. For example, besides making everything more accessible and easier to search, think about servers failing. It happens a little bit more often than we like. If logs are kept on the server, once it fails, you lose the logs. Or, another common scenario, is that hackers delete logs once they compromise a machine. By collecting everything into Elasticsearch, though, you’ll have the original logs, untouched and ready to review to see what happened before the machine experienced problems.
Logstash is a tool to collect, process, and forward events and messages and this log monitoring Logstash tutorial will get you started quickly. It was created by Jordan Sissel who, with a background in operations and system administration, found himself constantly managing huge volumes of log data that really needed a centralized system to aggregate and manage them. Logstash was born under this premise and in 2013 Sissel teamed up with Elasticsearch.
The collection is accomplished via configurable input plugins including raw socket/packet communication, file tailing, and several message bus clients. Once an input plugin has collected data it can be processed by any number of filter plugins that modify and annotate the event data. Finally, Logstash logs and routes events to output plugins that can forward the data to a variety of external programs including Elasticsearch, local files, and several message bus implementations.
Logstash Configuration File
The Logstash configuration file specifies which plugins are to be used and how. You can reference event fields in a configuration and use conditionals to process events when they meet certain criteria. When running Logstash, you use -f to specify your config file.
The configuration file has a section for each type of plugin you want to add to the event processing pipeline:
input {
... }filter { ... }output { ...
}
Multiple filters can be applied in the order of their appearance in the configuration file and within each section, we list the configuration options for the specific plugin.
Settings vary according to the individual plugin. A plugin can require that a value for a setting be of a certain type. The following are the supported types.
Inputs and outputs support codec plugins that enable you to encode or decode the data as it enters or exits the pipeline without having to use a separate filter.
RUBY filter plugin
Execute ruby code. This filter accepts inline ruby code or a ruby file, by using ruby code we can define our application name as well as the subsystem name (by changing the values in it). It can be defined by using the following structure:
filter {
  ruby {code => "
                event.set('[@metadata][application]', event.get('application'))
                event.set('[@metadata][subsystem]', event.get('subsystem'))
                event.set('[@metadata][event]', event.to_json)
                "}
}
#If you wish to make application and subsystem names static you can replace the event.get
string with a plain string.
HTTP output plugin
Most of our examples will use Coralogix Logstash output plugin. The plugin configuration has the following structure:
takes an existing field which contains JSON and expands it into an
#actual data structure within the Logstash event. In this case it will take the content of
#‘extra_data’, an original DB column, skip_on_invalid_json allows the filter to skip
#non-json or non-valid json field values without warnings or added logic.filter { json { source => "extra_data" target => "extra_data" skip_on_invalid_json => true }}
 is being used. It Stream events from files, normally by
#tailing them (this is configurable). All logs will get A field called stype’ added to them
#with the value ‘production-log’. ‘path’ indicates where to read the logs from and the
. The codec decodes (via inputs) and encodes (via outputs) full JSON messages.input { file { type => "production-log" path => "/home/admin/apps/fiverr/current/log/production.log" codec => "json" }}#This output will send logs to a Redis queue using the
. It is using an ‘if”
#statement to direct only logos with type:”production-log" to the output.output { if [type] == "production-log" { redis { host => "192.168.0.2" port => 6379 data_type => "list" key => "logstash-production-log" codec => "json_lines" } }}
is being used. This time with the ‘exclude’
#parameters that indicates which files to ignore as input. The multiline codec collapses
#multiline messages and merges them into a single event. In this example it will start a
#new event every time it recognizes a string of word characters that ends with 4 digits, followed
#by what looks like a time stamp in the form of tt:tt:tt.mmmmmm. This is the regex associated
#with the ‘pattern’. Negate “true” means that a message not matching the pattern will
#constitute a match of the multiline filter and the what config parameter will
#be applied #and indicate the relation to the multi-line event.input { file { path => "/mnt/data/logs/pipeline/*.1" exclude => "*.gz" codec => multiline { pattern => "w+d{4} d{2}:d{2}:d{2}.d{6}" negate => true what => previous } }}#The
parses arbitrary text and structures it. In this example it will parse #the event message field into additional log fields designated by the regex named #groups. It will get the rest of the log into a field named log and will than remove the #original message field.filter { grok { match => { "message" => "(?<loglevel>[A-Z]{1})(?<time>%{MONTHNUM}%{MONTHDAY} %{TIME}) %{POSINT:process}-%{POSINT:thread} %{DATA:function}:%{POSINT:line}] %{GREEDYDATA:log}" } remove_field => [ "message" ] }# Next in line to process the event is the
is used to rename, remove, replace, and modify fields in your events. #The order of mutations is kept by using different blocks. mutate {#This section creates a parent field called message for all these different fields. rename => { "loglevel" => "[message][loglevel]" "process" => "[message][process]" "thread" => "[message][thread]" "function" => "[message][function]" "line" => "[message][line]" "log" => "[message][log]" "message" => "[message][message]" }
#Copies source =>destination copy => {
"time" => "[message][message][time]" "path" => "[message][log_path]" } } mutate {#Converts the field type convert => { "[message][message][process]" => "integer" "[message][message][thread]" => "integer"
"[message][message][line]" => "integer" } }#The
 is used for parsing dates from fields, and then using that date or #timestamp as the logstash timestamp for the event. In this case there is only one #format to look for in the field time. It will update the default @timestamp field for the #event and then remove the field time from the event.
  date {
    match => [ "time", "MMdd HH:mm:ss.SSS" ]
    remove_field => [ "time" ]
  }
 is being used. Sincedb_path holds the path to the
#file that holds the current position of the monitored log files. Read mode means that the files
#will be treated as if they are content complete. Logstash will look for EOF and then emit the
#accumulated characters as a line. This helps with processing zip’ed files. discover_interval
#sets the frequency the plugin will use the regular expression to look for new files. Stat_interval
#sets the frequency we check if files are modified. File_completed_action = log and
#file_completed_path  combined will append the read file upon completion to the file species in
#file_completed_path. File_chunk_size set the block size to be read from the file. In this
#configuration we specified 4x the default 32KB chunk. The
Logstash can parse CSV and JSON files easily because data in those formats are perfectly organized and ready for Elasticsearch analysis. Sometimes, though, we need to work with unstructured data, like plain-text logs. In these cases, we’ll need to parse the data to turn it into structured data using Logstash Grok or another 3rd party service like Coralogix. This tutorial will help you use Elasticsearch’s analysis and querying capabilities by parsing with Logstash Grok.
So, let’s dive in and learn how to deal with unstructured data using the Logstash Grok filter.
Why Choose Grok?
Logstash Grok isn’t the only option available to parse unstructured logs. Plenty of other plugins, such as Dissect, third-party log management tools, or just plain RegEx, could do the trick. We can even build our own custom parsing logic if we have super-specific needs.
Grok is a popular choice for a multitude of reasons, starting with how easy it is to use. Grok patterns are relatively easy to understand, especially if we are already familiar with regular expressions, and come with a wide range of built-in patterns for common log formats such as timestamps, IP addresses, and URLs. We can also create custom patterns to cater to our exact requirements.
While there are standalone Grok parser libraries available for various programming languages, Logstash Grok is specifically designed for Logtsash and the tight integration means we can easily incorporate Grok patterns into our Logstash configurations. On top of that, the plugin has been available for years and has a large community of users who share new patterns and best practices online.
Dissect Vs Grok
People often ask if they should use Grok or Dissect to parse their logs in Logstash.
While Grok uses regular expressions to match patterns within log lines, Dissect operates by splitting log lines into key-value pairs based on predefined delimiters such as spaces, commas, or other characters. Dissect is often faster and more efficient than Grok if our log formats have well-defined structures and consistent delimiters. It also means that Dissect configurations are simpler and more concise than Grok patterns, especially for straightforward log formats. However, it is worth noting that Dissect is less flexible than Grok when dealing with more complex unstructured log data. We can decide to use one or the other, or both for a hybrid use case when a section of the line is reliably repeated, but the entire line is not.
Now that we have learned more about Grok and the alternatives let’s dive into Logstash Grok filters.
Theory
In a CSV file, each record has an identical list of fields. The sequence of these fields repeats predictably for any program to read in a structured way. Naturally, this is an ideal situation for Elasticsearch.
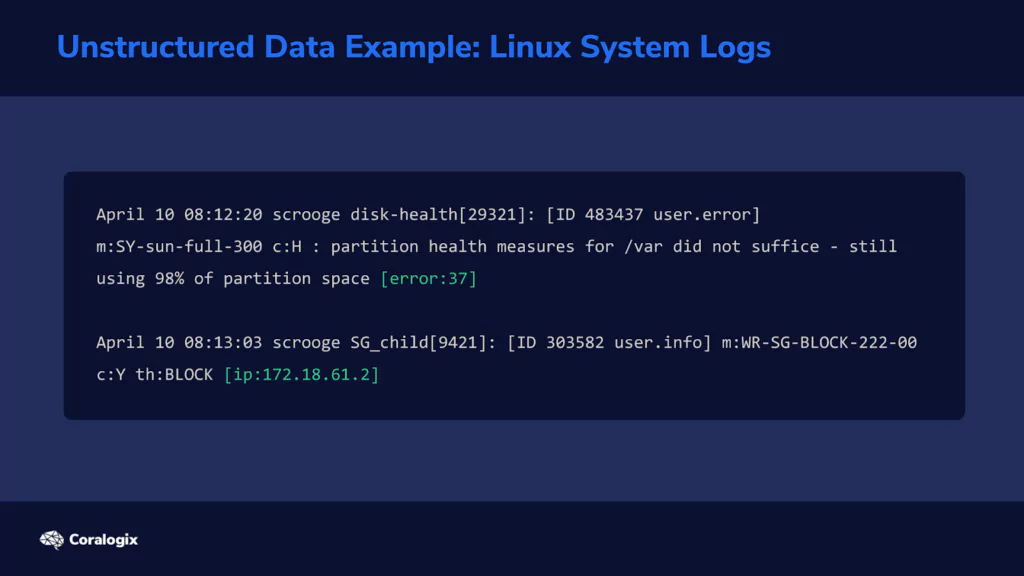
In other cases, information cannot be organized in this ideal way. Consider a typical Linux system log.
Multiple programs write their status or error messages to the same log file. On one line in the log, the last field might be an error code. But on the following line, the last field might be an IP address. This means that the parser now needs to have a way to “detect” what each field represents. Let’s look at how the Grok filter does this.
Understanding Grok Patterns and Syntax
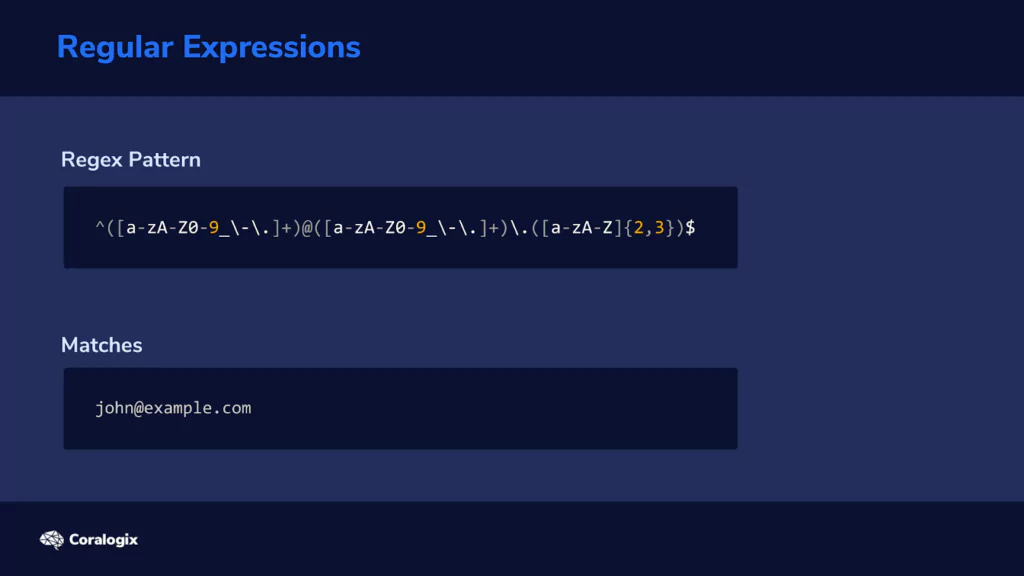
When we see something like “[email protected],” we immediately think of “email address” because we have learned to recognize this pattern. Grok can do the same thing by analyzing each piece of text and checking if it matches the patterns you instruct it to look for.
Grok uses regular expressions, or RegEx for short, behind the scenes, which can look weird for someone unfamiliar. For example, here’s how a regular expression that matches an email looks like:
Fortunately, many common expressions are already predefined in Logstash’s Grok filter, and we can use their pattern names instead of writing those complicated strings of characters ourselves.
We can find a list of these predefined pattern names on the documentation page for the Grok filter plugin.
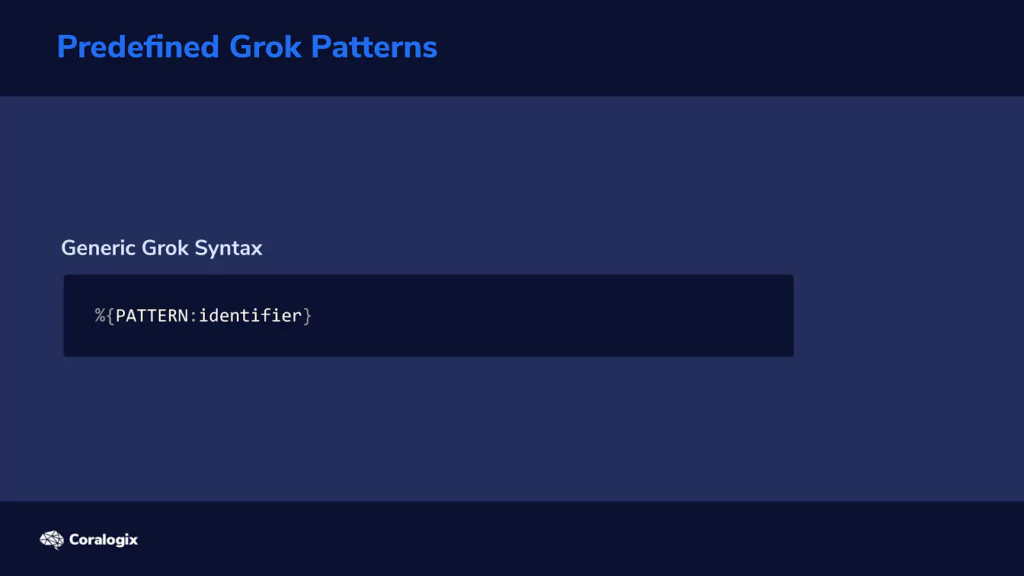
The generic Grok syntax looks like this:
In a nutshell, we tell it what pattern to look for and how to label the strings that match those patterns.
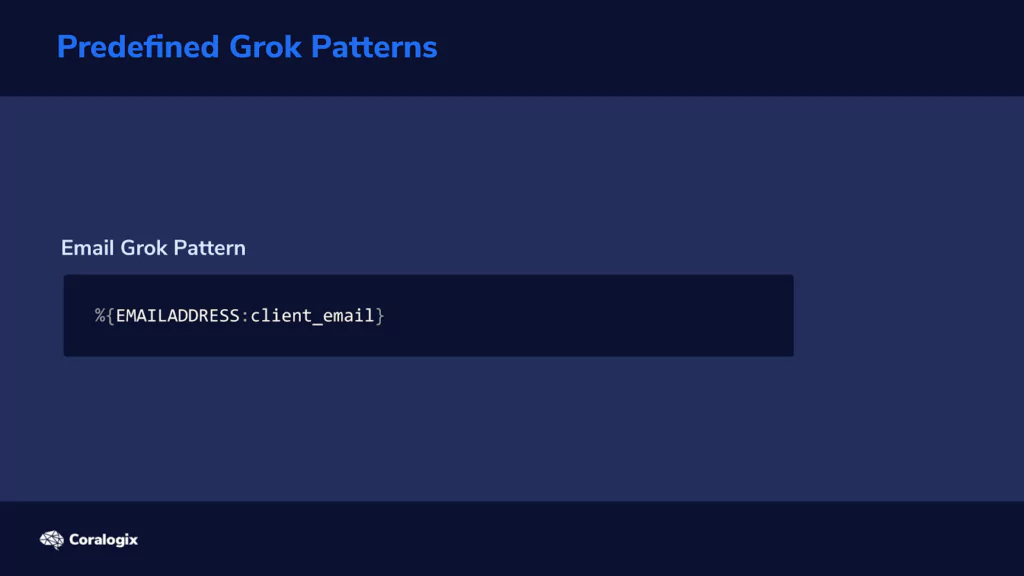
Back to our earlier example, this is how to define and label email addresses:
This Grok pattern will look for all email addresses and identify each as “client_email.” You’re free to choose whatever identifier name you want.
In our case, identifiers will be used as field names for matched values that will be imported to the index. We’ll see how this works in the hands-on exercises to follow.
Example Grok Filter
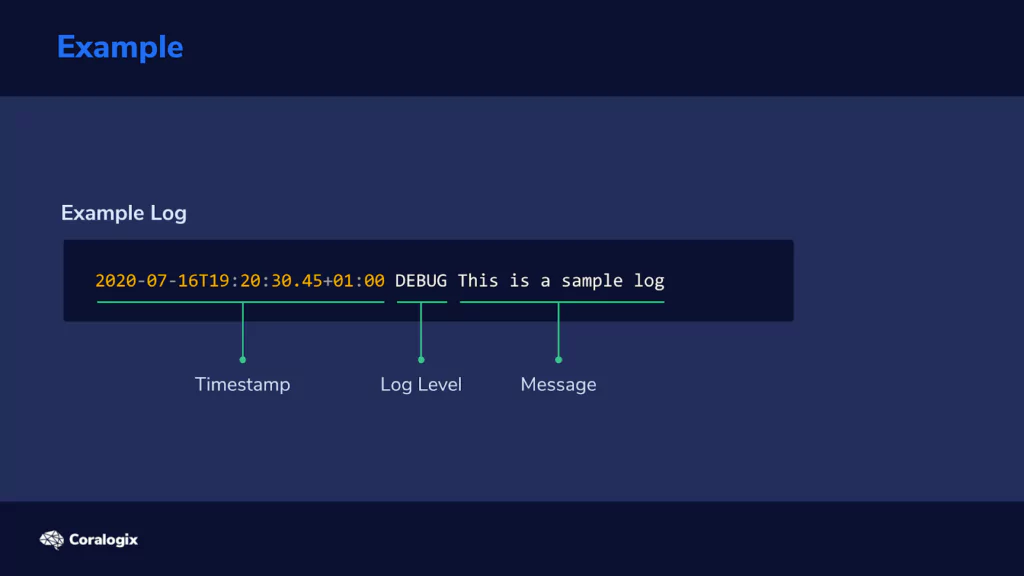
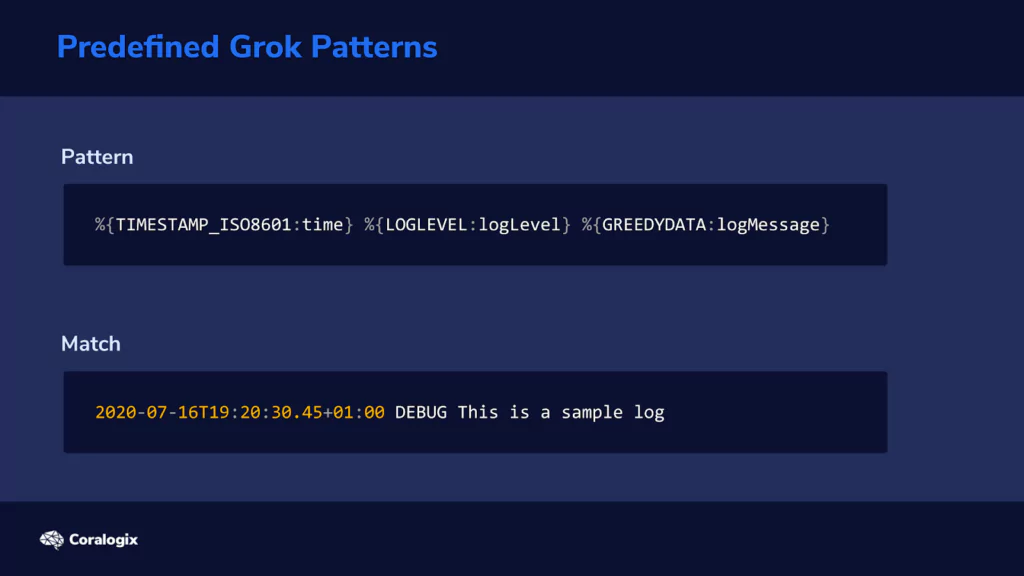
Let’s analyze how we would use Grok. Consider the following line in a log file:
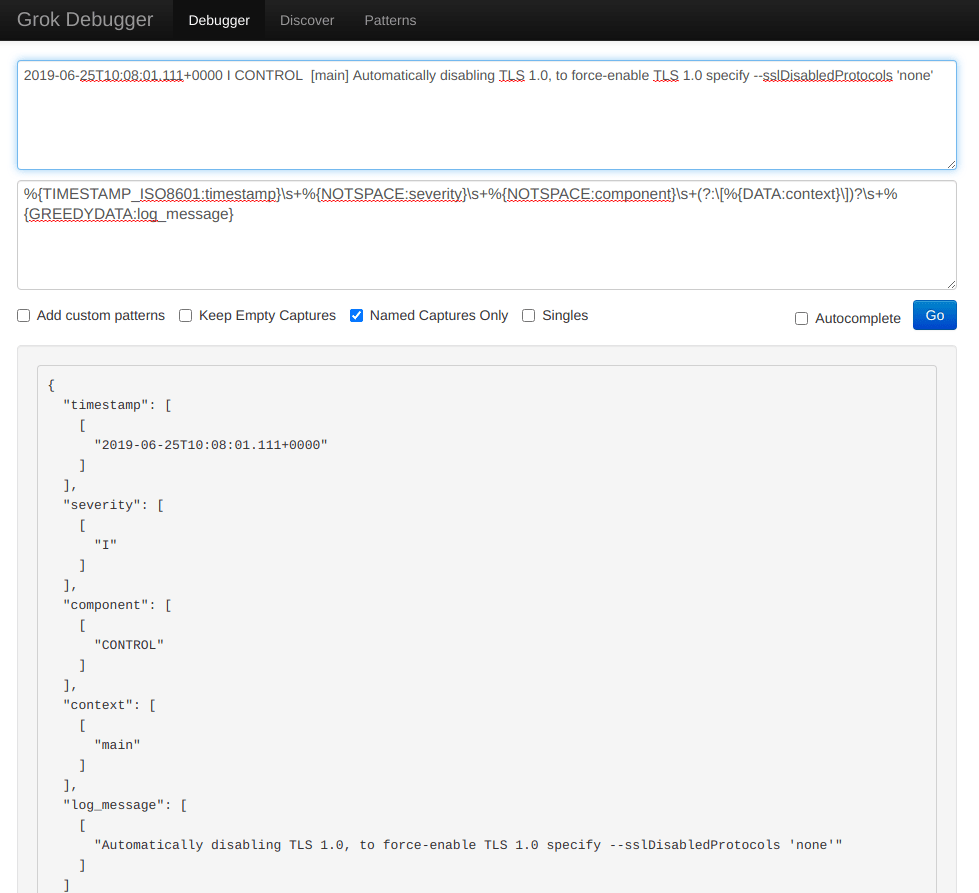
We can see three logical components here: a timestamp, the level of logging, and the error or status message.
The timestamp is in the so-called ISO format, which is useful since we have a Grok pattern that is already available.
How would we define a Grok filter that would extract the three components from this piece of log text? Well, here it is:
GREEDYDATA might sound mysterious, but all it does is match all other characters in the string analyzed, so it extracts the rest of the text.
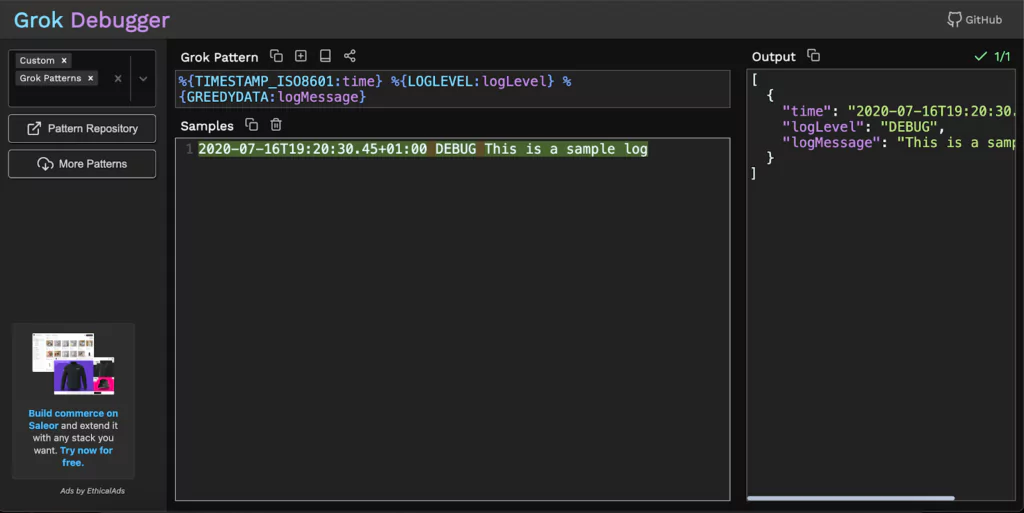
Naturally, we would also like to test these Grok filters and see if they work as intended, on our specific data. For this purpose, we can use the Grok Debugger tool.
With the Grok Debugger, we can copy and paste the Grok filter in the first “Grok Pattern” field and the example log line in the second “Samples” field.
The output would look like this:
Now that we’ve established some Grok fundamentals, let’s explore the concepts using various examples.
Hands-On Exercises
Parsing a Log File with Grok
Let’s apply this newly acquired knowledge and see how to use the Logstash Grok filter plugin on a sample log file.
First, let’s create a directory where we will store our sample data:
$ mkdir -p /home/student/03-grok-examples
Next, let’s create the file we will parse:
$ nano /home/student/03-grok-examples/sample.log
Now let’s copy and paste the following text into the nano editor:
2020-10-11T09:49:35Z INFO variable server value is tomcat
2020-03-14T22:50:34Z ERROR cannot find the requested resource
2020-01-02T14:58:40Z INFO initializing the bootup
2020-06-04T06:56:04Z DEBUG initializing checksum
2020-05-07T03:07:11Z INFO variable server value is tomcat
Finally, let’s press CTRL+X, then type Y and then press ENTER to save the file.
We can now create the Logstash configuration file:
Once again, we press CTRL+X, followed by Y and then ENTER to save the file.
We can see the configuration under the filter section is quite straightforward. We instruct Logstash to use the grok filter plugin and add match instructions where we used the same patterns and identifiers we explored earlier.
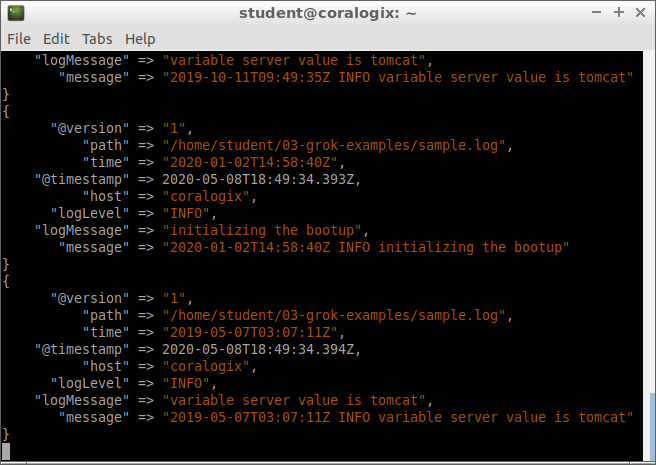
After a few seconds, the output shows that the entries have been parsed and imported. At that point, we can press CTRL+C to exit from Logstash.
Let’s explore the contents added to the index:
$ curl -XGET "https://localhost:9200/demo-grok/_search?pretty=true" -H 'Content-Type: application/json' -d'{
"_source": [
"logLevel",
"time",
"logMessage"
]
}'
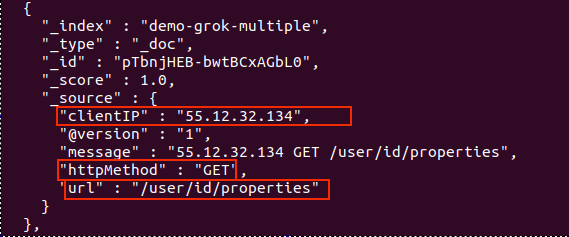
We’ll see our log entries neatly organized in the proper fields. Here’s an example of a document from the index:
In our scenario, things are optimal since each log line has precisely three components, in the same order and each matches every Grok pattern. But what if some text didn’t match any pattern we defined?
How Grok Deals with Lines that Don’t Match Patterns
Let’s edit our sample log:
$ nano /home/student/03-grok-examples/sample.log
and add the following line at the end:
55.12.32.134 GET /user/id/properties
Our sample log should now have six lines and look like this:
2020-10-11T09:49:35Z INFO variable server value is tomcat
2020-03-14T22:50:34Z ERROR cannot found the requested resource
2020-01-02T14:58:40Z INFO initializing the bootup
2020-06-04T06:56:04Z DEBUG initializing checksum
2020-05-07T03:07:11Z INFO variable server value is tomcat
55.12.32.134 GET /user/id/properties
Once again, we press CTRL+X, then Y and ENTER to save the file.
We don’t want to write over previous data we imported into our index, so let’s delete that first:
We can see that the document lacks the fields “time,” “logLevel,” and “logMessage.” The “message” field shows the line from our sample log that generated this document. We can see that this line doesn’t have any fields matching our Grok filter patterns. A tag called _grokparsefailure is added to signal that the parser had trouble with this line from the file.
We now saw what happens when Grok patterns can’t match anything on a line. Let’s explore the next scenario.
Multiple Grok Filters to Parse Complex Files
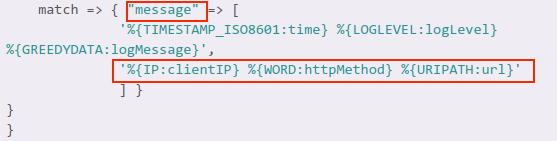
In our previous Logstash configuration, Grok tried to match our three patterns against each line in the sample log. But what if we want each line scanned for a second pair of patterns in case the first pair doesn’t match anything?
For example, in our case, if the line doesn’t have a timestamp, log level and log message, then Grok should try to search for another set of patterns. In this scenario, it will look for an IP address, an HTTP method and a URL.
We also see that these two sets of patterns are separated by a comma. So it’s pretty straightforward to add multiple pairs of patterns to a Grok filter.
But why would we do this? Well, this way, we can process complex logs where multiple programs log to the same file, as one example. Say Nginx and MySQL logged to the same file. One set of patterns can deal with log lines generated by Nginx, the other set can deal with lines generated by MySQL.
No more _grokparsefailure tags. Also, a new document corresponds to the new line we added to our sample log:
Nice! We got our log data neatly organized in Elasticsearch! We now have the freedom to parse almost any kind of text file, even if its information doesn’t follow a fixed pattern.
In the context of monitoring logging, multiline logs happen when a single log is written as multiple lines in the log file. This can either be caused by not using a standard logger to write with (e.g. print to console) or there’s a n (Newline) in the log to make it more readable (e.g. Java stack traces are error logs formatted as a list of stack frames)
When logs are sent to 3rd party full-stack observability platforms like Coralogix using standard shipping methods (e.g. Fluentd, Filebeat), which read log files line-by-line, every new line creates a new log entry, making these logs unreadable for the user. But, have no fear, there are many shipping methods that support pre-formatting multiline logs so that you are able to restructure, format, and combine the lines into single log messages.
Multiline Log Example
Here’s how a multiline log looks, using a Java stack trace log for this example:
09-24 16:09:07.042: ERROR System.out(4844): java.lang.NullPointerException
     at com.temp.ttscancel.MainActivity.onCreate(MainActivity.java:43)
     at android.app.Activity.performCreate(Activity.java:5248)
     at android.app.Instrumentation.callActivityOnCreate(Instrumentation.java:1110)
     at android.app.ActivityThread.performLaunchActivity(ActivityThread.java:2162)
     at android.app.ActivityThread.handleLaunchActivity(ActivityThread.java:2257)
     at android.app.ActivityThread.access$800(ActivityThread.java:139)
     at android.app.ActivityThread$H.handleMessage(ActivityThread.java:1210)
When sending this log using a log shipper, each line will be considered as an independent log message since log files are read line by line (assuming new entry when encountering n) unless a multiline pattern was set in your configuration file.
Configurations with Multiline
Multiline is a configuration option, which should be configured by the user. As mentioned before, most shipping methods support adding multiline pattern options. We will review a few of the most common file shipper configurations and see how to configure multiline to work with them.
Logstash
Being part of the Elastic ELK stack, Logstash is a data processing pipeline that dynamically ingests, transforms, and ships your data regardless of format or complexity. Here is an example of how to implement multiline with Logstash.
The negate can be true or false (defaults to false). If true, a message not matching the pattern will constitute a match of the multiline filter and the what will be applied.
The what can be previous or Next. If the pattern matched, does the event belong to the next or previous event?
For more information on multiline using Logstash visit here.
Filebeat
Also developed by Elastic, Filebeat is a lightweight shipper for forwarding and centralizing logs and files. You can either forward data to your local Logstash and from there to Coralogix, or. you ship directly to our Logstash endpoint.
Within the filebeat.inputs under type–>log use:
 multiline:
   pattern: '^[0-9]{1,3}.[0-9]{1,3}.[0-9]{1,3}.[0-9]{1,3}'
   negate: true
   match: after
The negate can be true or false (defaults to false). If true, a message not matching the pattern will constitute a match of the multiline filter and the what will be applied.
The match can be after or before. If the pattern matched, does the event belong to the next or previous event? (The after setting is equivalent to previous in Logstash, and before is equivalent to next)
For more info on working with multiline in Filebeat, visit here.
FluentD
Fluentd is a data collector which lets you unify the data collection and consumption for better use and understanding of data.
The format_firstline specifies the regexp pattern for the start line of multiple lines. Input plugin can skip the logs until format_firstline is matched.
The formatN, N’s range is 1..20, is the list of Regexp formats for the multiline log. For readability, you can separate Regexp patterns into multiple regexpN parameters. These patterns are joined and constructs regexp pattern with multiline mode.
Note that in my example, I used the format1 line to match all multiline log text into the message field. Then, I used Coralogix parsing rules to parse my logs into a JSON format. For more information on Coralogix parsing rules visit here.
Fluent Bit is a multi-platform Log Processor and Forwarder which allows you to collect data/logs from different sources, unify and send them to multiple destinations.
The Main config, use:
[SERVICE]
    Log_Level debug
    Parsers_File /path/to/parsers.conf
[INPUT]
    Name tail
    Path /var/log/fluent-bit/*.log
    Multiline On
    Parser_Firstline multiline_pattern
parsers.conf file:
[PARSER]
    Name multiline_pattern
    Format regex
    Regex ^[(?<timestamp>[0-9]{2,4}-[0-9]{1,2}-[0-9]{1,2} [0-9]{1,2}:[0-9]{1,2}:[0-9]{1,2})] (?<message>.*)
Note: In Fluent Bit, the multiline pattern is set in a designated file (parsers.conf) which may include other REGEX filters. At that point, it’s read by the main configuration in place of the multiline option as shown above. Secondly, in a Fluent Bit multiline pattern REGEX you have to use a named group REGEX in order for the multiline to work.
For more info on multiline in Fluent Bit visit here.
2017-03-29 10:00:00,123^%{TIMESTAMP_ISO8601} (In Logstash you can also use Grok patterns)
2017-03-29 Or Mar 22, 2020^(d{2,4}-d{2}-d{2,4}|[A-Za-z]{3} d{1,2}, d{4})
How to check for a multiline issue in Coralogix
It is recommended to look for multiline problems once integration was implemented so you can be sure your log collection works correctly. You can take a few steps in Coralogix to check whether you are dealing with a possible multiline issue:
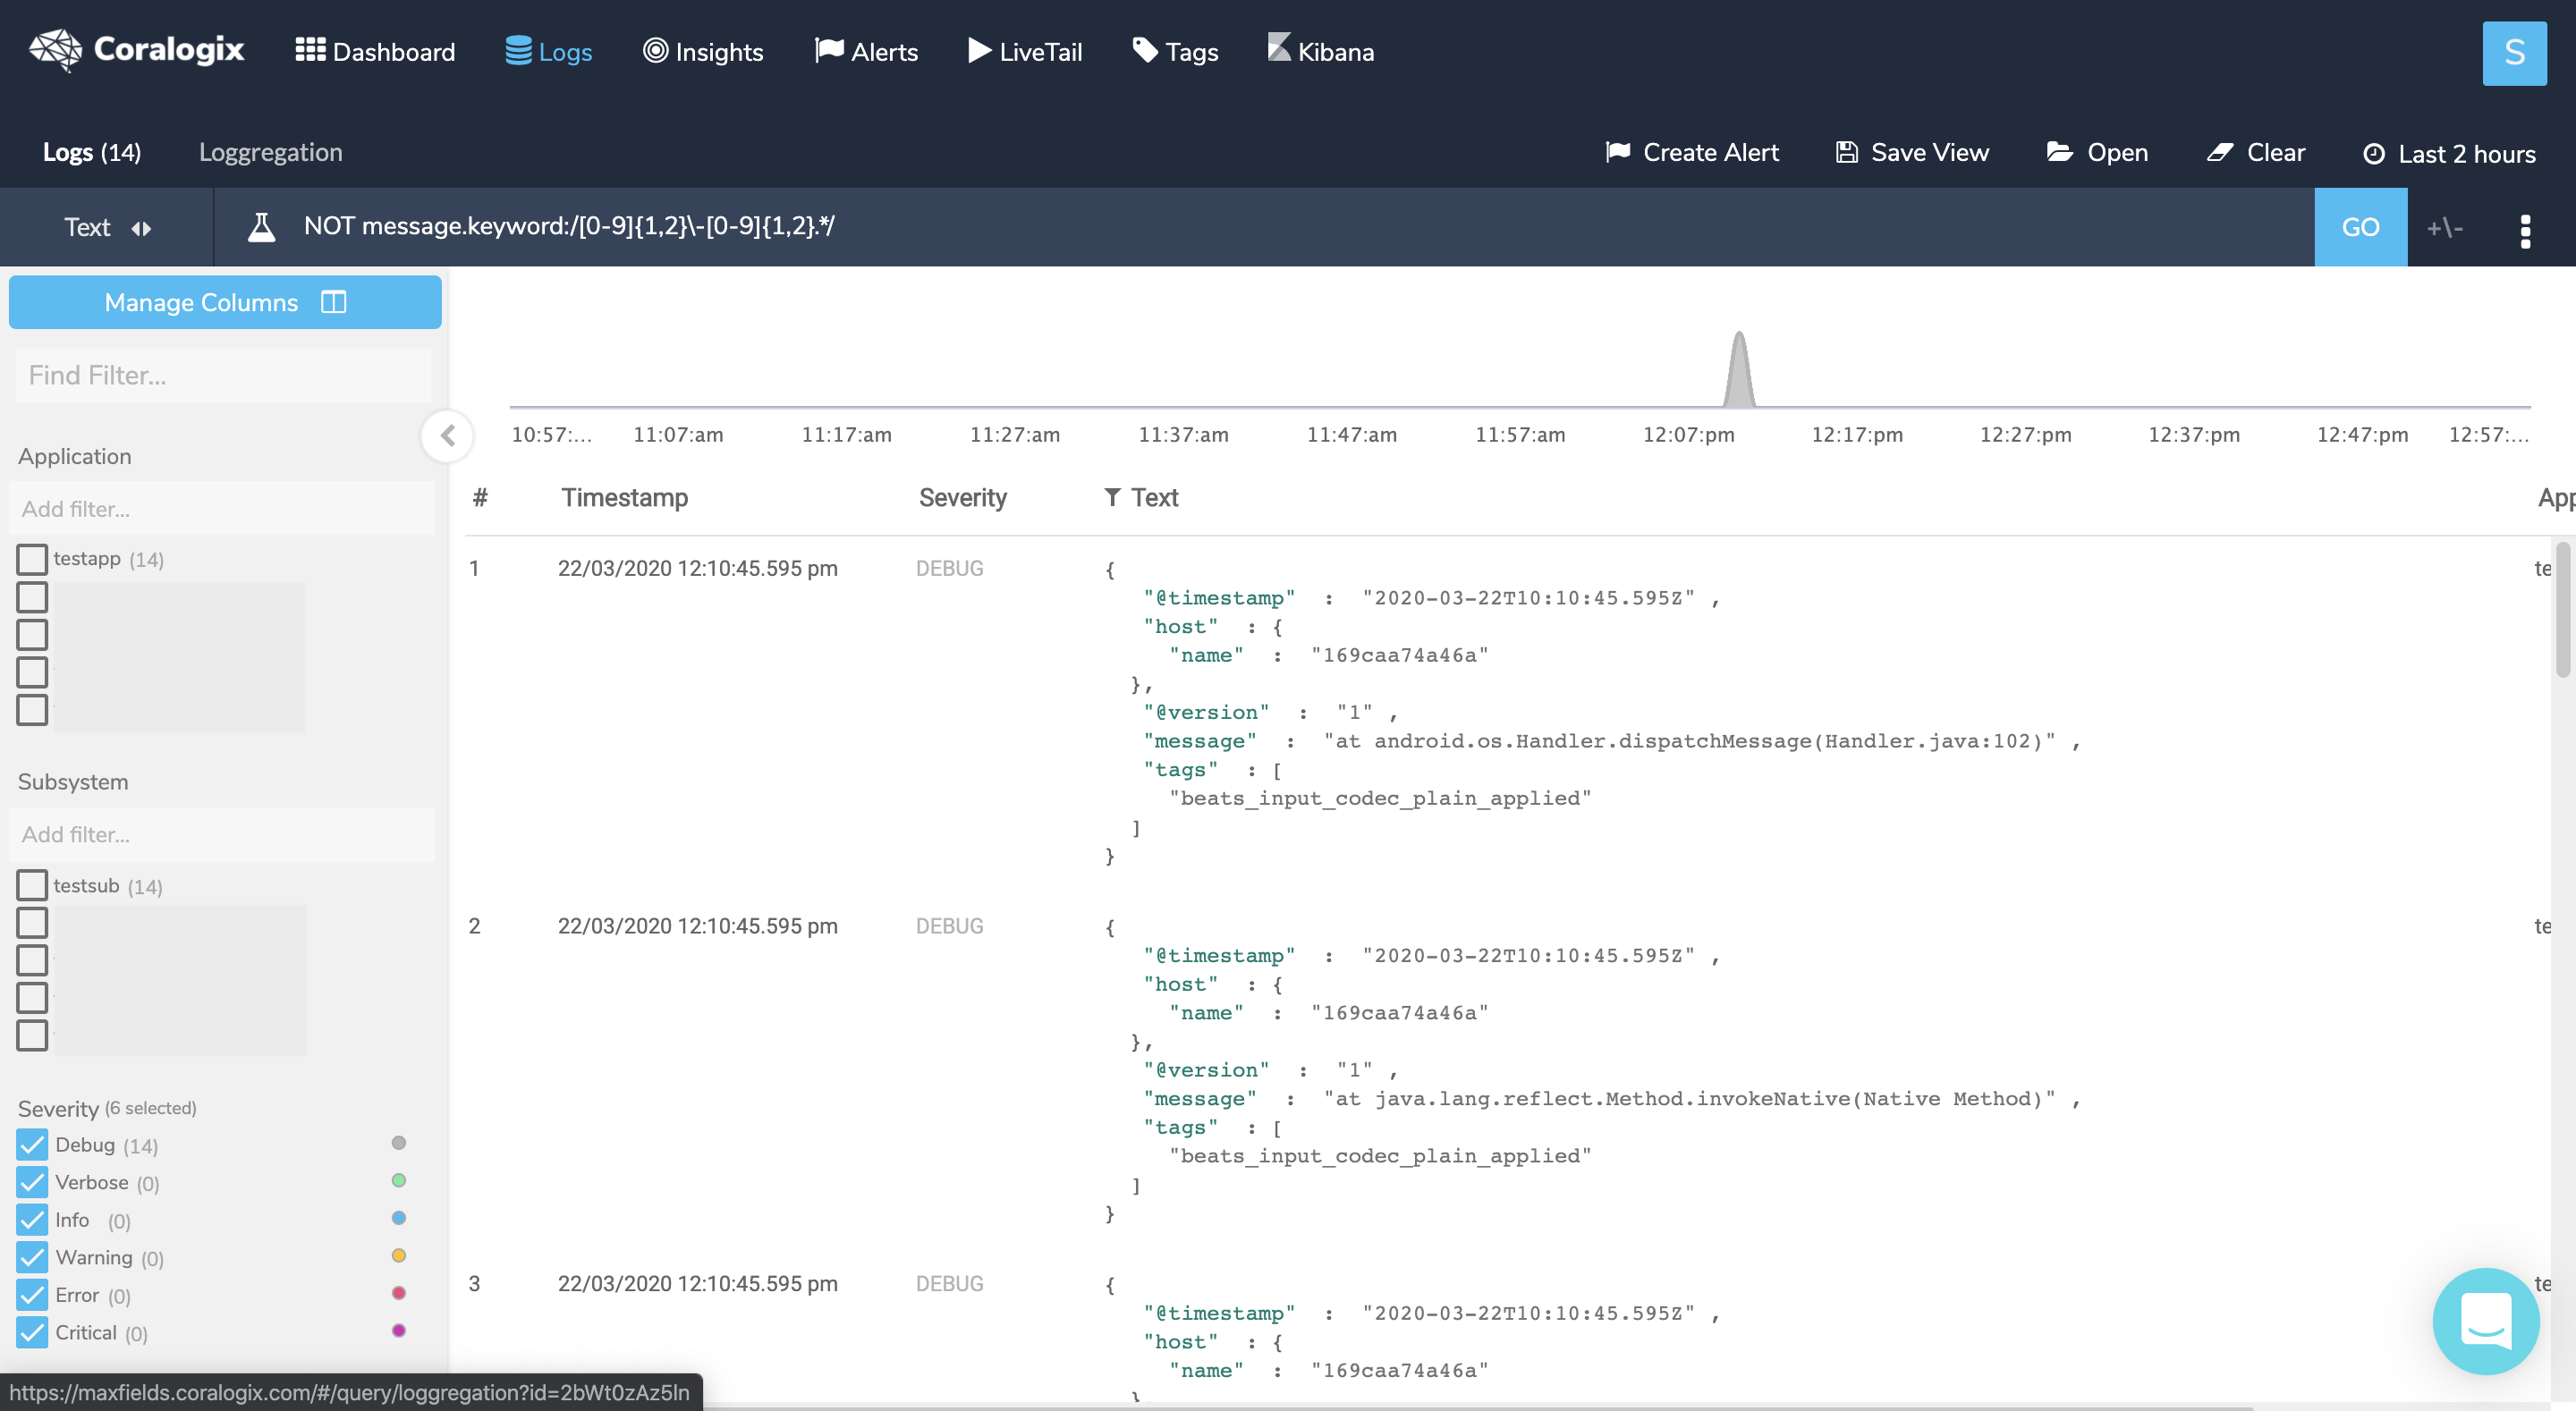
Given the above example of Java stack trace logs, when you know what is the beginning of a line you can create a NOT query on those logs to see if you have any logs that don’t start as expected, which might point to a multiline issue.
Query : NOT message.keyword:/[0-9]{1,2}-[0-9]{1,2}.*/
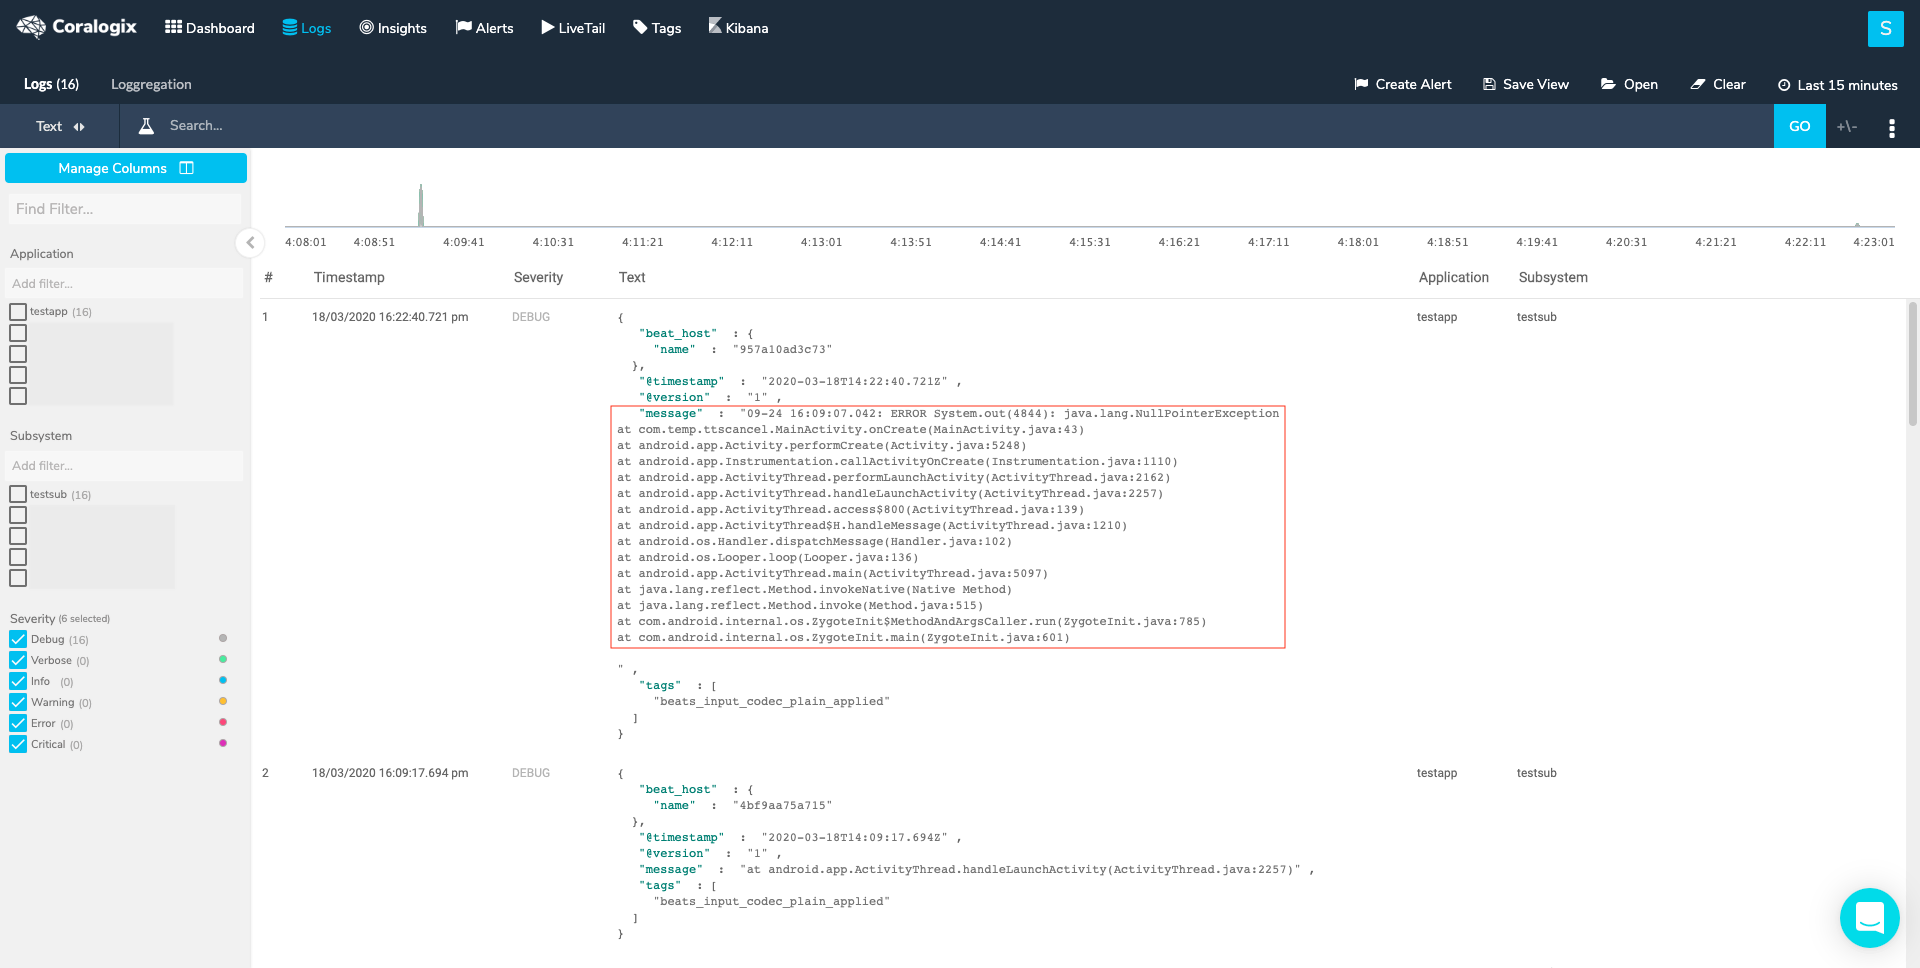
To verify that these logs are indeed part of another log entry click on one of them, then hover the +/- sign near the ‘GO’ button and choose a time interval (the min 5 seconds should suffice) and check whether you can find a log before the chosen log that represents its beginning. In our example, I would find the log that starts with the timestamp just right before the marked log. To solve this issue, set a new multiline pattern in your configuration and restart your service.
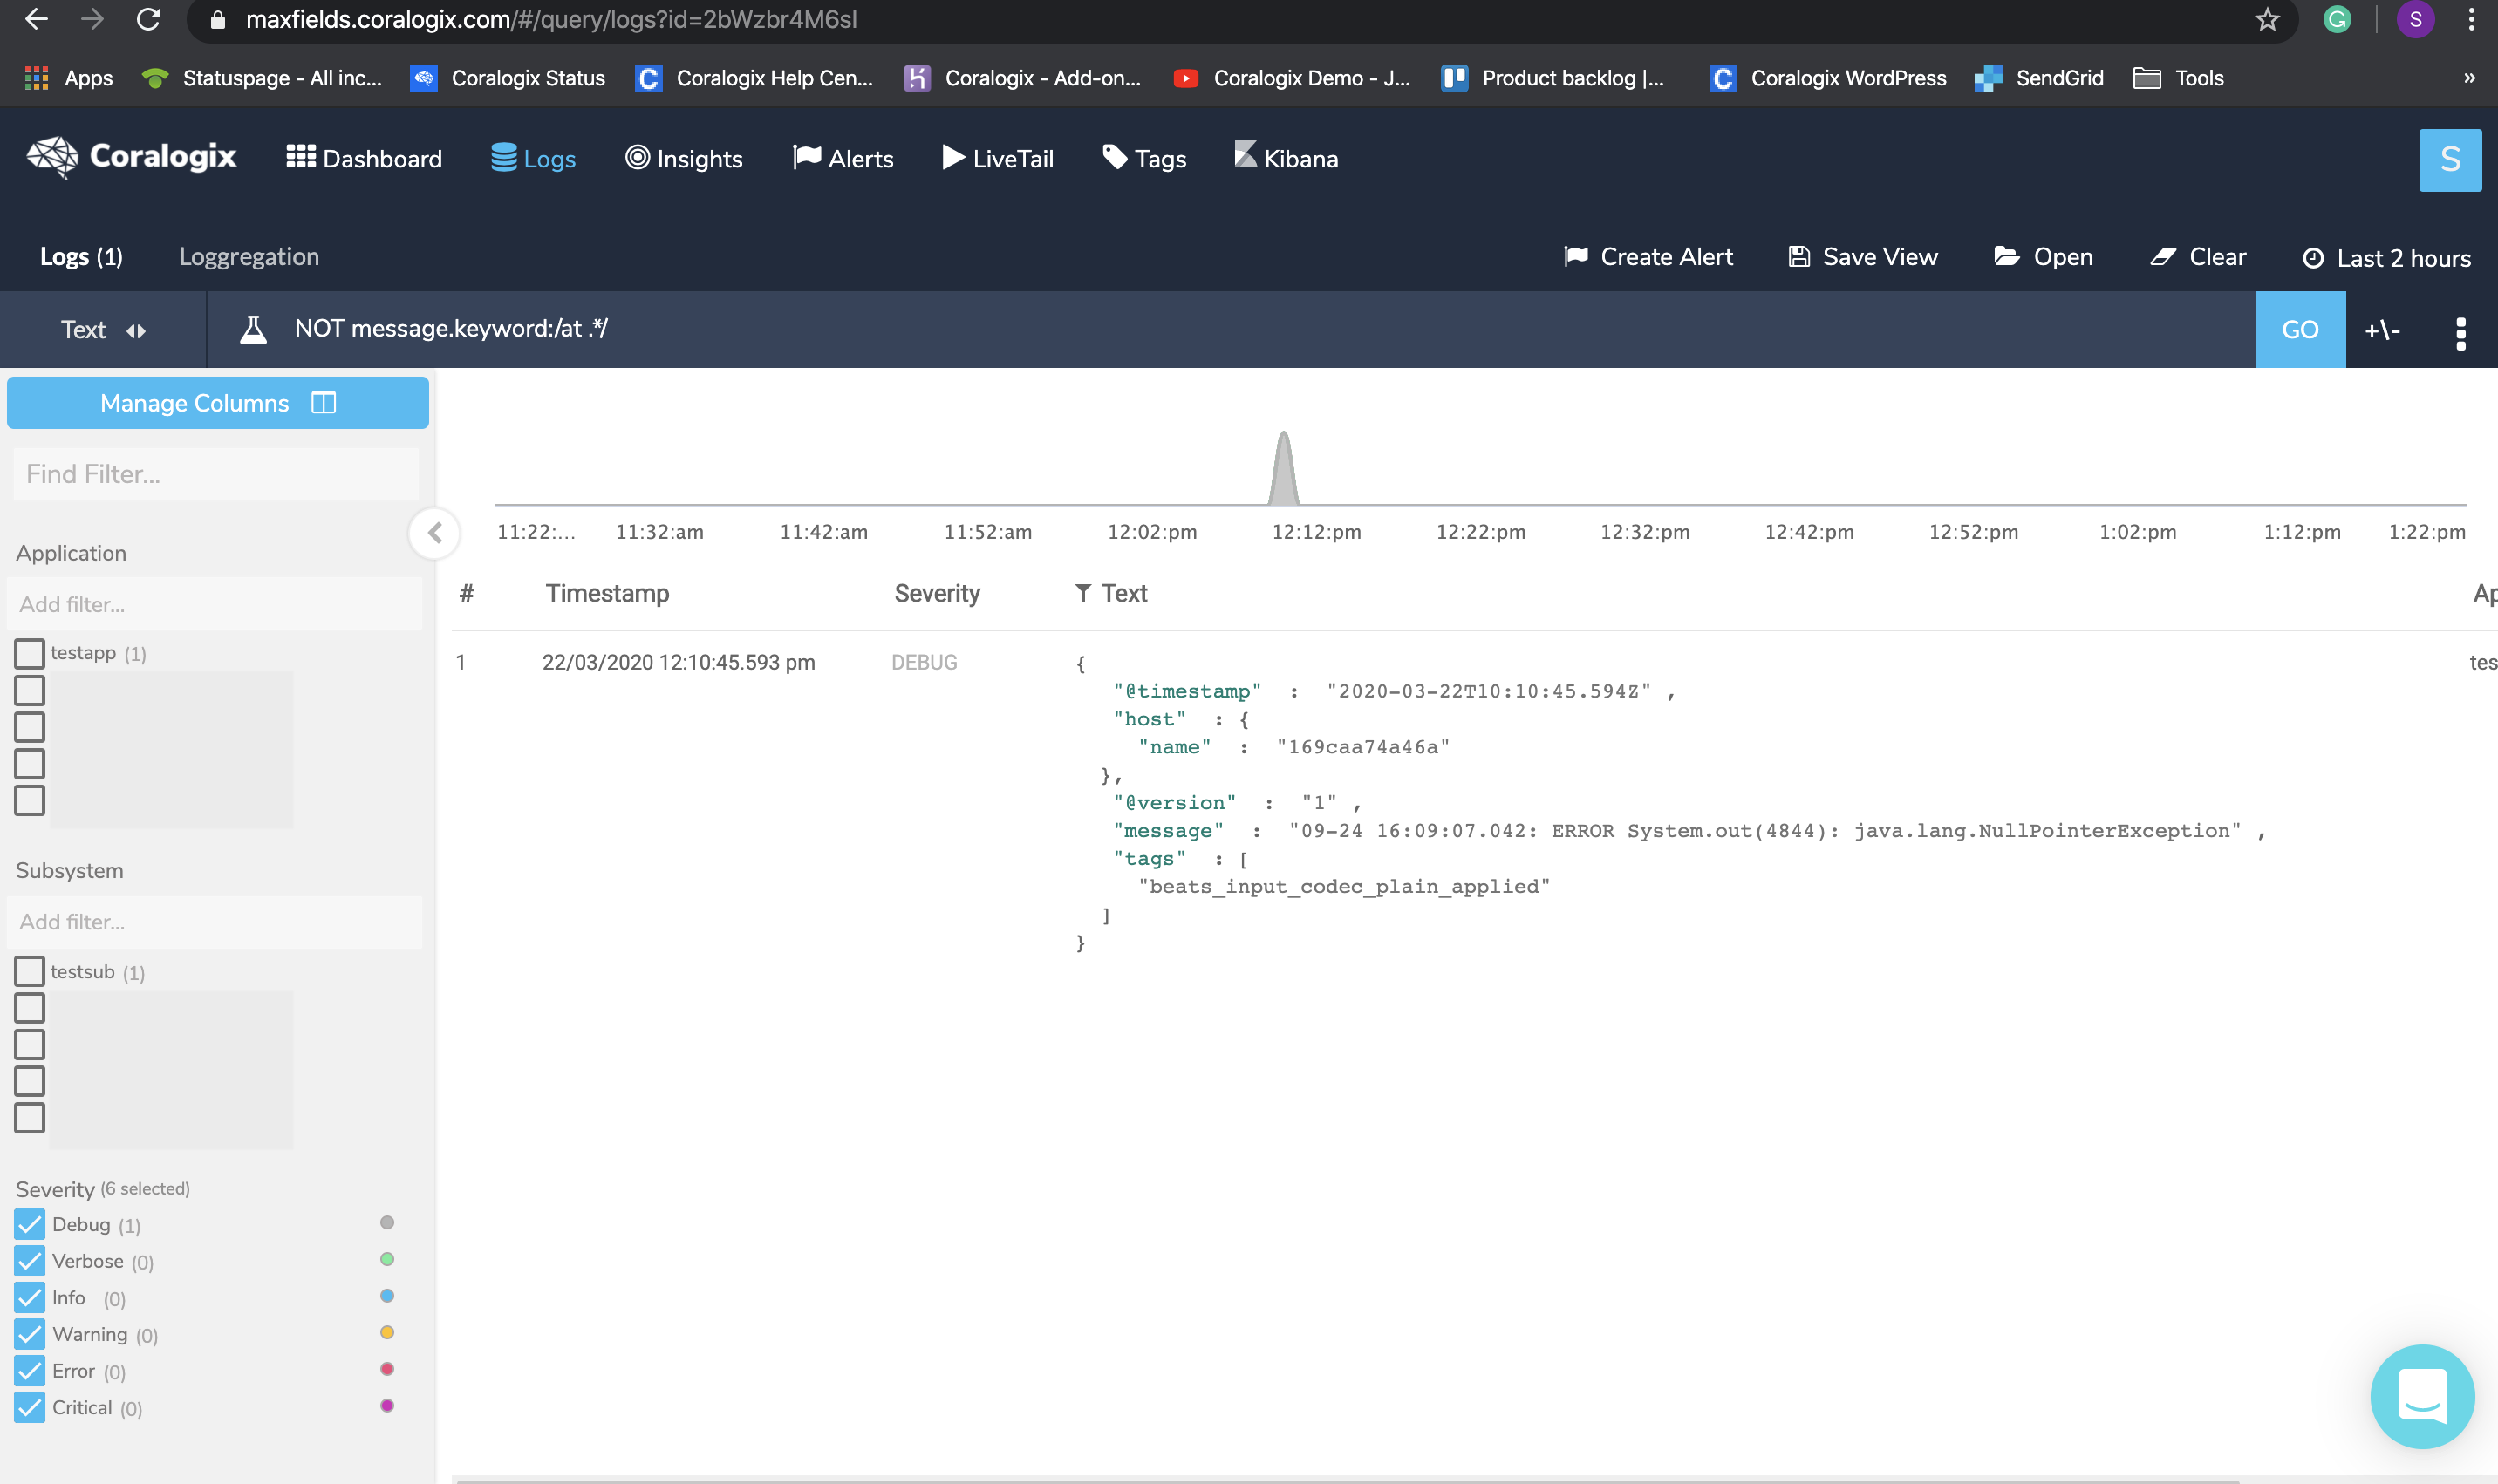
When you are not sure what is the beginning of a line but are encountering logs that don’t seem to represent a full log, you can create a NOT query on those logs to see what are their possible beginnings.
Query : NOT message.keyword:/at .*/
Click on the result, hover the +/- sign and check if you got any logs before or after the chosen log that might be a part of it. To solve this, set a new multiline pattern in your configuration and restart your service.
Use Loggregation to identify log templates that belong to multiline logs. Briefly, Loggregation is a Coralogix proprietary algorithm that condenses millions of log entries into a narrow set of patterns, allowing you to easily identify a case where the message field, within a template, doesn’t contain the full log message. After setting the right multiline in our configuration we should expect the full log entry to look like this:
Need help? check our website and in-app chat for quick advice from our product specialists.
Be Our Partner
Complete this form to speak with one of our partner managers.
Thank You
Someone from our team will reach out shortly. Talk to you soon!
 The new standard of observability is here. Discover Olly, the industry’s first


