June 2022 Platform Updates

Our team has been hard at work this month to introduce 2 new parsing rules, DataMap improvements, updated tracing visualizations for SLA monitoring & more.
Get up to speed on everything that’s new and improved in the Coralogix platform!
New Parsing Rules
This month we are introducing 2 new parsing rules to bring more value to customers who have many fields and nested fields in their log data.
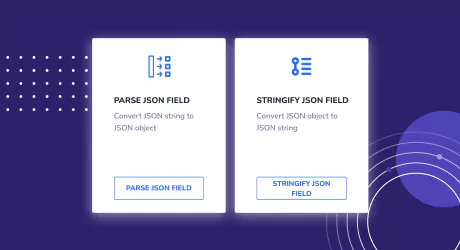
The new Stringify JSON Field and Parse JSON Field rules enable you to parse escaped JSON values within a field to a valid JSON object and vice versa – stringify a JSON object to an escaped string.
DataMap Updates
The DataMap allows you to build custom mappings of your infrastructure using metric data for monitoring system health and quickly identifying issues.
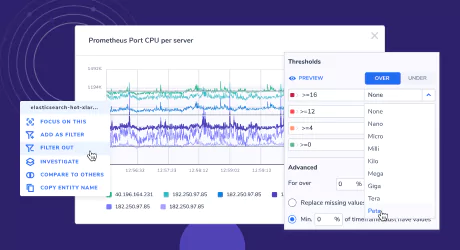
In the Group Editor, you’ll find new options to:
- Sort the display by attributes (e.g. sort by severity for defined thresholds)
- Scale threshold values to make metric graphs more readable
- Limit the number of hexagons shown per group
In the DataMap display, use new ‘Compare to others’ functionality to compare an element with 10 others in the same group. Plus, expand and collapse specific groups to minimize the number of displayed elements.
Tracing Updates
New dynamic graphs and saved views in the Tracing UI enable it to serve as SLA dashboards for any application or service.
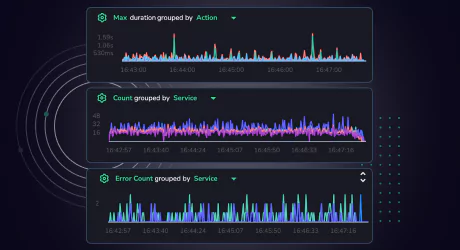
In addition to the original default graph for Max duration by Action, there are now two additional default graphs for Count by Service and Error Count by Service.
All three graphs can be customized, and aggregation operators have been added for 99, 95, and 50th percentiles to help deepen your ability to monitor business SLOs.
When investigating traces in the explore section, you can now save your current view and load saved views just like you do in the Logs UI.
*Note that the aggregation operators, as well as the Duration filter in the sidebar, are run over the Spans.
Archive Query Updates
Improvements to the archive query now allow timeframes up to 3 days for added accessibility to data in your remote bucket.
Additional updates to the Archive Query in Explore Screen include:
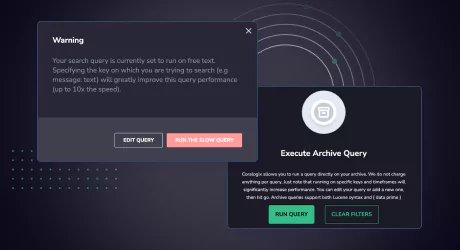
- New Execute Archive Query function allows you to review active filters before clicking ‘Run Query’. To prevent unexpected wait times, queries will no longer run automatically when switching from Logs to Archive.
- Non-optimal archive queries (e.g. “hello”) will trigger a warning pop up recommending to improve the query conditions.
New Integrations
Amazon Kinesis Data Firehose
Stream large volumes of logs and metrics to Coralogix and reduce operational overhead using our integration with Amazon Kinesis Data Firehose.
Terraform Modules
Easily install and manage Coralogix integrations using Terraform modules in your infrastructure code.
Google Cloud Pub/Sub
Use our predefined function to forward your logs from Google Cloud’s Pub/Sub straight to Coralogix.
GitHub Version Tags
Use the cURL command in GitHub Actions to insert a new tag when a release is published or when a pull request is closed.
Coralogix RabbitMQ Agent
Pull metrics from RabbitMQ Admin UI and send them to your Coralogix account using our AWS Lambda function.
Salesforce Cloud Commerce
Ingest security logs from Salesforce for admin and compliance monitoring.