Why Are SaaS Observability Tools So Far Behind?

Salesforce was the first of many SaaS-based companies to succeed and see massive growth. Since they first started out in 1999, Software-as-a-Service (SaaS) tools have taken the IT sector and, well the world, by storm. For one, they mitigate bloatware by moving applications from the client’s computer to the cloud. Plus, the sheer ease of use brought by cloud-based, plug-and-play software solutions has transformed all sorts of sectors. 

Given the SaaS paradigm’s success in everything from analytics to software development itself, it’s natural to ask whether its Midas touch could improve the current state of data observability tools.

Heroku and the Rise of SaaS

Let’s start with a system that we’ve previously talked about, Heroku. Heroku is one of the most popular platforms for deploying cloud-based apps. 

Using a Platform-as-a-Service approach, Heroku lets developers deploy apps in managed containers with maximum flexibility. Instead of apps being hosted in traditional servers, Heroku provides something called dynos.

Dynos are like cradles for applications. They utilize the power of containerization to provide a flexible architecture that takes the hassle of on-premises configuration away from the developer. (We’ve previously talked about the merits of SaaS vs Hosted solutions.)

Heroku’s dynos make scalability effortless. If developers want to scale their app horizontally, they can simply add more dynos. Vertical scaling can be achieved by upgrading dyno types, a process Heroku facilitates through its intuitive dashboard and CLI.

Heroku can even take scaling issues off the developer’s hands completely with its auto-scaling feature. This means that software companies can focus on their mission, providing high-quality software at scale without worrying about the ‘how’ of scalability or configuration.

Systems like Heroku give us a tantalizing glimpse of the power and convenience a SaaS approach can bring to DevOps. The hassle of resource management, configuration, and deployment are abstracted away, allowing developers to focus solely on coding.

SaaS is making steady inroads into DevOps. For example, Coralogix (which integrates with Heroku and is also available as a Heroku add-on), operates with a SaaS approach, allowing users to analyze logs without worrying about configuration details.

Not So SaaS-y Tooling

It might seem that nothing is stopping SaaS from being applied to all aspects of observability tooling. After all, Coralogix already offers a SaaS log analytics solution, so why not just make all logging as SaaS-y as possible?

Log collection is the fly in this particular ointment.  Logging data is often stored in a variety of formats, reflecting the fact that logs may originate from very different systems.  For example, a Linux server will probably store logs as text data while Kubernetes can use a structured logging format or store the logs as JSON.

Because every system has its own logging format, organizations tend to collect their logs on-premises is a big roadblock to the smooth uptake of SaaS. In reality, the variety of systems, in addition to the option to build your own system, is symptomatic of a slower move toward observability in the enterprise. However, this range of options doesn’t mean that log analysis is limited to on-prem systems.

What’s important to note is that organizations are really missing out on SaaS observability tooling. Why is this the case, when SaaS tools and platforms are so widespread? The perceived complexity of varying formats, combined with potential cloud-centric security concerns, might have a role to play.

Moving to Cloud-Based Log Storage with S3 Bucket

To pave the way to Software as a Service log collection, we need to stop storing logs on-prem and move them to the cloud.  Cloud computing is the keystone of SaaS. Applications can be hosted on centralized computing resources and piped to thousands of clients.

AWS lets you store logs in the cloud with S3 Bucket.  S3 is short for Simple Storage Service. As the name implies, S3 Bucket is a service provided by AWS that is specifically designed to let you store and access data quickly and easily.

Pushing Logs to S3 with Logstash and FluentD

For those who aren’t already using AWS, output plugins allow users to push existing log records to S3.  Two of the most popular logging solutions are FluentD and Logstash, so we’ll look at those here. (Coralogix integrates with both FluentD and Logstash)

FluentD Plugin

FluentD contains a plugin called out_s3. This enables users to write pre-existing log records to the S3 Bucket.  Out_s3 has several cool features.

For one, it splits files using the time event logs were created. This means the S3 file structure accurately reflects the original time ordering of log records and not just when they were uploaded to the bucket.

Another thing out_s3 allows users to do is incorporate metadata into the log records.  This means each log record contains the name of its S3 Bucket along with the object key. Downstream systems like Coralogix can then use this info to pinpoint where each log record came from.

At this point, I should mention something that could catch new users out. FluentD’s plugin automatically creates files on an hourly basis. This can mean that when you first upload log records, a new file isn’t created immediately, as it would be with most systems.

While you can’t rely on new files being created immediately, you can change whether they are created more or less frequently by configuring the time key condition.

Logstash Plugin

Logstash’s output plugin is open source and comes under an Apache 2.0 license, meaning there are no restrictions on how you use it. It uploads batches of Logstash events in the form of temporary files, which by default are stored in the Operating System’s temporary directory.

If you don’t like the default save location, Logstash gives you a temporary_directory option that lets you stipulate a preferred save location.

Securing Your Logs

Logs contain sensitive information. A crucial question for those taking the S3 log storage route is making sure S3 Buckets are secure.  Amazon S3 default encryption enables users to ensure that new log file objects are encrypted by default.

If you’ve already got some logs in an S3 Bucket and they aren’t yet encrypted don’t worry. S3 has a couple of tools that let you encrypt existing objects quickly and easily.

Encryption through Batch Operations

One tool is S3 Batch Operations. Batch Operations are S3’s mechanism for performing operations on billions of objects at a time. Simply provide S3 Batch Operations with a list of the log files you want to encrypt and the API performing the appropriate operation.

Encryption can be achieved by using the copy operation to copy unencrypted files to encrypted files in the same S3 Bucket location.

Encryption through Copy Object API

An alternative tool is the Copy Object API. This tool works by copying a single object back to itself using SSE encryption and can be run using the AWS CLI.

Although Copy Object is a powerful tool, it’s not without risks. You’re effectively replacing your existing log files with encrypted versions so make sure all the requisite information and metadata is preserved by the encryption. 

For example, if you are copying log files larger than the multipart_threshold value, the Copy Object API won’t copy the metadata by default.  In this case, you need to specify what metadata you want using the parameter –metadata.

Integrating S3 Buckets with Coralogix

Hooray! Your logs are now firmly in the cloud with S3. Now, all you need to do is analyze them.  Coralogix can help you do this with the S3 to Coralogix Lambda.

This is an API that lets you send log data from your S3 Bucket to Coralogix, where the full power of machine learning can be applied to uncover insights.  To use it you need to define five parameters.

S3BucketName specifies the name of the S3 bucket storing the CloudTrail logs.

ApplicationName is a mandatory metadata field that is sent with each log and helps to classify it.

CoralogixRegion is the region in which your Coralogix account is located. CoralogixRegion can be Europe, US or India, depending on whether your Coralogix URL ends with .com, .us or .in.

PrivateKey is a parameter that can be found in your Coralogix account under Settings -> Send your logs. It is located in the upper left corner.

SubsystemName is a mandatory metadata field that is sent with each log and helps to classify it.

The S3 to Coralogix Lambda can be integrated with AWS’s automation framework through the Serverless Application Model. SAM is an AWS framework that provides resources for creating serverless applications, such as shorthand syntax for APIs and functions.

The code for the Lambda is also available at the S3 to Coralogix Lambda GitHub. As with Logstash, it’s open source under the Apache 2.0 License so there are no restrictions on how you use it.

To Conclude

Software as a Service is a paradigm that is transforming every part of the IT sector, including DevOps. It replaces difficult-to-configure on-premises architecture with uniform and consistent services that remove scalability from the list of an end user’s concerns.

Unfortunately, SaaS observability tooling is still falling behind the curve, but largely because organizations are still maintaining a plethora of systems (and therefore a variety of formats) on-prem. 

Storing your logs in S3 lets you bring the power and convenience of SaaS to log collection. Once your logs are in S3, you can leverage Coralogix’s machine learning analytics to extract insights and predict trends.

How Cloudflare Logs Provide Traffic, Performance, and Security Insights with Coralogix

Cloudflare secures and ensures the reliability of your external-facing resources such as websites, APIs, and applications. It protects your internal resources such as behind-the-firewall applications, teams, and devices. This post will show you how Coralogix can provide analytics and insights for your Cloudflare log data – including traffic, performance, and security insights.

To get all Cloudflare dashboards and alerts, follow the steps described below or contact our support on our website/in-app chat. We reply in under 2 minutes!

Cloudflare Logs

Cloudflare provides detailed logs of your HTTP requests. Use these logs to debug or to identify configuration adjustments that can improve performance and security.  You can leverage your rich Cloudflare log data through Coralogix’s User-defined Alerts and Data Dashboards to instantly discover trends and patterns within any given metric of your application-clients ecosystem, spot potential security threats, and get a real-time notification on any event that you might want to observe. Eventually, getting better Cloudflare monitoring experience and capabilities from your data, with minimum effort.

To start shipping your Cloudflare logs to Coralogix, follow this simple tutorial.

Cloudflare Dashboards

Once you’ve started shipping your Cloudflare logs to Coralogix, you can immediately extract insights and set up dashboards to visualize your data.

All Cloudflare logs are JSON logs. Based on a field or many fields, you may define your visualization(s) and gather them in a dashboard(s). The options are practically limitless and you may create any visualization you can think of as long as your logs contain that data you want to visualize. For more information, visit our Kibana tutorial.

There are nine out-of-the-box dashboards that are ready to use. You may import them with the following steps:

  1. Download the cloudflare_export.ndjson.zip file and save it locally.
  2. Unzip the file.
  3. Open cloudflare_export.ndjson with a text editor and replace all occurrences of *:index_pattern_newlogs* with your default pattern, for example: *:1111_newlogs*. By default, the index_pattern will be your company ID.
  4. Save the file.
  5. Login to Coralogix and click the Kibana button.
  6. Choose Management -> Saved Objects
  7. Click the Import button.
  8. Click the Import text in the section below Please select a file to import.
  9. Choose the cloudflare_export.ndjson file.
  10. Click the Import button at the bottom.

Notes:

  1. Some visualization may not be available if you didn’t specify them during Cloudflare Push Log Service configuration.
  2. If you want to be able to use visualizations where the country name field is used then you need to enable Geo Enrichment on the ClientIP key. Click here for more information or ping us on the chat to enable it for you
  3. If your application name is other than Cloudflare then you need to adjust the saved search filter “Saved Search – Cloudflare”.

Cloudflare – Snapshot

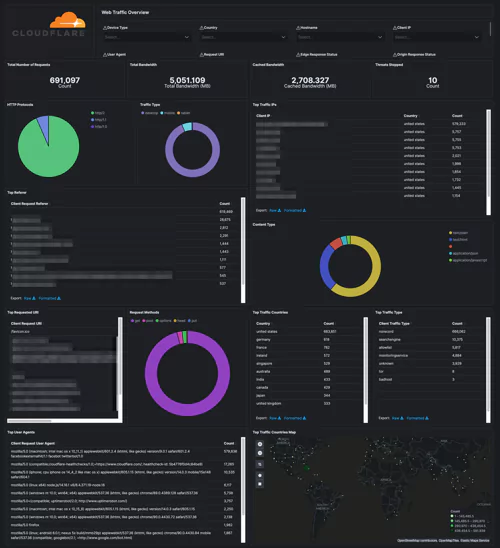
This is the main dashboard where you can take a look at your traffic. There are statistics about the total number of requests, bandwidth, cached bandwidth, threats, HTTP protocols, traffic types, and much more general information.

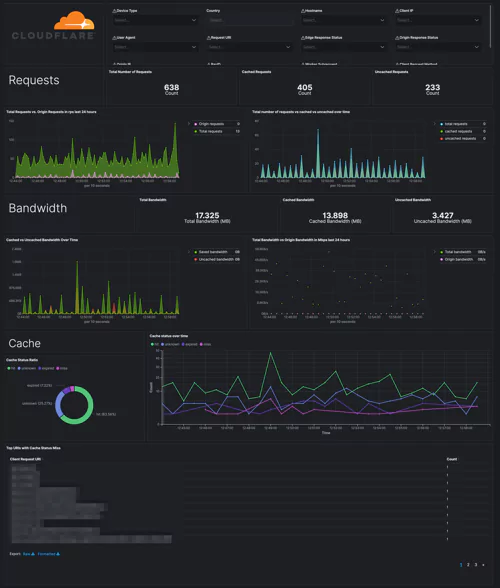
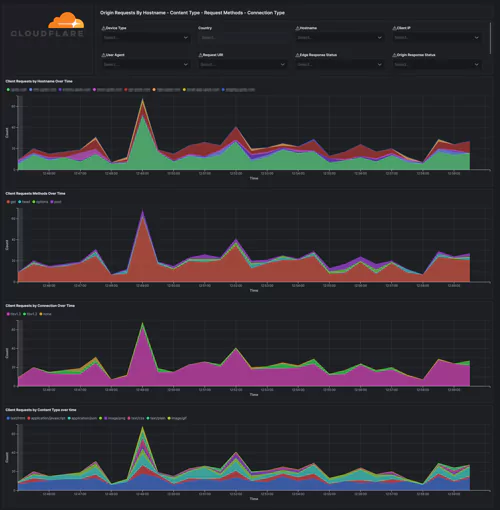
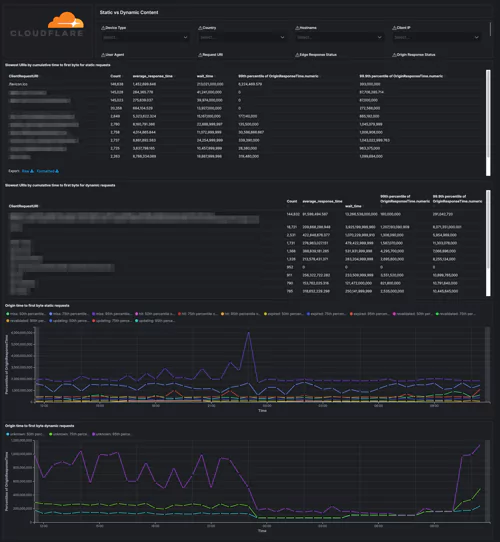
Cloudflare – Performance (Requests, Bandwidth, Cache), Cloudflare – Performance (Hostname, Content Type, Request Methods, Connection Type), Cloudflare – Performance (Static vs. Dynamic Content)

Monitor the performance – get details on the traffic. Identify and address performance issues and caching misconfigurations. Get your most popular hostnames, most requested content types, request methods, connection type, and your static and dynamic content, including the slowest URLs.

cloudflare performance dashboard cloudflare performance dashboard cloudflare performance dashboard

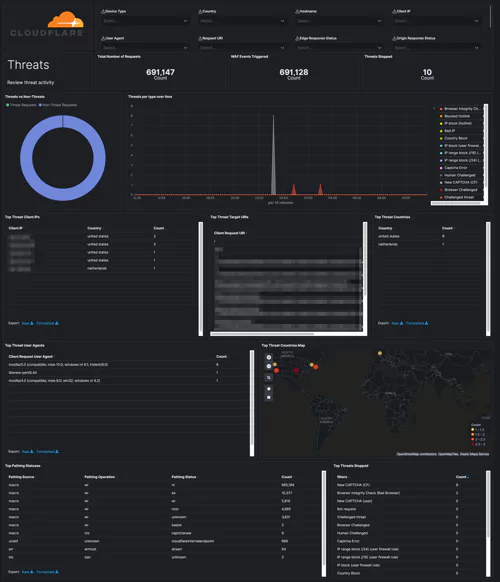
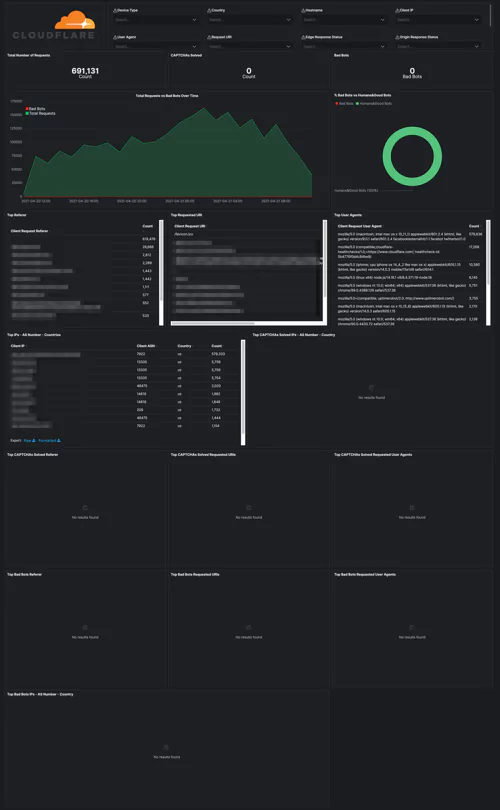
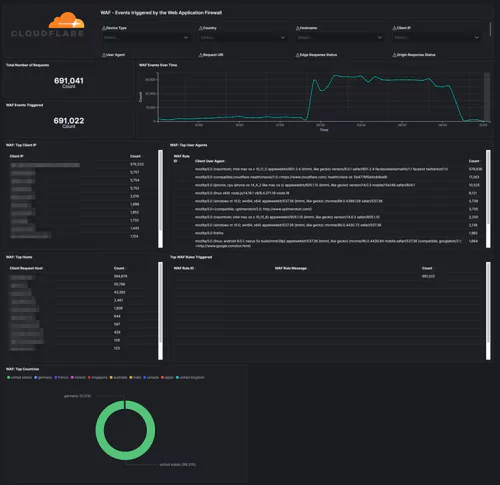
Cloudflare – Security (Overview), Cloudflare – Security (WAF), Cloudflare – Security (Rate Limiting), Cloudflare – Security (Bot Management)

Security dashboards let you track threats to your website/applications over time and per type/country. Web Application Firewall events will help you tune the firewall and prevent false positives. Rate Limiting protects against denial-of-service attacks, brute-force login attempts, and other types of abusive behavior targeting the application layer.

cloudflare security dashboardcloudflare security dashboard cloudflare security dashboard

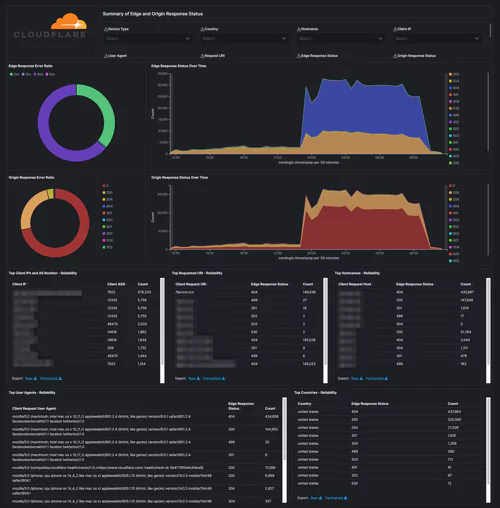
Cloudflare – Reliability

Get insights into the availability of your websites and applications. Metrics include origin response error ratio, origin response status over time, percentage of 3xx/4xx/5xx errors over time, and more.

cloudflare reliability dashboard

Alerts

The user-defined alerts in Coralogix enable you to obtain real-time insights based on the criteria of your own choosing. Well-defined alerts will allow you and your team to be notified about changes in your website/applications. Here are some examples of alerts we created using Cloudflare HTTP Requests data.

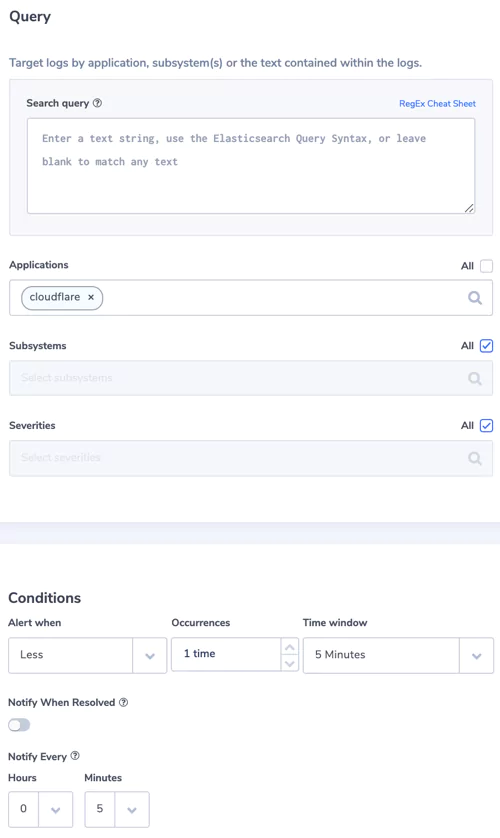
1. No logs from Cloudflare

When Cloudflare stops sending logs for some reason, it is important for us to be notified.

Alert Filter: set a filter on the application name that represents your Cloudflare logs. In my case, we named it cloudflare.

Alert Condition: less than 1 time in 5 minutes

no cloudflare logs alerts

2. Bad Bots

Be notified about a high volume of bot requests

Alert Filter:
– Search Query: EdgePathingSrc.keyword:”filterBasedFirewall” AND EdgePathingStatus.keyword:”captchaNew”
– Applications: cloudflare

Alert Condition: more than 3 times in 5 minutes

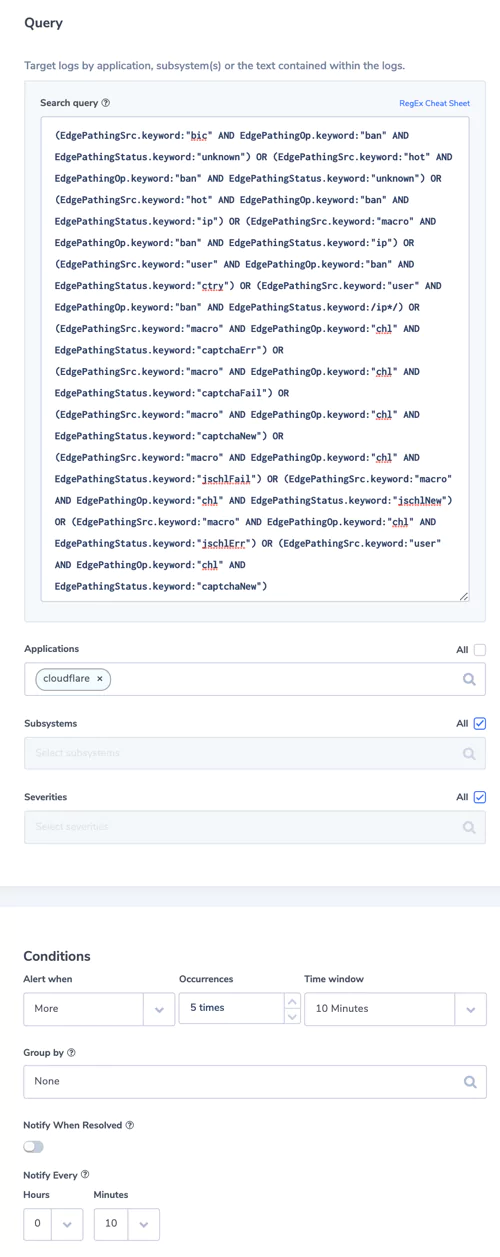
3. Threats Stopped

Be notified about the threats which were stopped.

Alert Filter:
– Search Query: (EdgePathingSrc.keyword:”bic” AND EdgePathingOp.keyword:”ban” AND EdgePathingStatus.keyword:”unknown”) OR (EdgePathingSrc.keyword:”hot” AND EdgePathingOp.keyword:”ban” AND EdgePathingStatus.keyword:”unknown”) OR (EdgePathingSrc.keyword:”hot” AND EdgePathingOp.keyword:”ban” AND EdgePathingStatus.keyword:”ip”) OR (EdgePathingSrc.keyword:”macro” AND EdgePathingOp.keyword:”ban” AND EdgePathingStatus.keyword:”ip”) OR (EdgePathingSrc.keyword:”user” AND EdgePathingOp.keyword:”ban” AND EdgePathingStatus.keyword:”ctry”) OR (EdgePathingSrc.keyword:”user” AND EdgePathingOp.keyword:”ban” AND EdgePathingStatus.keyword:/ip*/) OR (EdgePathingSrc.keyword:”macro” AND EdgePathingOp.keyword:”chl” AND EdgePathingStatus.keyword:”captchaErr”) OR (EdgePathingSrc.keyword:”macro” AND EdgePathingOp.keyword:”chl” AND EdgePathingStatus.keyword:”captchaFail”) OR (EdgePathingSrc.keyword:”macro” AND EdgePathingOp.keyword:”chl” AND EdgePathingStatus.keyword:”captchaNew”) OR (EdgePathingSrc.keyword:”macro” AND EdgePathingOp.keyword:”chl” AND EdgePathingStatus.keyword:”jschlFail”) OR (EdgePathingSrc.keyword:”macro” AND EdgePathingOp.keyword:”chl” AND EdgePathingStatus.keyword:”jschlNew”) OR (EdgePathingSrc.keyword:”macro” AND EdgePathingOp.keyword:”chl” AND EdgePathingStatus.keyword:”jschlErr”) OR (EdgePathingSrc.keyword:”user” AND EdgePathingOp.keyword:”chl” AND EdgePathingStatus.keyword:”captchaNew”)
– Applications: cloudflare

Alert Condition: more than 5 times in 10 minutes

cloudflare threats stopped alert

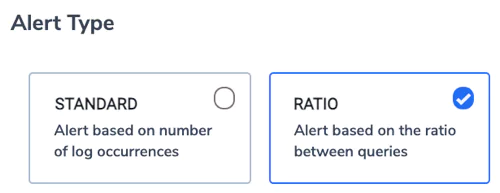
4. Threats vs Non-Threats ratio

Be notified if there are more than 10% of threats comparing to non-threats requests

Alert type: Ratio

Alert Filter:
– Search Query 1: (EdgePathingSrc.keyword:”bic” AND EdgePathingOp.keyword:”ban” AND EdgePathingStatus.keyword:”unknown”) OR (EdgePathingSrc.keyword:”hot” AND EdgePathingOp.keyword:”ban” AND EdgePathingStatus.keyword:”unknown”) OR (EdgePathingSrc.keyword:”hot” AND EdgePathingOp.keyword:”ban” AND EdgePathingStatus.keyword:”ip”) OR (EdgePathingSrc.keyword:”macro” AND EdgePathingOp.keyword:”ban” AND EdgePathingStatus.keyword:”ip”) OR (EdgePathingSrc.keyword:”user” AND EdgePathingOp.keyword:”ban” AND EdgePathingStatus.keyword:”ctry”) OR (EdgePathingSrc.keyword:”user” AND EdgePathingOp.keyword:”ban” AND EdgePathingStatus.keyword:/ip*/) OR (EdgePathingSrc.keyword:”macro” AND EdgePathingOp.keyword:”chl” AND EdgePathingStatus.keyword:”captchaErr”) OR (EdgePathingSrc.keyword:”macro” AND EdgePathingOp.keyword:”chl” AND EdgePathingStatus.keyword:”captchaFail”) OR (EdgePathingSrc.keyword:”macro” AND EdgePathingOp.keyword:”chl” AND EdgePathingStatus.keyword:”captchaNew”) OR (EdgePathingSrc.keyword:”macro” AND EdgePathingOp.keyword:”chl” AND EdgePathingStatus.keyword:”jschlFail”) OR (EdgePathingSrc.keyword:”macro” AND EdgePathingOp.keyword:”chl” AND EdgePathingStatus.keyword:”jschlNew”) OR (EdgePathingSrc.keyword:”macro” AND EdgePathingOp.keyword:”chl” AND EdgePathingStatus.keyword:”jschlErr”) OR (EdgePathingSrc.keyword:”user” AND EdgePathingOp.keyword:”chl” AND EdgePathingStatus.keyword:”captchaNew”)

-Search Query 2: NOT ((EdgePathingSrc.keyword:”bic” AND EdgePathingOp.keyword:”ban” AND EdgePathingStatus.keyword:”unknown”) OR (EdgePathingSrc.keyword:”hot” AND EdgePathingOp.keyword:”ban” AND EdgePathingStatus.keyword:”unknown”) OR (EdgePathingSrc.keyword:”hot” AND EdgePathingOp.keyword:”ban” AND EdgePathingStatus.keyword:”ip”) OR (EdgePathingSrc.keyword:”macro” AND EdgePathingOp.keyword:”ban” AND EdgePathingStatus.keyword:”ip”) OR (EdgePathingSrc.keyword:”user” AND EdgePathingOp.keyword:”ban” AND EdgePathingStatus.keyword:”ctry”) OR (EdgePathingSrc.keyword:”user” AND EdgePathingOp.keyword:”ban” AND EdgePathingStatus.keyword:/ip*/) OR (EdgePathingSrc.keyword:”macro” AND EdgePathingOp.keyword:”chl” AND EdgePathingStatus.keyword:”captchaErr”) OR (EdgePathingSrc.keyword:”macro” AND EdgePathingOp.keyword:”chl” AND EdgePathingStatus.keyword:”captchaFail”) OR (EdgePathingSrc.keyword:”macro” AND EdgePathingOp.keyword:”chl” AND EdgePathingStatus.keyword:”captchaNew”) OR (EdgePathingSrc.keyword:”macro” AND EdgePathingOp.keyword:”chl” AND EdgePathingStatus.keyword:”jschlFail”) OR (EdgePathingSrc.keyword:”macro” AND EdgePathingOp.keyword:”chl” AND EdgePathingStatus.keyword:”jschlNew”) OR (EdgePathingSrc.keyword:”macro” AND EdgePathingOp.keyword:”chl” AND EdgePathingStatus.keyword:”jschlErr”) OR (EdgePathingSrc.keyword:”user” AND EdgePathingOp.keyword:”chl” AND EdgePathingStatus.keyword:”captchaNew”))

– Applications: cloudflare

Alert Condition: Alert if Query 1 / Query 2 equals more than 0.1 in 10 minutes

ratio alert type

alert type query

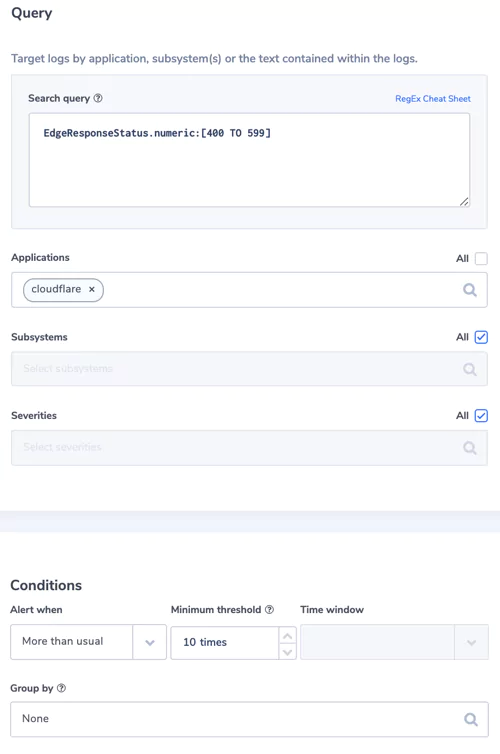
5. EdgeResponseStatus: more 4xx or 5xx than usually

EdgeResponseStatus field provides the HTTP status code returned by Cloudflare to the client

Alert Filter:
– Search Query: EdgeResponseStatus.numeric:[400 TO 599]
– Applications: cloudflare

Alert Condition: more than usual with threshold 10 times

edge response status alert

6. OriginResponseStatus more 4xx and 5xx than usually

OriginResponseStatus field is the HTTP status returned by the origin server

Alert Filter:
– Search Query: OriginResponseStatus.numeric:[400 TO 599]
– Applications: cloudflare

Alert Condition: more than usual with threshold 10 times

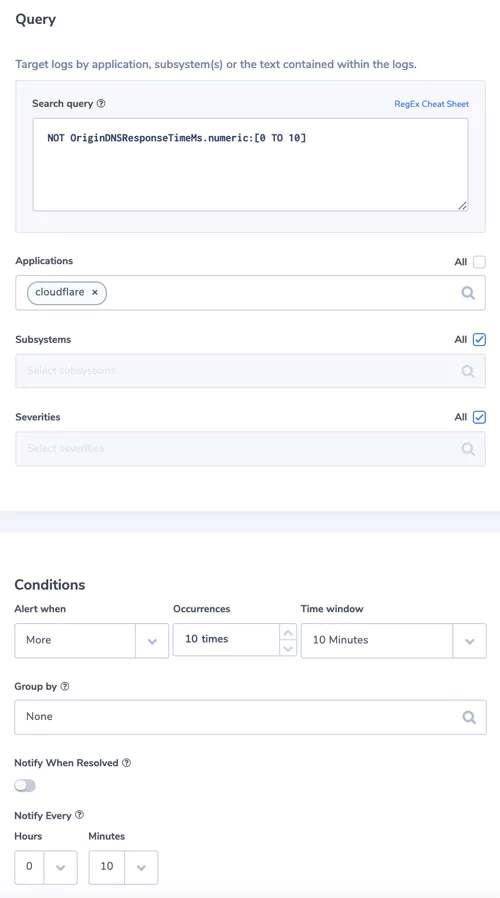
7. Longer DNS response time

Time taken to receive a DNS response for an origin name. Usually 0, but maybe longer if a CNAME record is used.

Alert Filter:
– Search Query: NOT OriginDNSResponseTimeMs.numeric:[0 TO 10]
– Applications: cloudflare

Alert Condition: more than 10 times in 10 minutes

11 Tips for Avoiding Cloud Vendor Lock-In 

Cloud vendor lock-in. In cloud computing, software or computing infrastructure is commonly outsourced to cloud vendors. When the cost and effort of switching to a new vendor is too high, you can become “locked in” to a single cloud vendor. 

Once a vendor’s software is incorporated into your business, it’s easy to become dependent upon that software and the knowledge needed to operate it. It is also very difficult to move databases once live, especially in a cloud migration to move data to a different vendor which may involve data reformatting. Ending contracts early can also suffer heavy financial penalties.

This article will explore 11 ways you can avoid cloud vendor lock-in and optimize your cloud costs.

Tips For Avoiding Cloud Vendor Lock-In

There are ways to reduce the risk of vendor lock-in by following these best practices:

1. Engage All Stakeholders

Stakeholder engagement is crucial to understand the unique risks of cloud vendor lock-in. Initially, the architects should drive the discussion around benefits and drawbacks cloud computing will bring to the organization. These discussions should engage all stakeholders.

The architects and technical teams should be aware of the business implications of their technical decision choices. A solution in the form of applications, workloads and architecture should align with business requirements and risk. Before migrating to a cloud service, carefully evaluate lock-in concerns specific to the vendor and the contractual obligations.

2. Review the Existing Technology Stack

The architects and technical teams should also review the existing technology stack. If the workloads are designed to operate on legacy technologies, the choice of cloud platforms and infrastructure will likely be limited.

3. Identify Common Characteristics

Identify what is compatible across cloud vendors, your existing technology stack and the technical requirements. These common characteristics are key to determining the best solution for your business needs. The lack of compatibles may highlight the need to rethink your strategy, the decision to migrate to cloud and the technical requirements of your workloads.

4. Investigate Upgrading Before Migrating

If your applications are compatible with only a limited set of cloud technologies, you may want to first consider upgrading your applications before migrating to a cloud environment. If your applications and workloads will only work with legacy technologies that are supported by a small number of vendors, the chances of future cloud vendor lock-in is higher.

Once signed up to one of these vendors, any future requirements to move to another vendor may incur a high financial cost or technical challenges.

5. Implement DevOps Tools and Processes

DevOps tools are increasingly being implemented to maximize code portability.

Container technology provided by companies like Docker help isolate software from its environment and abstract dependencies away from the cloud provider. Since most vendors support standard container formats, it should be easy to transfer your application to a new cloud vendor if necessary.

Also, configuration management tools help automate the configuration of the infrastructure on which your applications run. This allows the deployment of your applications to various environments, which can reduce the difficulty of moving to a new vendor.

These technologies reduce the cloud vendor lock-in risks that stem from proprietary configurations and can ease the transition from one vendor to another.

6. Design Your Architecture to be Loosely Coupled 

To minimize the risk of vendor lock-in, your applications should be built or migrated to be as flexible and loosely coupled as possible. Cloud application components should be loosely linked with the application components that interact with them. Abstract the applications from the underlying proprietary cloud infrastructure by incorporating REST APIs with popular industry standards like HTTP, JSON, and OAuth. 

Also, any business logic should be separated from the application logic, clearly defined and documented. This will avoid the need to decipher business rules in case a migration to a new vendor occurs.

Using loosely coupled cloud designs, not only reduces the risk of lock-in to a single vendor, but it also gives your application interoperability that’s required for fast migration of workloads and multi-cloud environments.

7. Make Applications Portable Using Open Standards 

The portability of an application describes its flexibility to be implemented on an array of different platforms and operating systems without making major changes to the underlying code.

Building portable applications can also help organizations avoid cloud vendor lock-in. If you develop a business-critical application whose core functionality depends on platform-specific functionality, you could be locked into that vendor.

The solution is to: 

  • Build portable applications that are loosely coupled using open standards with cloud application components. 
  • Avoid hard coding external dependencies in third-party proprietary applications.
  • Maximize the portability of your data, choose a standardized format and avoid proprietary formatting. 
  • Describe data models as clearly as possible, using applicable schema standards to create detailed, readable documentation.

8. Develop a Multi-Cloud Strategy  

A multi-cloud strategy is where an organization uses two or more cloud services from different vendors and maintains the ability to allocate workloads between them as required. This model is becoming increasingly popular.

Not only does this strategy help organizations avoid cloud vendor lock-in, it also means that they can take advantage of the best available pricing, features, and infrastructure components across providers. An organization can cherry-pick offerings from each vendor so to implement the best services into their applications.

The key to an effective multi-cloud strategy is ensuring that both data and applications are sufficiently portable across cloud platforms and operating environments. By going multi-cloud, an organization becomes less dependent on one vendor for all of its needs. 

There are some disadvantages to a multi-cloud design, such as an increased workload on development teams and more security risk but these outweigh the greater risk of cloud vendor lock-in.

9. Retain Ownership of Your Data 

As your data increases in size while stored with a single vendor, the cost and duration of migrating that data could increase, eventually becoming prohibitive and resulting in cloud vendor lock-in. 

It is worth considering a cloud-attached data storage solution to retain ownership of your data, protect sensitive data and ensure portability should you wish to change vendors.

10. Develop a Clear Exit Strategy 

To help your organization avoid cloud vendor lock-in, the best time to create an exit strategy from a contract with a vendor is before signing the initial service agreement.

While you plan your implementation strategy, agree an exit plan in writing, including:

  • What happens if the organization needs to switch vendors?
  • How can the vendor assist with deconversion if the organization decides to move somewhere else?
  • What are the termination clauses for the agreement? 
  • How much notice is required?
  • Will the service agreement renew automatically?
  • What are the exit costs?

The exit strategy should also clearly define roles and responsibilities. Your organization should clearly understand what’s required to terminate the agreement.

11. Complete Due Diligence

Before you select your cloud vendor, gather a deep understanding of your potential vendor to mitigate the risk of cloud vendor lock-in.

The following items should be a part of your due diligence strategy:

  • Determine your goals of migrating to the cloud.
  • Establish a thorough and accurate understanding of your technology and business requirements. What is expected to change and how?
  • Determine the specific cloud components necessary. 
  • Assess the cloud vendor market. Understand trends in the cloud market, the business models and the future of cloud services.
  • Audit their service history, market reputation, as well as the experiences of their business customers.
  • Select the correct type of cloud environment needed: public, private, hybrid, multi?.
  • Assess your current IT situation, including a thorough audit of your current infrastructure and cost and resource levels.
  • Consider all of the vendor pitches to see if they match your needs. 
  • Look at the different pricing models to determine the cost savings. 
  • Choose the right cloud provider for your organization.
  • Read the fine print and understand their service level agreements.
  • Consider their data transfer processes and costs.
  • Agree to Service Level Agreement (SLA) terms and contractual obligations that limit the possibility of lock-in.

Summary

This article discussed several factors that an organization should consider in order to mitigate cloud vendor lock-in. These included implementing DevOps tools, designing loosely coupled and portable applications, considering a multi-cloud strategy, planning early for an exit and performing due diligence.

While cloud vendor lock-in is a real concern, the benefits of cloud computing outweigh the risks. 

How to automate VPC Mirroring for Coralogix STA

After installing the Coralogix Security Traffic Analyzer (STA) and choosing a mirroring strategy suitable for your organization needs (if not, you can start by reading this) the next step would be to set the mirroring configuration in AWS. However, the configuration of VPC Traffic Mirroring in AWS is tedious and cumbersome – it requires you to create a mirror session per network interface of every mirrored instance, and just to add an insult to injury, if that instance terminates for some reason and a new one replaces it you’ll have to re-create the mirroring configuration from scratch. If you, like many others, use auto-scaling groups to automatically scale your services up and down based on the actual need, the situation becomes completely unmanageable.

Luckily for you, we at Coralogix have already prepared a solution for that problem. In the next few lines I’ll present a tool we’ve written to address that specific issue as well as few use-cases for it.

The tool we’ve developed can run as a pod in Kubernetes or inside a Docker container. It is written in Go to be as efficient as possible and will require only minimal set of resources to run properly. While it is running it will read its configuration from a simple JSON file and will select AWS EC2 instances by tags and then will select network interfaces on those instances and will create VPC Traffic Mirroring sessions for each network interface selected to the configured VPC Mirroring Target using the configured VPC Mirroring Filter.

The configuration used in this document will instruct the sta-vpc-mirroring-manager to look for AWS instances that have the tags “sta.coralogixstg.wpengine.com/mirror-filter-id” and “sta.coralogixstg.wpengine.com/mirror-target-id” (regardless of the value of those tags), collect the IDs of their first network interfaces (that are connected as eth0) and attempt to create a mirror session for each network interface collected to the mirror target specified by the tag “sta.coralogixstg.wpengine.com/mirror-target-id” using the filter ID specified by the tag “sta.coralogixstg.wpengine.com/mirror-filter-id” on the instance that network interface is connected to.

To function properly, the instance hosting this pod should have an IAM role attached to it (or the AWS credentials provided to this pod/container should contain a default profile) with the following permissions:

  1. ec2:Describe* on *
  2. elasticloadbalancing:Describe* on *
  3. autoscaling:Describe* on *
  4. ec2:ModifyTrafficMirrorSession on *
  5. ec2:DeleteTrafficMirrorSession on *
  6. ec2:CreateTrafficMirrorSession on *

Installation

This tool can be installed either as a kubernetes pod or a docker container. Here are the detailed instructions for installing it:

Installation as a docker container:

  1. To download the docker image use the following command:
    docker pull coralogixrepo/sta-vpc-mirroring-config-manager:latest
  2. On the docker host, create a config file for the tool with the following content (if you would like the tool to report to the log what is about to be done without actually modifying anything set “dry_run” to true):
    {
      "service_config": {
        "rules_evaluation_interval": 10000,
        "metrics_exporter_port": ":8080",
        "dry_run": false
      },
      "rules": [
        {
          "conditions": [
            {
              "type": "tag-exists",
              "tag_name": "sta.coralogixstg.wpengine.com/mirror-target-id"
            },
            {
              "type": "tag-exists",
              "tag_name": "sta.coralogixstg.wpengine.com/mirror-filter-id"
            }
          ],
          "source_nics_matching": [
            {
              "type": "by-nic-index",
              "nic_index": 0
            }
          ],
          "traffic_filters": [
            {
              "type": "by-instance-tag-value",
              "tag_name": "sta.coralogixstg.wpengine.com/mirror-filter-id"
            }
          ],
          "mirror_target": {
            "type": "by-instance-tag-value",
            "tag_name": "sta.coralogixstg.wpengine.com/mirror-target-id"
          }
        }
      ]
    }
    
  3. Use the following command to start the container:
    docker run -d 
       -p <prometheus_exporter_port>:8080 
       -v <local_path_to_config_file>:/etc/sta-pmm/sta-pmm.conf 
       -v <local_path_to_aws_profile>/.aws:/root/.aws 
       -e "STA_PM_CONFIG_FILE=/etc/sta-pmm/sta-pmm.conf" 
       coralogixrepo/sta-vpc-mirroring-config-manager:latest

Installation as a Kubernetes deployment:

    1. Use the following config map and deployment configurations:
      apiVersion: v1
      kind: ConfigMap
      data:
        sta-pmm.conf: |
          {
            "service_config": {
              "rules_evaluation_interval": 10000,
              "metrics_exporter_port": 8080,
              "dry_run": true
            },
            "rules": [
              {
                "conditions": [
                  {
                    "type": "tag-exists",
                    "tag_name": "sta.coralogixstg.wpengine.com/mirror-target-id"
                  },
                  {
                    "type": "tag-exists",
                    "tag_name": "sta.coralogixstg.wpengine.com/mirror-filter-id"
                  }
                ],
                "source_nics_matching": [
                  {
                    "type": "by-nic-index",
                    "nic_index": 0
                  }
                ],
                "traffic_filters": [
                  {
                    "type": "by-instance-tag-value",
                    "tag_name": "sta.coralogixstg.wpengine.com/mirror-filter-id"
                  }
                ],
                "mirror_target": {
                  "type": "by-instance-tag-value",
                  "tag_name": "sta.coralogixstg.wpengine.com/mirror-target-id"
                }
              }
            ]
          }
      
      metadata:
        labels:
          app.kubernetes.io/component: sta-pmm
          app.kubernetes.io/name: sta-pmm
          app.kubernetes.io/part-of: coralogix
          app.kubernetes.io/version: '1.0.0-2'
        name: sta-pmm
        namespace: coralogix
      
      ----------
      apiVersion: apps/v1
      kind: Deployment
      metadata:
        labels:
          app.kubernetes.io/component: sta-pmm
          app.kubernetes.io/name: sta-pmm
          app.kubernetes.io/part-of: coralogix
          app.kubernetes.io/version: '1.0.0-2'
        name: sta-pmm
        namespace: coralogix
      spec:
        selector:
          matchLabels:
            app.kubernetes.io/component: sta-pmm
            app.kubernetes.io/name: sta-pmm
            app.kubernetes.io/part-of: coralogix
        template:
          metadata:
            labels:
              app.kubernetes.io/component: sta-pmm
              app.kubernetes.io/name: sta-pmm
              app.kubernetes.io/part-of: coralogix
              app.kubernetes.io/version: '1.0.0-2'
            name: sta-pmm
          spec:
            containers:
              - env:
                  - name: STA_PM_CONFIG_FILE
                    value: /etc/sta-pmm/sta-pmm.conf
                  - name: AWS_ACCESS_KEY_ID
                    value: XXXXXXXXXXXXXXXXXXXXXXXXXXXXXX
                  - name: AWS_SECRET_ACCESS_KEY
                    value: XXXXXXXXXXXXXXXXXXXXXXXXXXXXXX
                image: coralogixrepo/sta-vpc-mirroring-config-manager:latest
                imagePullPolicy: IfNotPresent
                livenessProbe:
                  httpGet:
                    path: "/"
                    port: 8080
                  initialDelaySeconds: 5
                  timeoutSeconds: 1
                name: sta-pmm
                ports:
                  - containerPort: 8080
                    name: sta-pmm-prometheus-exporter
                    protocol: TCP
                volumeMounts:
                  - mountPath: /etc/sta-pmm/sta-pmm.conf
                    name: sta-pmm-config
                    subPath: sta-pmm.conf
            volumes:
              - configMap:
                  name: sta-pmm-config
                name: sta-pmm-config
      

Configuration

To configure instances for mirroring, all you have to do is to make sure that the instances you would like their traffic to be mirrored to your STA, will have the tags “sta.coralogixstg.wpengine.com/mirror-filter-id” and “sta.coralogixstg.wpengine.com/mirror-target-id” pointing at the correct IDs of the mirror filter and target respectively. To find out the IDs of the mirror target and mirror filter that were created as part of the installation of the STA, enter the CloudFormation Stacks page in AWS Console and search for “TrafficMirrorTarget” and for “TrafficMirrorFilter” in the Resources tab:

To assign different mirroring policy to different instances, for example to mirror traffic on port 80 from some instances and mirror traffic on port 53 from other instances, simply create a VPC Traffic Mirror Filter manually with the correct filtering rules (just like in a firewall) and assign its ID to the “sta.coralogixstg.wpengine.com/mirror-filter-id” tag of the relevant instances.

Pro Tip: You can use AWS “Resource Groups & Tag Editor” to quickly assign tags to multiple instances based on an arbitrary criteria.

Good luck!