Does Complexity Equal Security?

“Teacher somewhere in India: The world you see is supported by a giant turtle.

Student: And what holds this giant turtle down?

Teacher: Another giant turtle, of course.

Student: And what is it that holds this one?

Teacher: Don’t worry – there are turtles all the way down!”

Throughout my years of experience, I frequently encountered solutions (or at least attempts to find a solution) for security issues that were rather complicated and cumbersome, that has led me to wonder if those who came up with them sincerely believe that their complexity and subtlety could improve the safety level in their organizations.

In this article, I will attempt to support the claim that states that ‘very often the opposite is correct’, while towards the end I will present two examples of situations where this rule is intentionally bent in order to improve the security of critical assets.


The Scenario

Suppose you have been entitled to protect the building you live in, how would you start the planning process for it? Evidently, you would try to analyze and point out the most critical assets for the enterprise like tenants, letters in the mailboxes, and the bicycles locked down in the lobby. You would attempt to predict the possible threats to these assets and their likelihood. Subsequently, you could effectively reduce the likelihood to an occurrence of one of these threats or minimize its expected risks through a variety of methods. The most common aspect between these methods is that the way in which each method will reduce risk or the chance of realizing one or the other threats, is known to the user.

Often times, in the world of data security or cyber, those in charge of protecting systems do not necessarily understand the thinking process in a potential attackers’ mind deeply enough. Frequently, the result is a network, that paradoxically, is built for managing and maintenance but is easy to break into


A few examples of weak security:

DMZ – according to its’ common definition, is a network located between the public network (usually the Internet) and the corporate network. While controlled access to servers located in it through the internet and the corporate network will be enabled, access to the internet or corporate network from it will not be enabled.

However, in various organizations, there exist a number of DMZ networks and at times several corporate networks. However, as aptly put by Bruce Shneier in his excellent article ‘The feeling and reality of security’ we, as human beings often respond to a perception of security rather than to security itself. The result of such a reality could be a sharp increase in network complexity and thus also the complexity of its treatment and maintenance. In many ways, such an approach requires more attention to small details on the part of network administrators – and in the case of multiple network administrators, special attention to the coordination between them.

If we were to ask ourselves questions about the vulnerabilities and weaknesses of human beings – at the top of the list we would find the weakness of human beings of paying attention to a large quantity of details over time, maintaining concentration over time, and following complex processes…you can already see where this is going…

Another example: A technique that is frequently recommended for network administrators is to place two firewalls in the organization – both being produced by two different manufacturers in back-to-back configuration. This is done so that if any weakness is revealed in one manufacturer, the chances that the same weakness will occur in the other is rather low.

However, the maintenance of these firewalls would require a large amount of resources, and in addition, the same policy would need to be applied to both firewalls in order to take full advantage of them. As the equipment were produced by two different manufacturers, the updates of the equipment changes and becomes more complex over time.

Once again – if we ask ourselves for another commonly exploited weakness, one of the most prominent on the list would be – lack of consistency.

Parents of several children will notice that all principles of their education that they had acquired from childhood is implemented to near perfection with the first child. Suddenly, with the addition of a second child, that disciplined approach may loosen and by the third child, much more has given way – leaving the elder child amazed at how things have changed.

In our case, when we inquire about the network administrator, he explains that he mainly works in back-to-back configuration, but through a deeper examination, we may discover that he was using two different firewalls made by different manufacturers – each one being intended for a different task. For example, one may be responsible for the treatment of IPSEC VPN and services available online, while another for separating the network from several DMZ servers. In this way, filtering takes place by the first or the second firewall, but rarely by both.

Another great example, but with different content:

Many programmers prefer to develop components on their own rather than using open source components. In their opinion, we can never know if someone changed the code on the cloud to a malicious one. When we have control over our own code, it will naturally be perceived with less danger in comparison to code controlled by people whom we do not personally know. Although, as a matter of fact, a code present on the internet is more likely to be secure and organized, since it is open to the public and therefore has more chances of someone detecting flaws in it and offering corrections.

In continuation to the security risks mentioned above, proprietary code may also lead to the likelihood that it contains bugs – this is due to the fact that such a development also requires continuous maintenance, fixing, and a combination with existing components in the organization, especially when it comes to infrastructure development (queue jobs or pipeline components, for example). The “solutions” to such issues typically lead to cumbersome codes that are difficult to maintain and are full of bugs. In addition, in many cases, the programmer who wrote the code leaves the org or changes roles – leaving the organization with code written by an unknown source…which is exactly the point of proprietary code in the first place.

In many organizations, redundant communication equipment as well as parallel communication pathways are stationed in such a way as to reduce the risk for communication failure as a result of the downfall of a Backbone Switch for example.

It is worth noting that while this type of architecture will significantly minimize the risk for communication loss due to a downfall of communication equipment, and if it is set to an active configuration, will also likely reduce the risk of a downfall due to DoS attacks, it also simultaneously creates new risks: risks of attack or malfunction in looping mechanisms (Spanning Tree being one example).

This results in a number of channels that now need to be secured in order to prevent eavesdropping, and a higher chance that equipment failures will go undetected. Meanwhile packet-based monitoring equipment will be unable to collect the needed information easily and effectively.

It is important to understand – I am not stating that the use of communication equipment in order to reduce the risk of communications downfall or size-based attacks is a bad idea. On the contrary, I am only trying to take everything into consideration whilst making such decisions. I most definitely believe that today, communication equipment are rather reliable, therefore organizations need to understand that redundant communication equipment isn’t a magic solution without downside, and that it needs to be tested against the challenges and difficulties that it poses.

I had promised that at the end of this post, I would present an example that in fact demonstrates a situation where complexity is deliberately used in order to create a higher level of security. One example of such a situation, in my opinion, is obfuscation. It is important to keep in mind that compiling source codes into real machine language such as C or C ++ or GO languages, becomes something that is very difficult to reverse back into readable text, and in large projects it becomes nearly impossible. Therefore, many closed source software programs are written in these languages in order to make it difficult for potential thieves to obtain the source code. However, in many cases, due to a variety of technological reasons, many closed source software also need to contain some parts in non – compiled languages or partially compiled ones (such as #C and JAVA), therefore some source code may need to be protected even when compilation is not a possibility. The solution that was discovered was the obfuscation process which converts the code into hard-to-read code by, inter alia:

  • Transferring the whole code into one single row containing all different classes and methods.
  • Switching variable names, classes and functions of random texts.
  • Add demo code that does nothing
  • Dismantling functions into sub-functions

In conclusion, this post demonstrated how the fact that people are managing data security in organizations is what creates complexity often due to the biases inherent in the human brain. This complexity may contribute to the data security of the organization, but it also aggravates it at times. Nevertheless, I have also shown one example where in certain cases complexity itself is being used in order to improve data security.

Instantly Parse The Top 12 Log Types with Coralogix

Throughout the past few months, I had the opportunity to work with and serve hundreds of Coralogix’s customers, the challenges in performing efficient Log Analytics are numerous, from log monitoring, collecting, searching, visualizing, and alerting. What I have come to learn is that at the heart of each and every one of these challenges laid the challenge of data parsing. JSON structured logs are easier to read, easier to search, alert, and visualize. They can be queried using the ES API’s, exported to Excel sheets, and even be displayed in Grafana.  So why is it that a lot of logs are still plain text by default and not structured?

As our focus here in Coralogix was always about our customers and their needs, we developed a parsing engine that allows a single UI to parse, extract, mask, and even exclude log entries in-app, or via API. To get you started with log parsing,  we created pre-defined parsing rules for the 12 most common logs on the web.

In this post, we collected the following log templates and created their own Named group REGEX in order to parse them into JSON structure logs in Coralogix: Apache logs, IIS, logs, MongoDB logs, ELB logs, ALB logs, CloudFront logs, Mysql logs, access logs, Nginx logs, Http headers, user agent field, java stack trace.

Note that every regex is submitted as a recommendation, of course logs can have different configurations and permutations, you can easily adjust the parsing rules below to your needs, more on named group regex here.

1. User Agent (Use an “Extract” rule in Coralogix):

https://regex101.com/r/pw0YeT/3

Sample Log

Mozilla/5.0 (iPad; U; CPU OS 3_2_1 like Mac OS X; en-us) AppleWebKit/531.21.10 (KHTML, like Gecko) Mobile/7B405

Regular Expression

(?P<mozillaVersion>Mozilla/[0-9.]+) ((?P<sysInfo>[^)]+))(?: (?P<platform>[^ ]+))?(?: ((?P<platformInfo>[^)]+)))?(?: (?P<extentions>[^n]+))?

Results

{ 
  "extentions" : "Mobile/7B405" ,
  "platformInfo" : "KHTML, like Gecko" ,
  "sysInfo" : "iPad; U; CPU OS 3_2_1 like Mac OS X; en-us" ,
  "mozillaVersion" : "Mozilla/5.0" ,
  "platform" : "AppleWebKit/531.21.10"
}

2. Cloud-Front (Use a “Parse” rule in Coralogix):

https://regex101.com/r/q2DmKi/4

Sample Log

2014-05-23 01:13:11 FRA2 182 192.0.2.10 GET d111111abcdef8.cloudfront.net /view/my/file.html 200 www.displaymyfiles.com Mozilla/4.0%20(compatible;%20MSIE%205.0b1;%20Mac_PowerPC) - zip=98101 RefreshHit MRVMF7KydIvxMWfJIglgwHQwZsbG2IhRJ07sn9AkKUFSHS9EXAMPLE== d111111abcdef8.cloudfront.net http - 0.001 - - - RefreshHit HTTP/1.1 Processed 1

Regular Expression

(?P<date_time>[0-9]{4}-[0-9]{2}-[0-9]{2}s*[0-9]{2}:[0-9]{2}:[0-9]{2}) (?P<x_edge_location>[^ ]+) (?P<sc_bytes>[0-9]+) (?P<c_ip>[0-9]{1,3}.[0-9]{1,3}.[0-9]{1,3}.[0-9]{1,3}) (?P<cs_method>[^ ]+) (?P<cs_host>[^ ]+) (?P<cs_uri_stem>[^ ]+) (?P<sc_status>[0-9]+) (?P<cs_referer>[^ ]+) (?P<cs_user_agent>[^ ]+) (?P<cs_uri_query>[^ ]+) (?P<cs_cookie>[^ ]+) (?P<x_edge_result_type>[^ ]+) (?P<x_edge_request_id>[^ ]+) (?P<x_host_header>[^ ]+) (?P<cs_protocol>[^ ]+) (?P<cs_bytes>[^ ]+) (?P<time_taken>[^ ]+) (?P<x_forwarded_for>[^ ]+) (?P<ssl_protocol>[^ ]+) (?P<ssl_cipher>[^ ]+) (?P<x_edge_response_result_type>[^ ]+) (?P<cs_protocol_version>[^ ]+) (?P<fle_status>[^ ]+) (?P<fle_encrypted_fields>[^n]+)

Results

{ 
  "x_edge_location" : "FRA2" , 
  "cs_method" : "GET" , 
  "x_edge_result_type" : "RefreshHit" , 
  "ssl_cipher" : "-" ,
  "cs_uri_stem" : "/view/my/file.html" , 
  "cs_uri_query" : "-" ,
  "x_edge_request_id" : "MRVMF7KydIvxMWfJIglgwHQwZsbG2IhRJ07sn9AkKUFSHS9EXAMPLE==" , 
  "sc_status" : "200" , 
  "date_time" : "2014-05-23 01:13:11" ,
  "sc_bytes" : "182" , 
  "cs_protocol_version" : "HTTP/1.1" ,
  "cs_protocol" : "http" , 
  "cs_cookie" : "zip=98101" , 
  "ssl_protocol" : "-" ,
  "fle_status" : "Processed" ,
  "cs_user_agent" : "Mozilla/4.0%20(compatible;%20MSIE%205.0b1;%20Mac_PowerPC)" ,
  "cs_host" : "d111111abcdef8.cloudfront.net" ,
  "cs_bytes" : "-" ,
  "x_edge_response_result_type" : "RefreshHit" ,
  "fle_encrypted_fields" : "1" ,
  "c_ip" : "192.0.2.10" ,
  "time_taken" : "0.001" ,
  "x_forwarded_for" : "-" ,
  "x_host_header" : "d111111abcdef8.cloudfront.net" ,
  "cs_referer" : "www.displaymyfiles.com"
 }


3. ELB (Elastic Load Balancer) – (Use a “Parse” rule in Coralogix):

https://regex101.com/r/T52klJ/1

Sample Log

2015-05-13T23:39:43.945958Z my-loadbalancer 192.168.131.39:2817 10.0.0.1:80 0.000086 0.001048 0.001337 200 200 0 57 "GET https://www.example.com:443/ HTTP/1.1" "curl/7.38.0" DHE-RSA-AES128-SHA TLSv1.2

Regular Expression

(?P<timestamp>[0-9]{4}-[0-9]{2}-[0-9]{2}T[0-9]{2}:[0-9]{2}:[0-9]{2}.[0-9A-Z]+) (?P<elbName>[0-9a-zA-Z-]+) (?P<clientPort>[0-9.:]+) (?P<backendPort>[0-9.:]+) (?P<request_processing_time>[.0-9-]+) (?P<response_processing_time>[.0-9]+) (?P<elb_status_code>[.0-9-]+) (?P<backend_status_code>[0-9-]+) (?P<received_bytes>[0-9-]+) (?P<sent_bytes>[0-9-]+) (?P<request>[0-9-]+) "(?P<user_agent>[^"]+)" "(?P<ssl_cipher>[^"]+)" (?P<ssl_protocol>[- A-Z0-9a-z.]+)

Results

{ 
  "received_bytes" : "200" , 
  "request" : "57" , 
  "elb_status_code" : "0.001337" , 
  "ssl_cipher" : "curl/7.38.0" , 
  "elbName" : "my-loadbalancer" ,
  "request_processing_time" : "0.000086" , 
  "sent_bytes" : "0" , 
  "response_processing_time" : "0.001048" , 
  "backendPort" : "10.0.0.1:80" , 
  "backend_status_code" : "200" , 
  "clientPort" : "192.168.131.39:2817" , 
  "ssl_protocol" : "DHE-RSA-AES128-SHA TLSv1.2" , 
  "user_agent" : "GET https://www.example.com:443/ HTTP/1.1" , 
  "timestamp" : "2015-05-13T23:39:43.945958Z"
}

4. MongoDB (Use a “Parse” rule in Coralogix):

https://regex101.com/r/pBM9DO/1

Sample Log

2014-11-03T18:28:32.450-0500 I NETWORK [initandlisten] waiting for connections on port 27017

Regular Expression

(?P<timestamp>[0-9]{4}-[0-9]{2}-[0-9]{2}T[0-9]{2}:[0-9]{2}:[0-9]{2}.[0-9]{3}-[0-9]{4}) (?P<severity>[A-Z]) [A-Z]+ *[[a-zA-Z0-9]+] (?P<message>[^n]+)

Results

{ 
  "severity" : "I" , 
  "message" : "waiting for connections on port 27017" ,
  "timestamp" : "2014-11-03T18:28:32.450-0500" 
}

5. NSCA access logs (Use a “Parse” rule in Coralogix):

https://regex101.com/r/Iuos8u/1/

Sample Log

172.21.13.45 - MicrosoftJohnDoe [07/Apr/2004:17:39:04 -0800] "GET /scripts/iisadmin/ism.dll?http/serv HTTP/1.0" 200 3401

Regular Expression

(?P<clientIP>[0-9]{1,3}.[0-9]{1,3}.[0-9]{1,3}.[0-9]{1,3})s*(?P<userIdentidier>[^ ]+) (?P<userID>[^ ]+) [(?P<timestamp>[^]]+)] "(?P<clientRequest>[^"]+)" (?P<statusCode>[0-9-]+) (?P<numBytes>[0-9-]+)

Results

{ 
   "numBytes" : "3401" ,
   "userIdentidier" : "-" ,
   "clientIP" : "172.21.13.45" ,
   "userID" : "MicrosoftJohnDoe" ,
   "statusCode" : "200" , 
   "timestamp" : "07/Apr/2004:17:39:04 -0800" , 
   "clientRequest" : "GET /scripts/iisadmin/ism.dll?http/serv HTTP/1.0"
}

6. Java Stacktrace (Use an “Extract” rule in Coralogix):

https://regex101.com/r/ZAAuBW/2

Sample Log

Exception in thread "main" java.lang.NullPointerException 
at com.example.myproject.Book.getTitle(Book.java:16) 
at com.example.myproject.Author.getBookTitles(Author.java:25)
at com.example.myproject.Bootstrap.main(Bootstrap.java:14)

Regular Expression

Exception(?: in thread) "(?P<threadName>[^"]+)" (?P<changethenamelater>.*)s+(?P<stackeholder>(.|n)*)

Results

{ 
  "changethenamelater" : "java.lang.NullPointerException " ,
  "stackeholder" : "at com.example.myproject.Book.getTitle(Book.java:16) 
                    at com.example.myproject.Author.getBookTitles(Author.java:25) 
                    at com.example.myproject.Bootstrap.main(Bootstrap.java:14)" ,
  "threadName" : "main" 
}

7. Basic HTTP Headers (Use a “Extract” rule in Coralogix):

https://regex101.com/r/JRYot3/1

Sample Log

GET /tutorials/other/top-20-mysql-best-practices/ HTTP/1.1

Regular Expression

(?P<method>[A-Z]+) (?P<path>[^ ]+) (?P<protocol>[A-Z0-9./]+)

Results

{ 
  "path" : "/tutorials/other/top-20-mysql-best-practices/" , 
  "protocol" : "HTTP/1.1" , 
  "method" : "GET"
}

8. Nginx (Use a “Parse” rule in Coralogix):

https://regex101.com/r/yHA8Yh/1

Sample Loghttps://regex101.com/r/yHA8Yh/1

127.0.0.1 - dbmanager [20/Nov/2017:18:52:17 +0000] "GET / HTTP/1.1" 401 188 "-" "Mozilla/5.0 (X11; Ubuntu; Linux x86_64; rv:47.0) Gecko/20100101 Firefox/47.0"

Regular Expression

(?P<remoteAdd>[0-9.]+) - (?P<remoteUser>[a-zA-z]+) [(?P<timestamp>[^]]+)] "(?P<request>[^"]+)" (?P<status>[0-9]+) (?P<bodyBytesSent>[0-9]+) "(?P<httpReferer>[^"]+)" "(?P<httpUserAgent>[^"]+)"

Results

{ 
  "remoteUser" : "dbmanager" , 
  "request" : "GET / HTTP/1.1" ,
  "bodyBytesSent" : "188" , 
  "remoteAdd" : "127.0.0.1" , 
  "httpUserAgent" : "Mozilla/5.0 (X11; Ubuntu; Linux x86_64; rv:47.0) Gecko/20100101
   Firefox/47.0" ,  
  "httpReferer" : "-" , 
  "timestamp" : "20/Nov/2017:18:52:17 +0000" ,
  "status" : "401"
}

9. MySQL (Use a “Parse” rule in Coralogix):

https://regex101.com/r/NjtRLZ/4

Sample Log

2018-03-31T15:38:44.521650Z 2356 Query SELECT c FROM sbtest1 WHERE id=164802

Regular Expression

(?P<timestamp>[0-9]{4}-[0-9]{2}-[0-9]{2}T[0-9]{2}:[0-9]{2}:[0-9]{2}.[0-9]{6}Z) ? ? ? ? ? ?(?P<connID>[0-9]+) (?P<name>[a-zA-Z]+) (?P<sqltext>[^n]+)

Results

{
“sqltext” : “SELECT c FROM sbtest1 WHERE id=164802” ,
“name” : “Query” ,
“connID” : “2356” ,
“timestamp” : “2018-03-31T15:38:44.521650Z”
}

10. ALB (Use a “Parse” rule in Coralogix):

https://regex101.com/r/NjtRLZ/4

Sample Log

2018-03-31T15:38:44.521650Z 2356 Query SELECT c FROM sbtest1 WHERE id=164802 http 2018-11-30T22:23:00.186641Z app/my-loadbalancer/50dc6c495c0c9188 192.168.131.39:2817 - 0.000 0.001 0.000 502 - 34 366 "GET https://www.example.com:80/ HTTP/1.1" "curl/7.46.0" - - arn:aws:elasticloadbalancing:us-east-2:123456789012:targetgroup/my-targets/73e2d6bc24d8a067 "Root=1-58337364-23a8c76965a2ef7629b185e3" "-" "-" 0 2018-11-30T22:22:48.364000Z "forward" "-" "LambdaInvalidResponse"

Regular Expression

(?P<type>[a-z0-9]{2,5}) (?P<timestamp>[0-9]{4}-[0-9]{2}-[0-9]{2}T[0-9]{2}:[0-9]{2}:[0-9]{2}.[0-9]{6}Z) (?P<elb>[^n]+) ? ?(?P<clientPort>[0-9.:-]+) (?P<targetPort>[0-9.:-]+) (?P<requestProcessTime>[0-9.:]+) (?P<targetProcessTime>[0-9.:-]+) (?P<responseProcessingTime>[0-9.:-]+) (?P<elbStatusCode>[0-9-]+) (?P<targetStatus>[0-9-]+) (?P<recievedBytes>[0-9-]+) (?P<sentBytes>[0-9-]+) ? ?"(?P<request>[^"]+)" "(?P<userAgent>[^"]+)" (?P<sslCipher>[^ ]+) (?P<sslProtocol>[^n]+) ? ?(?P<targetGroupArn>[^n]+) ? ?"(?P<traceID>[^"]+)" "(?P<domainName>[^"]+)" "(?P<chosenCertArn>[^"]+)" ? ?(?P<matchedRulePriority>[^ ]+) (?P<requestCreationTime>[0-9]{4}-[0-9]{2}-[0-9]{2}T[0-9]{2}:[0-9]{2}:[0-9]{2}.[0-9]{6}Z) "(?P<actionsExecuted>[^"]+)" "(?P<redirectURL>[^"]+)" "(?P<errorReason>[^"]+)"

Results

{

“traceID” : “Root=1-58337364-23a8c76965a2ef7629b185e3” ,
“request” : “GET https://www.example.com:80/ HTTP/1.1” ,
“requestCreationTime” : “2018-11-30T22:22:48.364000Z” ,
“redirectURL” : “-” , “targetGroupArn” : ” ” ,
“type” : “http” , “targetPort” : “-” ,
“responseProcessingTime” : “0.000” ,
“targetProcessTime” : “0.001” ,
“chosenCertArn” : “-” ,
“errorReason” : “LambdaInvalidResponse” ,
“matchedRulePriority” : “0” ,
“actionsExecuted” : “forward” ,
“clientPort” : “7” ,
“elb” : “app/my-loadbalancer/50dc6c495c0c9188 192.168.131.39:281” ,
“targetStatus” : “-” ,
“recievedBytes” : “34” ,
“timestamp” : “2018-11-30T22:23:00.186641Z” ,
“sslCipher” : “-” ,
“userAgent” : “curl/7.46.0” ,
“requestProcessTime” : “0.000” ,
“domainName” : “-” ,
“elbStatusCode” : “502” ,
“sslProtocol” : “- arn:aws:elasticloadbalancing:us-east-2:123456789012:targetgroup/my-targets/73e2d6bc24d8a067” ,          “sentBytes” : “366”
}

11. IIS (Use a “Parse” rule in Coralogix):

https://regex101.com/r/ytJdyE/2

Sample Log

192.168.114.201, -, 03/20/05, 7:55:20, W3SVC2, SERVER, 172.21.13.45, 4502, 163, 3223, 200, 0, GET, /DeptLogo.gif, -,

Regular Expression

(?P<clientIP>[0-9]{1,3}.[0-9]{1,3}.[0-9]{1,3}.[0-9]{1,3}), (?P<userName>[^,]+), (?P<timestamp>[[0-9]{2}/[0-9]{2}/[0-9]{2}, [0-9]{1,2}:[0-9]{1,2}:[0-9]{1,2}), (?P<serviceInstance>[^,]+), (?P<serverName>[^,]+), (?P<serverIP>[0-9]{1,3}.[0-9]{1,3}.[0-9]{1,3}.[0-9]{1,3}), (?P<timeTaken>[^,]+), (?P<clientBytesSent>[^,]+), (?P<serverBytesSent>[^,]+), (?P<serviceStatusCode>[^,]+), (?P<windowsStatusCode>[^,]+), (?P<requestType>[^,]+), (?P<targetOfOperation>[^,]+), (?P<parameters>[^,]+),

Results

{
“requestType” : “GET” ,
“windowsStatusCode” : “0” ,
“serverName” : “SERVER” ,
“userName” : “-” ,
“timeTaken” : “4502” ,
“serverBytesSent” : “3223” ,
“clientIP” : “192.168.114.201” ,
“serverIP” : “172.21.13.45” ,
“serviceInstance” : “W3SVC2” ,
“parameters” : “-” ,
“targetOfOperation” : “/DeptLogo.gif” ,
“serviceStatusCode” : “200” ,
“clientBytesSent” : “163” ,
“timestamp” : “03/20/05, 7:55:20”
}

12. Apache (Use a “Parse” rule in Coralogix):

https://regex101.com/r/2pwM6J/1

Sample Log

127.0.0.1 – frank [10/Oct/2000:13:55:36 -0700] “GET /apache_pb.gif HTTP/1.0” 200 2326

Regular Expression

(?P<clientIP>[0-9]{1,3}.[0-9]{1,3}.[0-9]{1,3}.[0-9]{1,3}) (?P<identd>[^ ]+) (?P<userid>[^ ]+) [(?P<timesptamp>[^]]+)] "(?P<request>[^"]+)" (?P<statusCode>[^ ]+) (?P<objectSize>[^ ]+)

Results

{
“request” : “GET /apache_pb.gif HTTP/1.0” ,
“timesptamp” : “10/Oct/2000:13:55:36 -0700” ,
“objectSize” : “2326” ,
“clientIP” : “127.0.0.1” ,
“identd” : “-” ,
“userid” : “frank” ,
“statusCode” : “200”
}

Terraform vs Helm Charts

Since Docker first came onto the scene in 2013 and really popularized containerization, many organizations have chosen to deploy cloud workloads using Docker containers.

Containers come with numerous benefits over running applications directly inside of a virtual machine hypervisor, including significantly portability benefits and efficiencies in terms of storage and overhead.

Docker provides a runtime for running containerized applications, in addition to a format for encapsulating and delivering applications in containers.

With the increasing adoption of containerization, the need arose to manage, schedule and control clusters of containers, and that’s where Kubernetes comes in. Kubernetes is an open-source system for automating deployment, scaling, and management of containerized applications, generally being Docker containers.

When interfacing with Kubernetes, 2 competing tools are often discussed: Terraform, and Helm.

Terraform

Terraform is a tool for building, changing, and versioning infrastructure safely and efficiently. Terraform can manage existing providers, as well as custom in-house solutions.

Terraform

For example, in large-scale infrastructures, static assignment of applications to machines becomes a challenge. To solve this, there are a number of schedulers like the aforementioned Kubernetes that can be used to dynamically schedule Docker containers. Resource schedulers can be treated as a provider, which allows Terraform to request resources from them, enabling Terraform to be used in layers; setting up the physical infrastructure running the schedulers, and provisioning onto the scheduled grid.

Configuration management is critical in the software development ecosystem, and while people have used platforms like Chef or Puppet for this purpose, Terraform adds a whole new dimension.

Key features of Terraform include:

Infrastructure as Code: Infrastructure as code (or IaC) is the process of managing and provisioning computer data centers through machine-readable definition files, rather than physical hardware configuration or interactive configuration tools. With Terraform, infrastructure is described using a high-level configuration syntax, allowing a blueprint of your data center to be versioned and treated as you would any other code.

Smoothness through cloud provider’s API

Terraform actually uses the cloud provider’s API, which makes the whole process a lot smoother, and more effective in terms of maintainability, ease and security.

Stability and efficiency through immutable infrastructure

Forget about configuration drift and bugs. Terraform uses the immutable infrastructure approach, where servers are replaced rather than changed. This means simplified operations, fewer failures, and fewer errors, threats, and vulnerabilities.

Simplicity through code

With server provisioning, Terraform leaves issues pertaining to software container deployment to Docker. The cloud infrastructure is seen as code, bringing additional advantages.

Effectiveness through declarative code style

With a declarative code style (imperative programming: how you do something, declarative programming: what you do/what the end state should be), meaning advantages when it comes to succinctness, speed, and fewer complications.

Terraform works with any cloud-based setup, so it doesn’t matter if it’s public cloud or an on-premise-based setup.

It allows:

Execution Plans: Use the planning step to see what will happen when you call apply, avoiding nasty surprises.

Resource Graph: Builds a graph of all your resources, and build infrastructure as efficiently as possible.

Change Automation: Apply changesets to your infrastructure automatically, conserving resources and avoiding errors.

Terraform is open source, with strong community engagement.

Helm

Helm helps users manage Kubernetes applications, and Helm Charts assists users in defining, installing, and upgrading Kubernetes applications.

helm

Helm is maintained by the CNCF in collaboration with Microsoft, Google, Bitnami and the Helm contributor community.

Keeping with the nautical theme of docking, containers and quays, Helm enables Kubernetes users greater control over their cluster, just like the captain of a ship at the helm.

Helm Charts provide the ability to leverage Kubernetes packages when building and deploying applications through a click or single CLI command. When a user executes the Helm install command, a Tiller (yes, another maritime reference) Server receives the incoming request, installing the appropriate package into the Kubernetes cluster. These packages are called Charts.

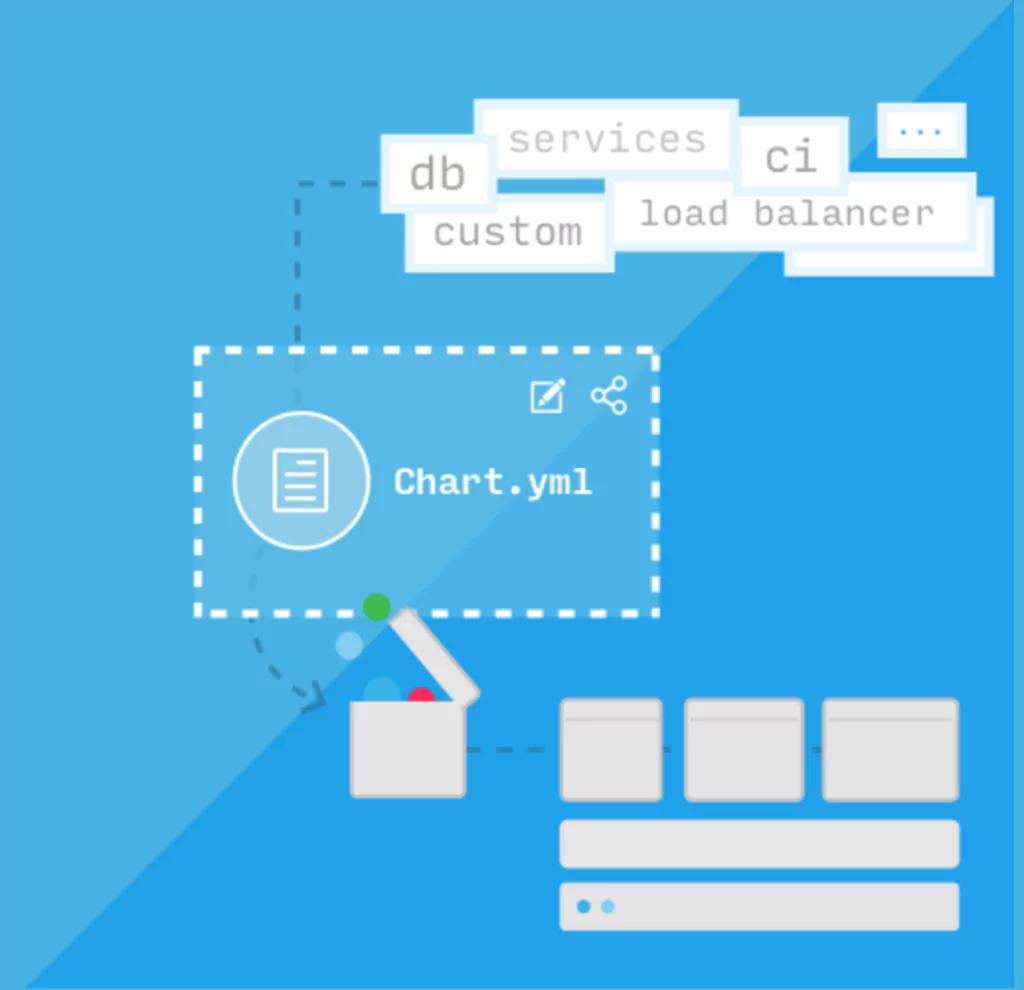
A chart can have deployments, configmaps, services, and so on defined as yaml files, which are templates. You can define certain charts as dependencies for other charts, or nest charts inside others.

Helm has a number of advantages:

  • Deploy and manage manifests in a production environment
  • Complex applications can be packaged together
  • Rollback or upgrade multiple objects together
  • An extensive and reusable pre-built chart repository
  • Easily change parameters of templates
  • Deploy to multiple environments easily

Helm has been praised by users for its vibrant community, its ability to manage complex apps, in-place upgrades and custom hooks for hassle-free updates, the ability to share Chart, and easy rollbacks.

Terraform vs Helm

Both Terraform and Helmchart have a number of similarities, as well as some differences.

In terms of similarities, they allow you to describe and maintain Kubernetes objects as code, they support modularity, have a curated list of packages, allow you to see the impact of changes before running them, and allow installation from sources like git repositories or local directories.

In terms of differences, Terraform does not install anything within the Kubernetes cluster itself, while Helm installs Tiller within the cluster. Helm cannot install a Kubernetes cluster, while Terraform can. When it comes to modularity Terraform uses modules while Helm uses sub-charts, and Terraform uses the JSON/HCL file format while Helm uses standard manifests and Go-templates.

Both Terraform and Helm have their advantages and disadvantages. For example, because Terraform uses the same tool and codebase for both infrastructure and cluster management, there is not too much of a learning curve when it comes to using it with Kubernetes. Terraform is also relatively new with its Kubernetes interfacing, so there are some kinks and issues. On the other hand, rolling back with Helm is a lot easier, but maintaining it can take up precious resources.

The safe option is to go with Helm, as it has been around for a while and has proven itself, not to mention the support of some serious players behind its continuing development. Terraform is improving rapidly, however, and can do a lot of the heavy lifting for you.

Using the Tools to Add Value

The debate is likely to rage on for a while, but what cannot be disputed is the popularity of Kubernetes, and the value it can add to any organization. The great news is that with some simple integrations, there are configuration management tools available that can take Kubernetes to a whole new level. Coralogix can be integrated into Kubernetes logs with a pre-set image so that you can take advantage of everything the platform has to offer: including mapping software flows, automatically detecting production problems, delivering pinpoint insights and providing top-level visibility.

Be GDPR Ready: Prepare Your Log Data

Organizations both small and large that deal with personal data must be compliant with GDPR rules. At Coralogix, we’ve been working hard to be prepared for GDPR logging monitoring. Preparing your data for GDPR log management can be a daunting task, so we thought we’d shed some light on the issue.

What’s GDPR?

The European Union’s (EU) General Data Protection Regulation, or GDPR, is a set of regulations designed to protect the privacy of EU citizens, particularly as the volume and pace of data generated is exploding. With privacy laws and data breaches being in the news of late, GDPR log retention is seen as a way for individuals to protect their data, access their data, and understand what is being done with that data.

The regulations come into effect on May 25, 2018, and in general, terms affect any EU organization, organizations with an EU presence, and organizations with EU customers. The penalties for those who should comply with the regulations are severe: companies could face penalties of up to €20 million or 4% of their annual worldwide revenue, whichever is higher.

GDPR aims to ensure certain key rights for individuals. These rights include the right to be informed, the right of access, the right to rectification, the right to erasure, the right to restrict processing, the right to data portability, the right to object, and the right not to be subject to automated decision-making including profiling.

Coralogix is a GDPR-ready data processor

Assisting users is one of the fundamental principles of Coralogix’s business, and so protecting users’ data and ensuring GDPR compliance is a natural extension of this and a priority for the company. To this end, we’re proud to declare that Coralogix is GDPR-ready.

Coralogix now runs its servers in Europe so EU citizens data doesn’t leave the continent, its infrastructure is SOC2 and PCI compliant as well as being GDPR ready. In addition to this, Coralogix’s application is certified by BDO to be SOC2 type2 compliant (security, availability, data Integrity) for 2018. A full report can be provided upon request. In order to make things easier for our customers facing GDPR regulations we have added a few features that are aimed at meeting the EU new standards:
Flexible data retention policies – change your retention plan upon request within 24H.
Data deletion – by date, or even by a specific key (e.g a specific customer requests to delete all his logs by email)

Available on the Coralogix website are our terms and conditions that spell out exactly what information is collected and why. Coralogix does not collect any personal information besides account username. It is the client’s responsibility to not send sensitive information to Coralogix’s servers.
In general, saving log data (specifically web servers which may contain PII) is allowed for a defined period (i.e retention period) for maintaining the customers’ systems availability and security.

Technical Aspect of GDPR-Ready

Besides our data security policies and data encryption throughout the sending and storing chain, Coralogix offers ways to make sure PII isn’t saved and helps you clean up PII in case it did reach your log data. 

  • Coralogix offers a centralized interface for masking or blocking, logs containing Personally Identifiable Information/sensitive data, in case they are accidentally sent even before they are indexed or stored anywhere.
  • In terms of the removal of data, Coralogix allows the deletion of data by day or key upon request and within 120 hours. Data is stored in different indexes for different teams/companies so that it is completely separated using Elastic Shield.

Preparing Your Log Data for GDPR

Part of being GDPR compliant is ensuring that your log data is prepared for GDPR, including understanding the types of data that shouldn’t exist in logs. The points we offer here are general in nature, and we recommend obtaining legal advice to ensure full compliance.

First off, logs can contain information classified as “personal data” by default under GDPR regulations. In general, the GDPR regulations encourage organizations not to collect any information about users (let it be email addresses, phone numbers, or even IPs), unless there is documented and informed consent for this collection. It also aims to achieve, through regulation, for collected information not to be used for anything but the specific purposes that consent was given for.

This is a far cry from what has been happening up until now with log data, where the focus was on collecting and storing as much data as possible and storing this for as long as possible.

For instance, web server logs, access logs, and security audit logs all contain personal information by default as defined in the GDPR regulations, and IP addresses specifically are defined as personal data.

As a general rule, if there is not a legitimate need to store these logs, you should disable logging for these components. This type of information is not even allowed to store without having direct consent from the user, outlining the purposes you intend to store the information for.

In fact, it’s best to be on the side of caution and ensure that as little customer information is stored as possible, and even then only when necessary and only with consent – along with compliance with all the other GDPR requirements.

There is an important exception to this general rule, however: collecting and storing personal data as part of your ability to maintain the security and availability of your system and prevent fraud and/or unauthorized access, is allowed for a limited (declared) period of time. 

In addition, for your application logs, make sure you don’t log any PII in your code, and define a clear retention policy so that data is periodically deleted and not stored forever. It is also important to have an easy way to track PII in your logs and delete it upon request, entirely or by a specific key/query. 

Bring It On

Coralogix, as your GDPR-ready partner, is already on your side when it comes to this complex issue, and by ensuring that we are compliant you can rest assured that you have a strong partner with which to achieve your business goals.

How To Explain DevOps – 10 Ways To Get It Perfectly Right

DevOps: 10 Explanations That Get It Perfectly Right

Describing your profession to other people is never easy, especially if you work in the development field. Non-technical people often lack the understanding and terms that may seem just so obvious to you. And if you’re a DevOps expert, multiply the struggle times 10.

To help, we’ve put together a cheat sheet style post to explain DevOps to non-technical people. Send this to your friends and family or reference a section, the hope is that you will be able to explain what it is you do in half the time it usually takes you. We also hope others will realize that DevOps is one of the most critical – and misunderstood – elements of business today.

Rundown on DevOps

DevOps is the combination of Development & Operations. It’s a process used to create better products, which is done by streamlining communication between those who build the product, and those who are responsible for its functioning. DevOps is much more than a “profession” though, it’s a culture, a new way of thinking. And in order to be effective, DevOps has to be a part of an organization’s DNA.

Cheat Sheet

Here is a list of ways to explain DevOps to 10 different people. After all, explaining what DevOps is to non-techies is almost as hard as actually being a DevOps practitioner!

  1. Your Mom

You: So Mom, remember when X (replace with your little sibling’s name) was born and you told dad that you need a new car, only to come home and see he had bought a Coupé?

Well, that’s Dad being a typical developer, racing away to build an advanced product. And the car, well, that’s like the product itself. If Dad had communicated with an Operations expert (you, Mom), and had a DevOps mindset, he would have bought a car with a trunk that could actually hold a stroller.

  1. A 6-year Old

You: Why are you crying?

6-year old: I built a 6ft Lego tower

You: Wow, that’s pretty amazing, where is it?

6-year old: (crying) On the living room floor. Broken to pieces

(Silence)

6-year old: “She did it!” (Pointing at 9-month old sister who just crawled into the room)

You guessed it. The Lego tower is – well, was – the product. The 6-year old is the developer, and the 9-month old is malicious software exploiting a security breach. DevOps would have been you and the 6-year old talking before building the tower, agreeing to build the Lego tower (product) in their room, where it’s safe from little siblings (malicious software).

  1. Your Teenager

You: You know why we don’t let you have parties at home anymore, right?

Teenager: Oh come on… it was like 2 decades ago!

You: 2 months ago, for starters. And we’re still paying for the damage your 70 friends did to the living room.

In this scenario, your house is the product, and the living room is a server, with capacity for 30 people, max. DevOps would be your teenager understanding the living room’s limitations and taking the party to the backyard when the living room was getting too full.  

  1. A Traffic Officer

You: Imagine you’re on highway patrol, and everything looks normal. Just regular people driving straight in their lanes. Then, all of the sudden, you see someone swerving back and forth across lanes. So, of course, you pull them over to make sure they aren’t drunk.

Well, that’s DevOps. Everyone on the road is like data acting the same way it did yesterday, and the day before, and the day before that. The drunk driver is data that behaves differently than what you expect (an anomaly) and alerts you to investigate further. And the traffic officer is the DevOps engineer ensuring everything continues to run smoothly when something is off.

  1. Your Grandmother

You: Remember how you used to spend hours walking around malls looking for Christmas presents for us?

Grandmother: Yes, of course, dear.

You: And isn’t it great that Mom now sends you links to Amazon, and you just order everything online?”

Grandmother: Oh yes, I love seeing you wearing the sweater I bought you!

Your Mom showing your Grandmother a smarter and more efficient way of shopping for gifts is what DevOps is all about. It’s making sure you create the right product according to your customers’ needs (even though not every generation may understand it).

  1. Your Local Grocery Store Cashier

You: You know when you want to cancel a product, but then have to call the main cashier to swipe their card for permission?

Cashier: Yes, it’s the most frustrating and time-consuming problem.

In this scenario, you, the cashier, are the developer, wanting to revert something on production, and the main cashier is the DevOps.  

  1. Your Waiter/Waitress

You: Do you aim to bring your customers their food as fast as possible?

Waiter/Waitress: Yes, of course!  

You: Would you bring a customer their drink after they’ve already finished their food?

Waiter/Waitress: No of course not. What would be the point?

It may seem obvious, but a waiter or waitress delivering a customer their food without their drink would be a software developer. They’re aiming to deliver right away even though delivering one without the other doesn’t do anyone any good. Making sure customers get a perfectly cooked burger, together with their soda for the perfect experience, now that’s what DevOps is all about.

  1. Your Uber Driver

You: Remember that time you picked up that drunk guy who wanted to put a box in your trunk?

Uber Driver: Yes…

You: And then the box turned out to be full of beer bottles that broke and ruined your trunk?

Uber Driver: It’ll be awhile until I forget that!

You: And remember how you couldn’t work for a week afterward because you had to clean up the car and get rid of the smell?

Uber Driver: Yes, thanks for bringing it up again.

Your car is the product, and the drunk dude is a new developer who wanted to push code on a Friday afternoon. A DevOps expert would be the drunk guy’s (sober) friend telling you (the Uber Driver) that he is drunk and that you should be careful because that box can break and ruin your trunk.

  1. Your Dog (in the case he/she speaks English)

“Rover, giving me the signal that you need to poop, then waiting by the door for me to get ready and take you out, that’s classic DevOps. Who’s a good boy!?”

  1. Your Cat ( in the case he/she gives a damn about what you do)

“When you spend hours observing the front deck just in case a mouse tries to sneak in the house, that’s DevOps.”

Changing Your View

We hope this post has been not only enjoyable to read, but useful in giving you ways to explain what DevOps is to whoever it is you’re speaking to. As mentioned, DevOps is a whole new way of thinking, and when properly implemented, it adds massive value to organizations.

To learn more about DevOps and stay in the know with the latest trends, tips and tricks, follow our blog!

Ruby logging best practices and tips

Ruby is an opinionated language with inbuilt Ruby logging monitoring options that will serve the needs of small and basic applications. Whilst there are fewer alternatives to these than say, the JavaScript world, there are a handful, and in this post, I will highlight those that are active (based on age and commit activity) and help you figure out the options for logging your Ruby (and Rails applications).

Before proceeding, take note that this article was written using Rails v4.x; later versions of Rails may not be supported.

Best logging practices – general

Before deciding what tool works best for you, following broad logging best practices will also apply to Ruby logging and will help make anything you do log more useful when trying to track down a problem. Read “The Most Important Things to Log in Your Application Software” and the introduction of “JAVA logging – how to do it right” for more details, but in summary, these rules are:

  • Enable logging: This sounds obvious, but double check you have enabled logging (in whatever tool you use) before deploying your application and don’t solely rely on your infrastructure logging.
  • Categorize your logs: As an application grows in usage, the quantity of logs it generates will grow and the ability to filter logs to particular categories or error levels such as authorization, access, or critical can help you drill down into a barrage of information.
  • Logs are for everyone: Your logs are useful sources of information for a variety of stakeholders including support and QA engineers, and new programmers on your team. Keep them readable, understandable and with a clear purpose.

Inbuilt options

Ruby ships with two inbuilt methods for logging application flow, puts, most suited to command line applications, and logger, for larger, more complex applications.

puts takes one parameter, the object(s) you want to output to stdout, with each item outputting to a new line:

puts(@post.name, @post.title)

logger provides a lot of options for an inbuilt class, and Rails enables it by default.

logger.info #{@post.name}, #{@post.title}

The logger class provides all the log information you typically see when running Rails. You can set levels with each message, and log messages above a certain level.

require ‘logger’
logger = Logger.new(STDOUT)
logger.level = Logger::WARN

logger.debug(“No output”)
logger.info(“No output”)
logger.warn(“Output”)
logger.fatal(“Output”)

Logger doesn’t escape or sanitize output, so remember to handle that yourself. For details on how to do this, and create other forms of custom loggers and message formatters, read the official docs

Taming logger with Lograge

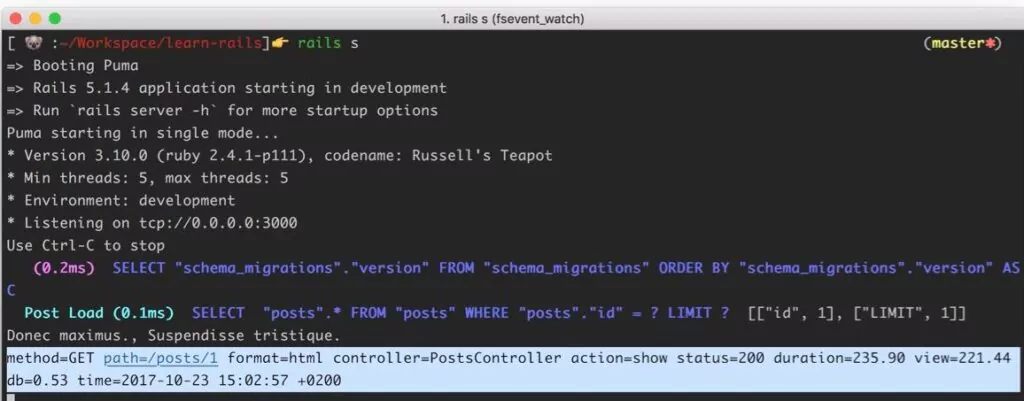
Whilst many Rails developers find it’s default logging options essential during development, in production, it can be noisy, overwhelming, and at worst, unhelpful. Lograge attempts to reduce this noise to more salient and useful information, and into a format that is less human-readable, but is more useful to external logging systems if you use its JSON formatted output option.

There are many ways you can initialize and configure the Gem, I stuck to the simplest, by creating a file in config/initializers/lograge.rb with the following content:

Rails.application.configure do
  config.lograge.enabled = true
end

Which changes the output to this.

ruby logging best practices

Lograge output

Unsurprisingly there are a lot of configuration options to tweak the logging output to suit you based on values available in the logging event. For example to add a timestamp:

Rails.application.configure do
  config.lograge.enabled = true

  config.lograge.custom_options = lambda do |event|
    { time: event }
  end
end

You can also add custom payloads into the logging information for accessing application controller methods such as request and current_user.

config.lograge.custom_payload do |controller|
  {
    # key_name: controller.request.*,
    # key_name: controller.current_user.*
    # etc…
  }
end

If adding all this information already feels counter to the point of lograge, then it also gives the ability to remove information based on certain criteria. For example:

config.lograge.ignore_actions = [‘PostsController#index’, ‘VisitorsController#new’]
  config.lograge.ignore_custom = lambda do |event|
    # return true if you want to ignore based on the event
  end

Logging with logging

Drawing inspiration from Java’s log4j library, logging offers similar functionality to the inbuilt logger, but adds hierarchical logging, custom level names, multiple output destinations and more.

require ‘logging’

logger = Logging.logger(STDOUT)
logger.level = :warn

logger.debug “No output”
logger.warn “output”
logger.fatal “output”

Or to create custom loggers that output to different locations and assigned to different classes.

require ‘logging’

Logging.logger[‘ImportantClass’].level = :warn
Logging.logger[‘NotSoImportantClass’].level = :debug

Logging.logger[‘ImportantClass’].add_appenders
    Logging.appenders.stdout,
    Logging.appenders.file(‘example.log’)

class ImportantClass
  logger.debug “I will log to a file”
end

class  NotSoImportantClass
  logger.debug “I will log to stdout”
end

Next Generation Logging with Semantic Logger

One of the more recent projects on this list, semantic_logger aims to support high availability applications and offers a comprehensive list of logging destinations out of the box. If you are using Rails, then instead use the rails_semantic_logger gem that overrides the Rails logger with itself. There are a lot of configuration options, where you can sort log levels, tags, log format, and much more. For example:

config.log_level = :info

# Send to Elasticsearch
SemanticLogger.add_appender(
  appender: :elasticsearch,
  url:      ‘https://localhost:9200’
)

config.log_tags = {
  #  key_name: :value,
  #  key_name:       -> request { request.object[‘value’] }
 }

Logging to external services

With all the above options you will still need to parse, process and understand your logs somehow, and numerous open source and commercial services can help you do this (open your favorite search engine and you’ll find lots), I’ll highlight those that support Ruby well.

If you’re a fluentd user, then there’s a Ruby gem that offers different ways to send your log data. If you’re a Kibana user, then Elastic offers a gem that integrates with the whole ELK stack.

Papertrail has a gem that extends the default logger to send logs to their remote endpoint. They haven’t updated it in a while, but it still their official solution, so should work, and if it doesn’t they offer an alternative method.

Loggly uses lograge and some custom configuration to send logs data to their service.

And for any Airbrake users, the company also offers a gem for direct integration into their service.

There are also a handful of gems that send the default ruby logs to syslog, which then enables you to send your logging data to a large amount of external open source and commercial logging services.

And of course, Coralogix’ own package allows you to create different loggers, assign a log level to them and other useful metadata. In addition to all standard logging features, such as flexible log querying, email alerts, centralized live tail, and a fully hosted Kibana, Coralogix provides machine learning powered anomaly detection in the context of software builds.

Another benefit is that Coralogix is the only solution which offers straightforward pricing, all packages include all features.

First, create an initializer in initializers/coralogix.rb with your account details, set a default class and extend the default Rails logger:

require ‘coralogix_logger’
PRIVATE_KEY = “<PRIVATE_KEY>”
APP_NAME = “Ruby Rails Tester”
SUB_SYSTEM = “Ruby Rails Tester Sub System”

*Private key is received upon registration, **Application name separates environments, ***Subsystem name separates components.

Coralogix::CoralogixLogger.configure(PRIVATE_KEY, APP_NAME, SUB_SYSTEM)
Rails.application.config.coralogix_logger =
Coralogix::CoralogixLogger.get_logger(“feed-service”)
Rails.logger.extend(ActiveSupport::Logger.broadcast(Rails.application.config.coralogix_logger))

And then in each class, we recommend you get an instance of the logger in each class and set the logger name to the class name, which Coralogix will use as the category. The log() method offers options to tailor the logging precision, but the severity and message are mandatory:

logger = Coralogix::CoralogixLogger.get_logger(“Posts Controller”)
logger.log(Coralogix::Severity::VERBOSE, “Post created #{post.inspect})

You can also use severity methods if you prefer, where only the message is mandatory, but other options are available:

logger.verbose(“Post created #{post.inspect})

And there you have it:

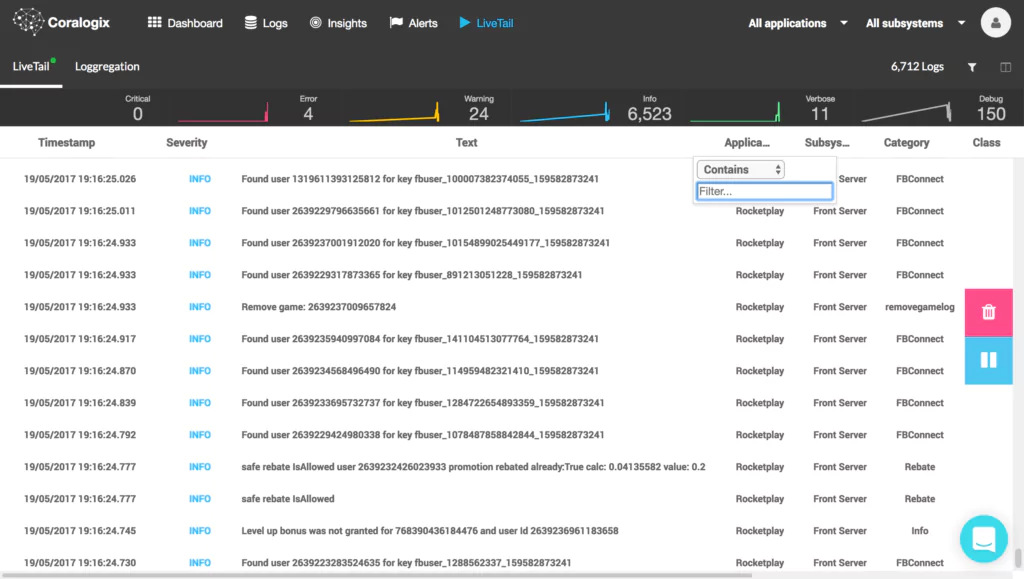
Coralogix logs stream

Know your Code

Whilst Ruby and Rails lack the ‘cool factor’ they had in the past, depending on where you look it still claims the 5th most used language (it peaked at 4th place in 2013 anyway), 12th place in the IEEE spectrum and 4th place on GitHub. It’s still a relevant, and widely used language, especially on certain platforms, such as web backends and Heroku. This means your code should be as optimized as possible. And of course, your Ruby logging/Rails logging should be as organized as possible. I hope this post will help you track down the source of potential problems in the future.

Game of Logs: delivery assurance is coming

Long gone are the days were software companies released a version every six months, after rigorous planning, testing and stress runs (AKA the waterfall model). Today, agile companies release versions on a daily basis, to numerous servers, deployed on the cloud. Their software is composed out of many open source technologies and often supports a large customer base which keeps growing and challenging the production.

Game of logs - delivery assurance

The main challenge of today’s agile software companies is to maintain a high level of quality to their application, despite the fact that they continuously add new code to their production which most often than not will not be tested on a live stream of data.

One of the best ways to understand what your production is doing is the application logs that your software emits, due to that reason, many companies arose to the challenge and offered a log monitoring service which allow companies to sift through their log entries and investigate problems.

The real problem begins when you have dozens of servers emitting millions of records, from different data sources. Sure, you’ll be able to view, search and query the data, but what should you search for? How can you be alerted on problems you never thought about? How can you view millions of logs in the limited time you have? Your code and logs are changing constantly, your production deals with an ever changing work load and the app logic is getting ever more complexed.

We already concluded that an old fashion QA will not help with the above case; too many tests to define, too many code changes, too many live servers, too many logs to sift through and so little time. To deal with this problem, one needs to approach the issue in a whole different mindset, we at Coralogix defined this mindset as Delivery Assurance – DA.

Delivery Assurance

‘Delivery assurance’ is a concept which incorporates the entire application delivery lifecycle, including the Build cycles, continuous integration, version release and production monitoring. The concept mandates that all the building blocks of the application’s lifecycle send event data to a centralized hub, once the data is collected, the hub is required to learn the normal behavior of the application delivery lifecycle, and alert when something goes out of bounds.

The described Hub is exactly what we at Coralogix are striving to build: A service which taps into various data sources, whether it’s log data, pipeline events, configuration management events, or APM insights, and automatically understands the application’s baseline.

That way, Coralogix can provide automatic insights in the context of versions or other external events without the need to define any rules or static thresholds.

Moreover, Coralogix helps companies understand their version’s health immediately after they were released and compare any two versions or points of time in order to find discrepancies between them.

To summarize; Today’s agile software world is filled with new and exciting technologies, but it comes with a price, this price is an ever growing complexity of systems and amount of data, one needs to change his mind set in order to truly deliver quality products to their customers, we believe that ‘Delivery Assurance’ is that change in mindset.

 For a 30 day trial, no credit card needed.

Quick Tips for Heroku Logging with Coralogix

TL;DR: Coralogix released a new addon for Heroku: https://elements.heroku.com/addons/coralogix. In this post we cover best Logging practices, how different cloud providers enable them, what makes Heroku logging special, and how Coralogix utilizes Heroku’s approach to provide it’s 3rd generation logging experience. 

Lost in the Clouds

Widespread cloud hosting opened a world of possibilities for developers, reducing the need to maintain, monitor and scale their own infrastructure, and instead focus on building their applications. When cloud services are working the way you expect, then the ability to not have to worry about what is happening behind the scenes is a liberating one, but alongside this also gives your lack of control and when you experience a problem (and you will), tracing its source can be a challenge. A typical source of information is your log files, but as infrastructure, locations and services constantly shift around the World, where do you look, how do you access them and what should you log that’s relevant to such a setup? In this post, I will mainly focus on Heroku, and compare it’s very different way of handling logging to most other cloud providers.

Logging Best Practices

Even with fully cloud-based applications, most normal rules of logging apply, and following them will make tracing issues in your application easier to identify. Read “The Most Important Things to Log in Your Application Software” and “JAVA logging – how to do it right” for more details, but in summary, these rules are:

  • Enable logging: This sounds like an obvious rule in an article about logging, but double check you have enabled logging before deploying your application and don’t solely rely on your infrastructure logging.
  • Categorize your logs: Especially in a distributed system, the ability to filter logs to particular categories, or error levels such as authorization, access, or critical can help you drill down into a barrage of information.
  • Logs are not only for you: Your logs are useful sources of information for a variety of stakeholders including support and QA engineers, and new programmers on your team. Keep them readable, understandable and clear as to their purpose.
  • Use 3rd party systems: There are dozens and dozens of 3rd party logging tools to help you consolidate and understand your logs better. From open source to SaaS options, you will find a solution that suits your needs.
  • Use standard logging libraries: whether you are writing to file or using a log aggregator, always prefer a standard logging library over doing your own log printing, we ofter see mistakes like using console.log which causes break-lines to be read as separate lines, etc. There are many great logging libraries out there for most languages, prefer them over implementing your own logging. 

Amazon Web Services

In true Amazon fashion, AWS has its own custom solution for logging that integrates well with all aspects of its service but requires learning new tools and processes. CloudWatch Logs aggregates real-time and streamed logs from various AWS services into one convenient location, and adds alerting to CloudTrail based on defined conditions and events. CloudWatch has integrations with about a dozen 3rd party partner services including Splunk and DataDog, but if your provider of choice isn’t on that list then you have to rely on CloudWatch or parse the logs yourself from an S3 bucket.

Microsoft Azure

Azure’s logging offering is comprehensive, offering logging at most levels of the technology stack, in a self-contained monitoring UI. Azure then allows you to take this a step further with log analytics and for larger teams, the Operations Management Suite expands log analytics into an entire operations suite.

Google Compute Engine

Google Compute Engine offers Stackdriver that’s based on the open source fluentd logging layer. If you’re a GCE user, then it’s your best option, with direct connections to Google’s storage and analysis products. Intriguingly it also works with AWS (but not Azure), making it an ideal candidate, if your application runs across multiple clouds (and it should). Stackdriver receives log entries from multiple sources across the GCE stack, including VMs and applications. You can analyze your logs via a semi-searchable GUI, an API, or CLI tool.

Heroku

Heroku takes a different approach to cloud-based application development, shifting the focus from infrastructure to applications. Combined with Heroku’s tools for Docker, Git and CLI workflows, it makes developing applications for testing and production a breeze. However, the ephemeral nature of Heroku makes knowing what’s going on behind the scenes of your application something of a mystery at times.

By default logging consists of using the subcommand heroku logs to view output, and with a variety of parameters to filter the source or dyno (Heroku parlance for an instance), but once you add multiple dynos (which you invariably will as you scale) getting to grips with what’s going on in your logs can be difficult. Filtering the log output is a start, but you need to know where to look before you start looking, and generally, you resort to logs because you’re unsure what the problem is.

To aid the process Heroku offers the ‘Log Drains’ feature to forward raw log output to 3rd party providers, or providers of your own creation. This makes initial log usage harder, but by removing an official logging solution, offer far more flexibility over your specific needs in the longer term.

Coralogix and Heroku

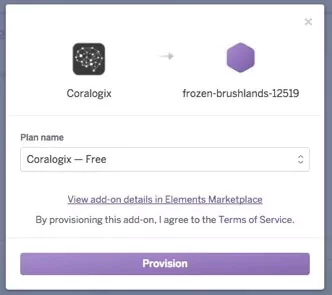
Coralogix has recently released a logging add-on that forwards all Heroku output to a Coralogix account you specify.

provision coralogix on heroku

Or use the CLI with:

heroku addons:create coralogix:test
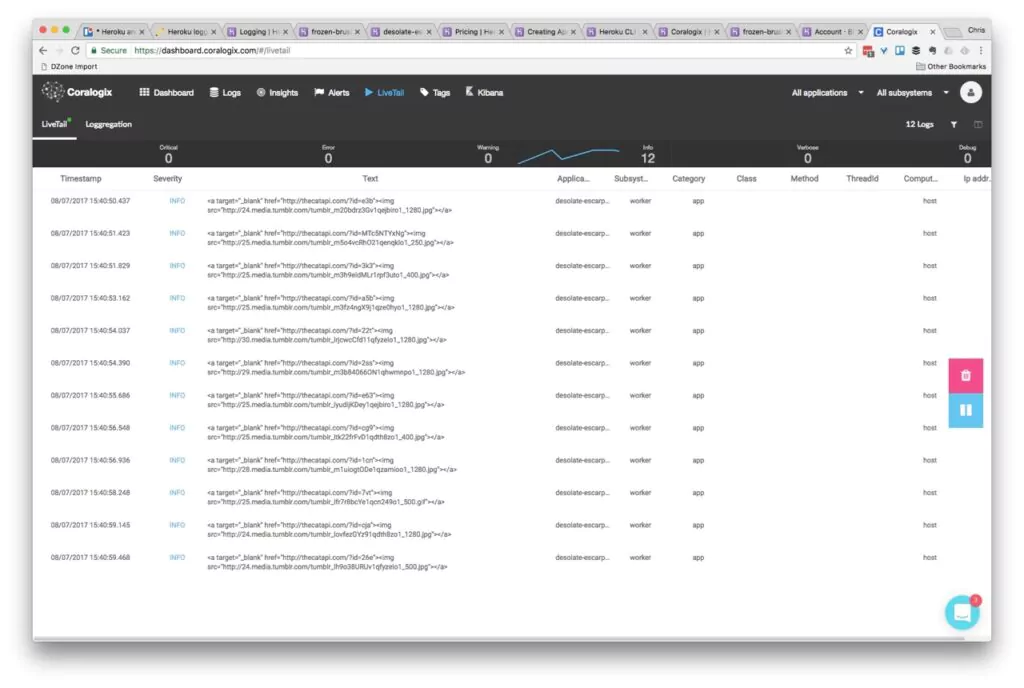
Then within a few seconds, any logs that your application generates will feed right into Coralogix, ready for use the high scale, high-speed search and analytics that Coralogix offers. Here’s a simple example, that shows that even with a small application generating simple log records, as soon it starts scaling, logs become hard to traverse and understand.

Sample Application

The sample application consists of a Python and Ruby application that randomly generates a cat from the Cat API every 2 seconds and logs the value.

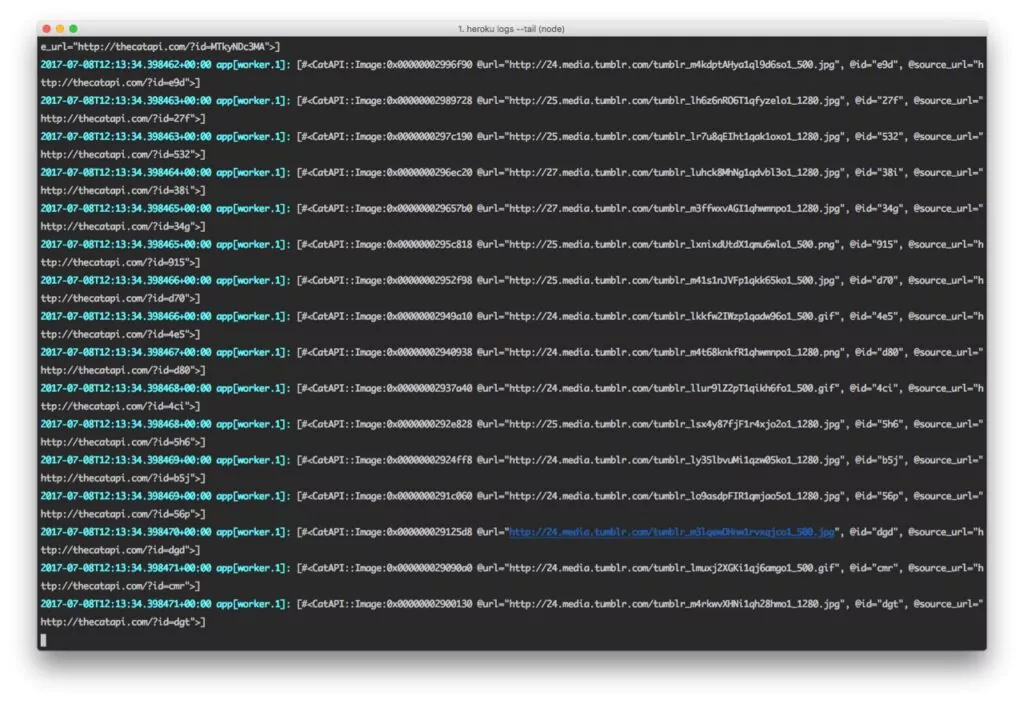
I started with one instance of each, then scaled to three instances, here are the logs using heroku logs one one instance.

one worker sending logs to coralogix

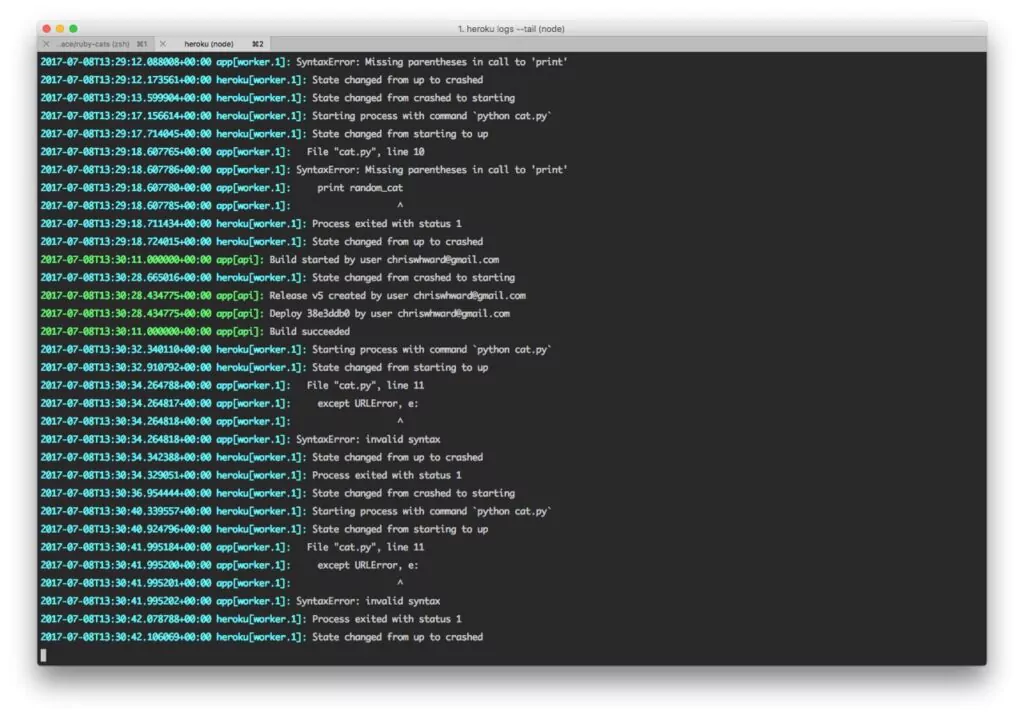
And another example of mixed logs with messages from Heroku, debug messages and errors, already getting confusing.

two workers sending logs to Coralogix

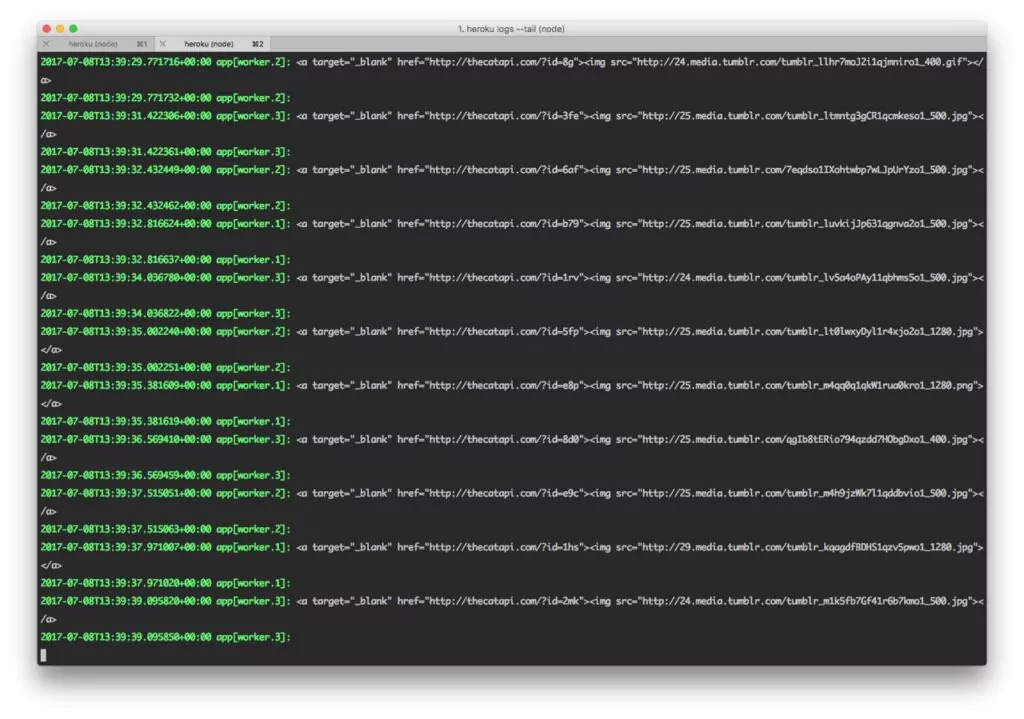
Throw in two more workers and tracking down the source of messages is getting even more confusing. And the sample application has two applications running three workers each.

multiple workers on Coralogix

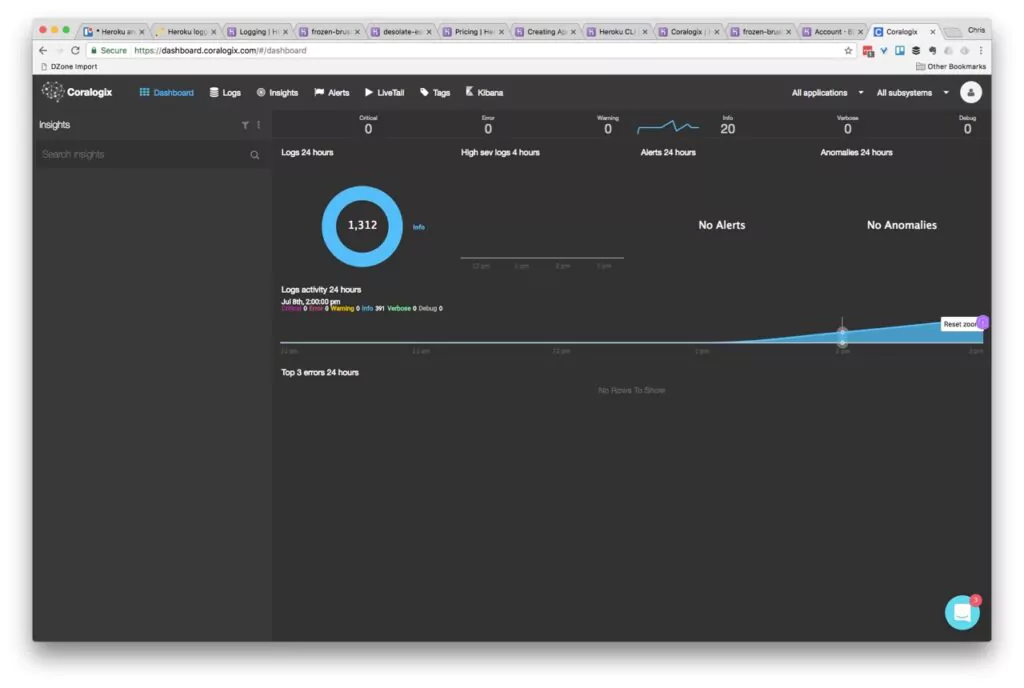
Let’s use Coralogix instead. You can open the dashboard page, or again use the CLI and see the initial display right after you start sending logs:

CLI: heroku addons:open coralogix

coralogix dashboard

view heroku logs in coralogix

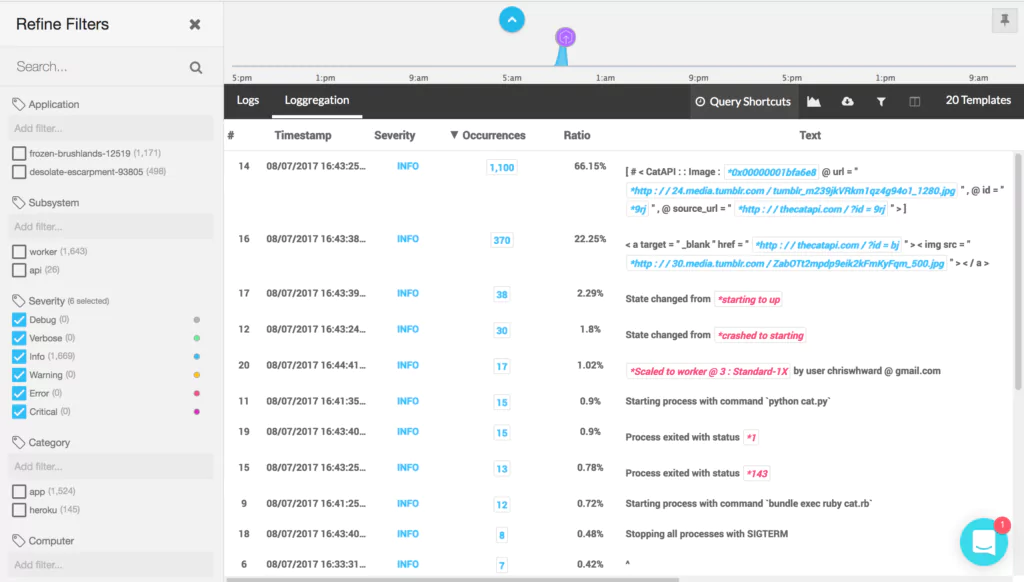
After 24 hours, Coralogix’ Loggregation feature will kick in to automatically cluster log entries and make finding what you need faster and easier. In the screenshot below you can see that Loggregation has identified that despite being ‘random’, the CatAPI repeats itself a lot, outputting the same value over 1,000 times. In this case, it’s not important, but in a mission critical application, this helps you identify patterns clearly.

loggregation on heroku logs

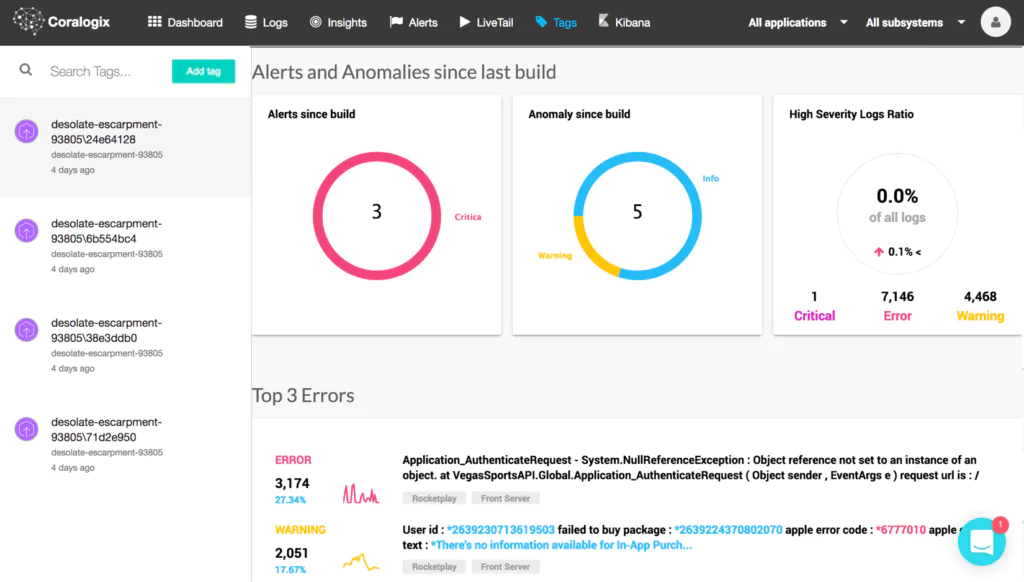
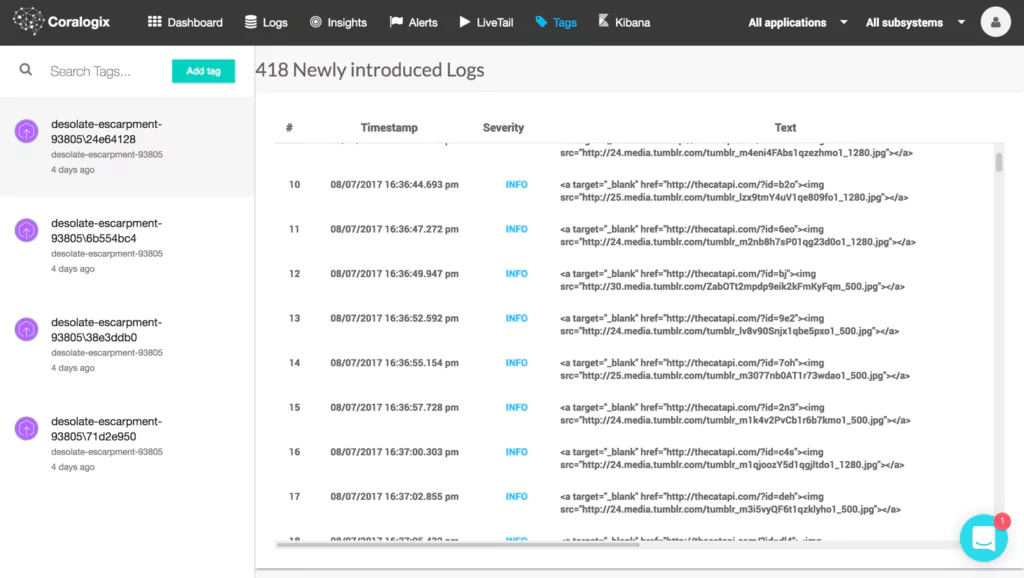
Errors and broken flows are often introduced by new versions and builds of an application. Coralogix’s integration with Heroku includes an integration to Heroku Pipelines and offers an automatic status for new Heroku builds (or tags). Coralogix presents the suspicious and common errors introduced since that build as well as the alerts and anomalies which might be related to the new version release, thus allowing you to pinpoint issues to particular versions and points in time.

Heroku builds status coralogix

new logs created since heroku build

After 5 days of learning, Coralogix will start to send a daily report highlighting new anomalies (errors and critical messages), further helping you identify new errors, and not constantly bombard you with logging noise.

In addition to the machine learning aspect, Coralogix offers the entire set of Logging capabilities, including Log Query, a centralized live tail, user defined alerts to email or slack, and a fully hosted Kibana for data slicing and dashboards creation.

Making Logging Personal

I started this post by highlighting best practices for logging, and many of them focus on making logs work for you and your team. By compelling you to use their own internal solutions, many of the cloud providers can make your logging experience impersonal and unfocused. Whilst logging with Heroku can take extra steps, to begin with, when you get the setup honed, it can result in a logging system that truly works the way you want and helps you see the issues that matter.

Provision the Coralogix addon and start enjoying 3rd generation Log analytics

Papertrail alternatives – why you should check them

What Is Papertrail?

Papertrail describes itself as “frustration-free log management.” This characterization is relatively accurate, as its platform focuses on helping users manage their own logs, rather than intelligently analyzing and monitoring logs on its own. But a close look at Papertrail’s reviews reveals that although its clients find much to admire about the product, it lags behind competitors in a few key areas. So should you look for Papertrail alternatives? 

Notable Attributes

Installation and Integration: Papertrail boasts an impressively speedy 45-second setup, and its ease of installation receives consistent praise from its clients.

Log Aggregation: Aggregates logs from a range of frameworks, including Syslog, Ruby on Rails, MySQL, etc.

Log Search: Its standout feature filters logs based on a keyword and automatically saves searches for later reference.

Notable Deficiencies

Manual Searching, Not Machine Learning: Though a strong query function is praiseworthy, hunting down errors and anomalies manually is not the most productive use of developers’ time. Some Papertrail clients lament that the system lacks the machine learning capabilities needed to independently adapt to a system’s log sequences, and automatically identify flow and error anomalies as they occur.

Relying exclusively on manual queries presumes that Papertrail’s clients know what exactly they should look for, and in which time period they should be looking. This is fine for managing user-reported errors or familiar, recurring events. But what about entirely new, unpredictable bugs and one-time security exploits? Without some degree of AI assistance, the devs will be left hoping for a Twin Peaks-esque dream revelation to guide them to the right place.

What’s more, users are quick to point out that the search feature is infrequently updated, and could be improved with more expansive functionality. The platform retrieves specific log data in a search but does not allow for navigation to the adjacent data that came before and after in the log. The search function also does not permit the search of logs from specific devices.

Data Limits: Papertrail caps monthly log data, depending on your payment plan. Although this tiered payment/data structure is fairly standard, Papertrail customers complain that the moment that data threshold is crossed, the platform simply stops collecting new entries, rather than removing old logs to make way for the new. This can be highly problematic, particularly if the new, would-be logs reveal security anomalies or if your company relies on its logs to resolve user-reported failures. Devs might struggle to address a customer’s complaint with a log system that was blacked out during the issue’s occurrence.

Scaling and Price Point: As your business grows, you can pay Papertrail more per month for your log aggregation to grow proportionally. But reports indicate that Papertrail’s search function struggles to keep up with larger amounts of data and that it gets slower and slower as the number of log entries increases. This can seriously slow down productivity unless you plan to stay a small startup forever.

And on that note, given its relatively limited set of features, Papertrail’s steep price point might raise some eyebrows. For those exploring logging tools for the first time, 4GBs of data per month might seem like enough. But even smaller organizations can end up dealing with over 1GB of logs per day. To keep up with that, you would need to pay nearly double the rate charged by some competitors, namely Coralogix.

How Does It Compare?

In a nutshell, Papertrail succeeds as a platform for small businesses that primarily need log aggregation and a manual search function. It’s not suitable for those looking for a system with more modern, machine learning-based analytical capabilities. It could also underwhelm businesses that expect rapid or even gradual growth, and that seek affordable Papertrail alternatives to grow with.

Coralogix carves out its niche in the log analysis world by going a step beyond mere log aggregation and search. Its algorithms define ‘log analysis’ in the true sense of the term, automating the process and saving businesses an enormous amount of time that they would otherwise spend manually hunting for log anomalies. All of this is provided at the most competitive price point on the market.

Interested in learning more about Coralogix’s innovative features? Check out these quick video tutorials, and get a visual sense of what distinguishes this brand of cutting-edge log analytics.

Why Are we Analyzing Only 1% of Our Logs?

Here at Coralogix, one of the main goals we have is what we call “Make Big Data small” the idea is to allow our users to view a narrow set log patterns instead of just indexing terabytes of data and providing textual search capabilities.

Why?

Because as cloud computing and open source lowered the bar for companies to create distributed systems at high scale, the amount of data they have to deal with are overwhelming to them.

What most companies do is to collect all their log data and index it, but they have no idea of what to search, where to search and most of all, when to search.

To examine our assumption we did a little research on the data we have from 50 customers who are generating over 2TB of log data on a daily basis. The disturbing lessons we’ve learned are below.  

One definition I have to make before we start is “Log Template”.

What we call a log template is basically similar to the printf you have in your code, which means it contains the log words split to constants and variables.

For instance if I have these 3 log entries:

  • User Ariel logged in at 13:24:45 from IP 1.1.1.1
  • User James logged in at 12:44:12 from IP 2.2.2.2
  • User John logged in at 09:55:27 from IP 3.3.3.3

Then the template for these entries would be:

  • User * logged in at * from *

And I can say that this template arrived 3 times.

Now that we are on the same page, here’s what we’ve learned from clustering daily Terabytes of log data for over 50 customers :

1) 70% of the log data is generated by just 5 different log templates. This demonstrates how our software usually has one main flow which is frequently used while other features and capabilities are rarely in use. So we kept going and found out that 95%(!) of your log data is generated by 10 templates, meaning you are basically analyzing the same log records over and over not even knowing 99% of your log data.

2) To support fact #1, we found out that over 90% of the queries ran by users are on the top 5 templates. These statistics show us how we are so blinded by these templates dominance we simply ignore other events.

3) 97% of your exceptions are generated by less than 3% of the exceptions you have in your code. You know these “known errors” that always arrive? they are creating so much noise that we fail to see the real errors in our systems.

4) 0.7% of your templates are of level Error and Critical, and they generate 0.025% of your traffic. This demonstrates just how easy it is to miss these errors, not to mention that most of them are generated by the same exceptions.

5) Templates that arrive less than 10 times a day are almost never queried (1 query every 20 days in average by all 50 customers together!). This is an amazing detail that shows how companies keep missing those rare events and only encounter them once they become a widespread problem.

Conclusions

The facts above show how our current approach towards logging is very much affected by the log variance and not from our perspective. We react to our data instead of proactively analyzing it according to our needs because the masses of data are so overwhelming we can’t see past them.

By automatically clustering log data back to its original structure, we allow our users to view all of their log data in a fast and simple way and quickly identify suspicious events that they might ignore otherwise.

Learn more about Coralogix Loggregation & Flow anomaly detection and how it can help you detect and solve your production problems faster.