What Is GitOps? Principles, Benefits, and How It Works

With GitOps, you can roll back your cluster with git revert and explain each approved change through a commit log. Routing normal changes through Git and running an in-cluster agent that detects drift from the repository gives infrastructure changes the same review and rollback discipline as application code, and Git preserves their history.

This guide covers the four GitOps principles, the pull-based reconciliation workflow, and the tools and practices you need to get started.

What Is GitOps?

The term GitOps blends “Git” and “operations,” and it names an operational model where a Git repository holds the declarative desired state of your infrastructure and applications while an agent running inside the target environment continuously pulls that state and applies it.

Git acts as the single source of truth, which means any change missing from the repository stays outside the approved cluster state.

Teams often describe their setup with the phrase “we keep our config in Git,” which usually points to a continuous integration and continuous delivery (CI/CD) pipeline that reads from a repository without the agent that handles the reconciliation work.

Weaveworks coined the term in a 2017 post that described GitOps as using developer tooling to drive operations. Storing manifests in Git leaves a gap between the desired state in source control and the current state in the live system, and closing that gap is what the agent exists to do. After Weaveworks closed in 2024, stewardship of the definition passed to the Cloud Native Computing Foundation (CNCF) OpenGitOps working group.

The Four GitOps Principles

The OpenGitOps working group operates under the CNCF App Delivery Special Interest Group and published the principles as OpenGitOps v1.0.0. The group produced them with 34 co-authors and input from more than 60 companies, with founding members including Amazon, Azure, GitHub, Red Hat, and Weaveworks.

The four principles fall into two halves. The first half covers how you describe and store the desired state, which the Declarative and Versioned and Immutable principles address through your repository and its commit history. The second half covers how that state reaches the cluster and stays there, which the Pulled Automatically and Continuously Reconciled principles address through the in-cluster agent.

Storing configuration in a repository satisfies the first two principles, and running an agent that watches and applies that state satisfies the other two.

Declarative

To manage a system with GitOps, you must express its desired state declaratively. You describe what should exist, a Deployment with three replicas, and the tooling works out how to get there.

An imperative kubectl scale deployment checkout --replicas=5 changes the cluster but leaves no artifact a controller can compare against later; a manifest with replicas: 5 does. Kubernetes manifests, Helm charts, Kustomize overlays, Terraform files, and other declarative formats all qualify.

Versioned and Immutable

Principle two requires a state store that enforces immutability and versioning and retains a complete version history. In Git, each desired-state commit records its author and timestamp. The diff captures the change, while your pull request policy can add a reviewer and approval record.

git revert handles rollback: you revert the commit, and the agent applies the previous known-good state at its next reconciliation. The v1.0.0 glossary calls the repository a “state store” and notes that Git is the canonical example, but teams can use any other system that meets these criteria.

Pulled Automatically

Principle three requires software agents to pull the desired state declarations from the source automatically. Argo CD and Flux are the two CNCF graduated reconciliation engines that implement this pattern for Kubernetes, and both run inside the cluster and fetch from the repository, which lets your CI system avoid credentials that can apply cluster changes.

A push-based approach creates a god-mode scenario in which the CI/CD pipeline holds credentials for deployments. With a read-only outbound connection to Git, the agent lets you keep the cluster’s control plane off the public network.

Continuously Reconciled

The fourth principle requires software agents to observe actual system state continuously and attempt to apply the desired state. Reconciliation means ensuring the actual state of a system matches its desired state, and unlike trigger-driven CI/CD, any divergence triggers reconciliation in GitOps.

The agent treats two sources of divergence identically: a new commit changed the desired state, or someone changed the live state. The second case is configuration drift, and the agent reverts a hotfix you apply with kubectl edit at the next cycle unless you also commit the change to Git.

How GitOps Works: The Pull-Based Reconciliation Loop

A GitOps workflow runs on a loop where Git holds the desired state and an in-cluster agent works to make the live cluster match it. Every change follows the same path from a pull request to a merge commit to a reconciliation cycle, which is what turns a repository into the deployment interface for the cluster.

Say you open a pull request that bumps the checkout service’s image tag from v2.0 to v2.1 in a Kustomize overlay. A reviewer approves it, the pull request merges, and the repository now describes a state the cluster doesn’t yet have. The in-cluster operator notices the gap on its next poll, applies the diff, and reports the application as synced.

The same loop covers two situations that look different on the surface but resolve the same way. A new merge commit changes the desired state, and the agent brings the cluster forward to match. Someone runs kubectl edit against the live cluster, and the agent treats that as drift from the repository and reverts it at the next interval. Flux, one of the two reconciliation engines introduced earlier, applies this behavior to any kubectl edit/patch/delete change unless you suspend reconciliation or push the change to Git.

Pull-Based vs. Push-Based Deployment

Push-based deployment is the pre-GitOps default. A CI job authenticates to the cluster and runs kubectl apply or helm upgrade when the pipeline fires.

By itself, that model does not continuously detect deviations between the cluster and the repository between runs. It also requires the CI system to hold cluster credentials, which is the exposure the pull model removes from CI.

Multi-environment promotion works in either model, though you can model environments as directories rather than branches so that promotion becomes a file copy from envs/staging to envs/prod.

Both engines support this pattern, and Flux serves as the example here because its dependency and health-check primitives make gated promotion the most direct to configure. With Flux, you can merge an infrastructure change to staging first and promote it to production only after the cluster reconciles and passes conformance tests. Argo CD reaches the same outcome through sync waves, hooks, or its ApplicationSet controller, which coordinate the promotion across environments rather than gating it inline.

GitOps vs. DevOps: Key Differences

DevOps and GitOps sit at different levels of the delivery stack, which is why teams often adopt them together rather than choosing between them. DevOps describes the cultural and organizational shift that gets development and operations teams working from shared goals, while GitOps is a specific continuous delivery technique that runs inside that culture.

Adopting GitOps changes how the deployment step actually executes by making Git the control plane and handing continuous deployment to an in-cluster agent. It fits as one implementation choice within a broader DevOps practice.

GitOps and infrastructure as code (IaC) overlap on the declarative front but differ in scope. IaC defines desired state in files, and a workflow that stops at terraform apply still requires you or your automation to run another plan whenever you need to check for drift. Argo CD works as a two-way reconciliation engine that stays aware of changes at the destination and closes that gap by watching the live state on an interval, whereas one-way IaC automation only fires when the source changes.

Key Benefits of GitOps

The benefits follow from the four principles rather than from any particular tool. Your pull request creates a review path for infrastructure changes, while continuous reconciliation keeps checking whether the live state matches the approved state:

  • Shorter deployment cycles and recovery times: Your pull request becomes the deployment unit, so shipping a change follows the same review path as a code change. Continuous reconciliation can also shorten mean time to repair (MTTR) by making rollback a version-controlled action.
  • Rollbacks without a runbook: git revert restores the last known-good state and the agent applies it.
  • Stronger security: With a pull-based setup, no cluster credentials need to sit in CI, and the operator’s kubectl apply permissions limit what a compromised Git repository can change.
  • Audit and compliance: The Git log records the approved desired-state history for the environment, though it does not capture every transient live-state mutation. Your auditor can trace an approved ingress timeout change to a commit hash rather than a Slack thread.
  • Reduced configuration drift: Continuous reconciliation reverts one-off kubectl fixes, which forces every lasting fix into Git or out of the cluster. Teams that skip continuous reconciliation and automatic rollback also skip this benefit.
  • Self-documenting operations: The repository is the current answer to “what is running in production.”

These benefits turn your repository into a versioned record of every approved change and give the cluster a continuously enforced desired state. Git holds what your team agreed to run, and the agent keeps checking the live environment against that record so approvals and reality stay in step.

GitOps Tools

The tooling splits into three layers, and only the first is GitOps-specific. Argo CD and Flux provide the reconciliation layer. Both engines are CNCF graduated projects:

  • Argo CD: Argo CD watches one or more repositories, compares rendered manifests with live cluster state, marks applications OutOfSync when they differ, and syncs automatically or on approval.
  • Flux: Flux uses a set of controllers, the flux command-line interface (CLI), and Git; it reconciles GitRepository, Kustomization, and HelmRelease resources and manages its own installation from Git.
  • Configuration tools: Helm templates charts and Kustomize patches base manifests with per-environment overlays, and their rendered output is what the engine applies. A kustomize edit set image command in a CI step is the typical way a new build enters the repository.
  • Git hosting: GitHub, GitLab, or any standard Git host works, since the engines need repository access, any required credentials, and optionally a webhook endpoint for faster notifications.

These layers separate reconciliation from manifest rendering and repository hosting. The two engines differ on defaults more than on model.

The table below compares their default reconciliation intervals, drift correction behavior, interfaces, and self-management approaches. Which interface and reconciliation settings you prefer will usually drive the choice.

Argo CDFlux
Default reconcile intervaltimeout.reconciliation controls polling, with jitter affecting the timingKustomization runs every five minutes, and .spec.interval sets the interval
Drift correction defaultYou opt in with selfHeal: true, prune: trueFlux reverts drift without extra configuration
InterfaceWeb interfaceflux CLI and Git
Self-managementYou install it from a pinned manifestFlux manages its own installation via flux bootstrap

How to Get Started with GitOps

Getting a GitOps pipeline into a working state on Kubernetes takes a handful of concrete steps, and each one maps to a decision the engines expect you to have made before they can reconcile anything.

The sequence below moves from the underlying platform to a single running application, and then to the growth patterns that keep the pipeline manageable as more teams and clusters come online:

  1. Provision a Kubernetes cluster and a Git repository for manifests. You may keep the manifest repository separate from application source so that config changes flow through their own review path.
  2. Install one of the two reconciliation engines in the cluster. Argo CD installs into its own namespace from the published manifest, and you should consider pinning a version for production. The Flux bootstrap installation commits Flux’s own manifests to your repository so every later change, including Flux upgrades, goes through a Git push.
  3. Point the engine at a directory holding one application and turn on automated sync. This gives you a full end-to-end loop against a small surface area before you widen the scope.
  4. Move to a directory-per-environment layout once the single-application setup is stable. Promotion between environments then becomes a file copy from envs/staging to envs/prod under the same review process.
  5. Adopt Argo CD’s ApplicationSet controller or Flux’s multi-tenancy configuration when several teams or clusters share the pipeline. Both patterns let you template application definitions across environments and tenants without duplicating manifests.

Readiness for any of this comes back to Principle one. If you still apply anything by hand or by script, you have to convert it to declarative state before the engine has something to reconcile against.

GitOps pipelines manage what you deploy, and Coralogix covers how it behaves and watches post-deploy telemetry data for drift-related regressions across logs, metrics, and traces. That lets you manage desired state and runtime behavior through complementary workflows.

GitOps Tracks What Deployed; Telemetry Shows How It Ran

A healthy status in Argo CD means the resources exist and report readiness, which is a narrower claim than most teams read into it. Successful responses from the checkout path require separate runtime verification, and a bad change can auto-sync to production while every health check passes. Closing that gap means correlating deploy commits with telemetry data, and the OpenTelemetry (OTel) CI/CD conventions include a commit revision attribute for tagging telemetry with the commit that shipped it.

Once telemetry carries the commit that shipped it, an observability layer can turn a live regression back into a specific change in Git.

Olly, Coralogix’s autonomous observability agent, cross-references live system behavior with the code changes in Git and runs root cause analysis down to the line that caused the regression. Pairing a GitOps pipeline with Kubernetes monitoring lets you tell a bad deploy from a bad reconciliation, then line up latency spikes with nearby pipeline events and Git activity such as commits or pushes. Deployment markers add context when your pipeline sends those events to Coralogix.

Start a free 14-day Coralogix trial and point it at a GitOps-managed cluster to see the same commit hash that Argo CD or Flux synced show up alongside the logs, metrics, and traces from the workloads it deployed.
Frequently Asked Questions About GitOps

What is the difference between GitOps and Jenkins?

Jenkins is a continuous integration tool that builds, tests, and publishes artifacts; in a push-based pipeline it also runs the deploy step against the cluster. GitOps moves that step inside. Jenkins commits the new image tag to the config repository, and Argo CD or Flux syncs it.

What are the four principles of GitOps?

The four principles are Declarative, Versioned and Immutable, Pulled Automatically, and Continuously Reconciled. A pipeline that stores manifests in Git and never watches the cluster meets half the definition.

Does GitOps only work with Kubernetes?

GitOps also works outside Kubernetes. Its principles apply to any infrastructure that you can observe and describe declaratively. Non-Kubernetes targets can rely on the Tofu Controller for Terraform or Crossplane for cloud resources, both of which still run inside a Kubernetes cluster.

What is Argo CD and how does it relate to GitOps?

Argo CD is a CNCF graduated continuous delivery tool that implements pull-based GitOps for Kubernetes: it watches a repository, diffs the desired manifests against live cluster state, and applies the difference. Flux provides the main alternative with the same reconciliation model.

How does GitOps handle secrets?

You should never commit plaintext secrets to Git. Common patterns include encrypting secrets in the repository with Sealed Secrets or another encryption tool, or storing them in an external manager such as HashiCorp Vault and syncing them in with the External Secrets Operator. You should prefer destination-cluster secrets rather than injecting them during manifest generation, since generated manifests sit in plaintext in Argo CD’s Redis cache.
The Data Plane Reality: OTel Scales, While Topology UX Lags

OpenTelemetry won the architectural standards battle. At scale, though, telemetry breaks more like plumbing than code. It breaks quietly, across a graph, with a blast radius you don’t understand until it’s expensive. With over 65% of organizations now running more than 10 collectors in production, hybrid deployments across Kubernetes and VMs are accelerating fast. Telemetry standardization is no longer a project milestone. It is a baseline expectation. (Source: OpenTelemetry Collector Follow-up Survey, Jan 28, 2026)

Crucially, with scale comes a shift in bottlenecks. Growing an observability estate today means introducing specialized data routes, multi-region pipelines, PII redaction rules, tail-sampling criteria, and cost-tier definitions across isolated business units. At that point, your OpenTelemetry configuration has evolved into a distributed data supply chain inheriting every operational problem that comes with one.

The operational paradox

In the OpenTelemetry Collector Follow-up Survey, 61% of respondents rate the experience of building and maintaining collector configurations as complex or neutral. This means that the majority of the industry is operating a critical data plane without adequate authoring infrastructure. They need a structural map, so teams don’t fall back on tribal knowledge.

This persistent friction point surfaces only after OpenTelemetry is already running in production. When configuration tooling forces engineers to mentally compile their architecture from thousands of lines of flat YAML, configuration management becomes a problem of active risk mitigation.

High-friction operational pains

Managing modern telemetry infrastructure through configuration files is architecturally dangerous. When pipelines expand across signals and regions, engineers must manually compile their entire topology from flat text. There are no maps or guardrails. There is only the file. Specifically, we see four friction points emerge consistently across architectural reviews and post-incident retrospectives with enterprise platform teams running OpenTelemetry at scale.

1. Drift becomes the default

Multi-region collector deployments don’t stay synchronized by default. Platform teams respond with GitOps pipelines, Helm charts, and layered values.yaml overrides. Merging vendor-supplied templates with environment-specific requirements turns every variable change into a manual reconciliation exercise. For instance, in Kubernetes, overriding a single tail-sampling block means patching a Helm chart. In ECS on EC2, it means owning the entire master config. The more signals and environments, the more these templates diverge.

2. Topology is implicit (and authoring is blind)

An OTel collector pipeline is a graph: receivers ingest, processors transform, exporters deliver. Raw YAML encodes that graph as flat text with no structural representation. Traditionally, engineers have traced routing paths and dependency chains across thousands of lines, multiple pipelines, and signals manually. Onboarding morphed into a knowledge transfer problem as the architecture existed only in the minds of whoever wrote the config last.

3. Blast radius is unknowable

A Git diff cannot tell you whether a line change silently broke a routing path, dropped a telemetry stream, or introduced a cardinality dimension. Span metrics misconfigured without schema awareness can generate tens of millions of unique metric dimensions before anyone notices. When that happens, the only available response is force. You must block the entire data stream at the platform level and accept the visibility loss while you debug.

4. Cost controls become guesswork

Tail-sampling processors and regex transforms are the primary levers for cost control and PII scrubbing. Both are completely opaque to tune via raw text. The interdependencies between decision_wait windows, num_traces buffers, and live trace volume have no visual representation. A wrong setting will have the collector fall behind its own queue. When the processor can’t evaluate a trace against its policy within the decision window, it drops the trace with no warning or visibility. In a live incident, those are exactly the traces you needed.

Feedback loop latency and brittle workarounds

The main frustration is that the validation loop is completely decoupled from the authoring loop.

To verify a pipeline change works, an engineer must modify code, commit, deploy to a cluster, restart collector runtimes, then hunt for signals to confirm telemetry is flowing. Every iteration is a multi-step, multi-minute cycle of editing an invisible map with no feedback until the very end. The cognitive burden is on debugging the gap between what you wrote and what the pipeline actually does.

Version control can’t see the graph

Git tracks lines but cannot tell you whether a one-line variable change silently reordered processor execution, broke a routing reference, or dropped a signal entirely. Even with a clean-looking diff, the pipeline is broken.

This is where the bus factor compounds the problem. Because topology lives in engineers’ heads rather than in any structural representation, telemetry expertise is concentrated within a small number of specialists. When they are unavailable, the platform stalls.

How teams cope and why they fail

Rather than solving the underlying visibility problem, platform teams build defensive workarounds that create new ones:

  • Configuration splitting. Breaking master configs into smaller decoupled files feels safer until you need to track a global version upgrade across a dozen fragmented files that have drifted independently.
  • Ad-hoc visualization. Engineers paste production YAML into external open-source visualizers to manually verify routing before deploying. This works until a compliance incident arises, or until the visualization tool disagrees with the actual runtime behavior.
  • Emergency gatekeeping. When a cardinality avalanche or blind authoring error hits production costs, the only available lever is a blunt blocking rule at the platform layer protecting the budget at the expense of visibility

Ultimately, these are less workarounds and more the structural symptoms of a data plane being operated without a control plane.

Elevating OTel Operations Without Lock-In

The industry has reached the shared conclusion that telemetry configuration is a graph problem being solved with a text editor. Some observability vendors use that gap as leverage forcing users to adopt proprietary configuration languages just to get a visual interface.

Replacing open standards like OpenTelemetry to fix the tooling problem just moves the risk from configuration complexity to vendor dependency.

The obvious objection is that visual tooling often comes with a hidden trade: proprietary configuration languages, black-box runtimes, or workflows that don’t survive a GitOps reality. Fixing authoring shouldn’t require replacing OpenTelemetry. It should make the existing graph visible, validatable, and safer to change.

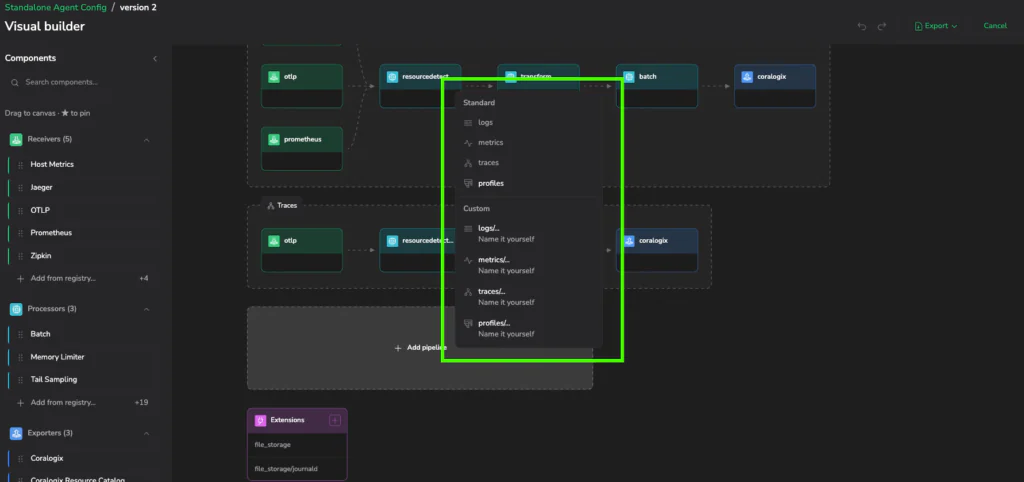
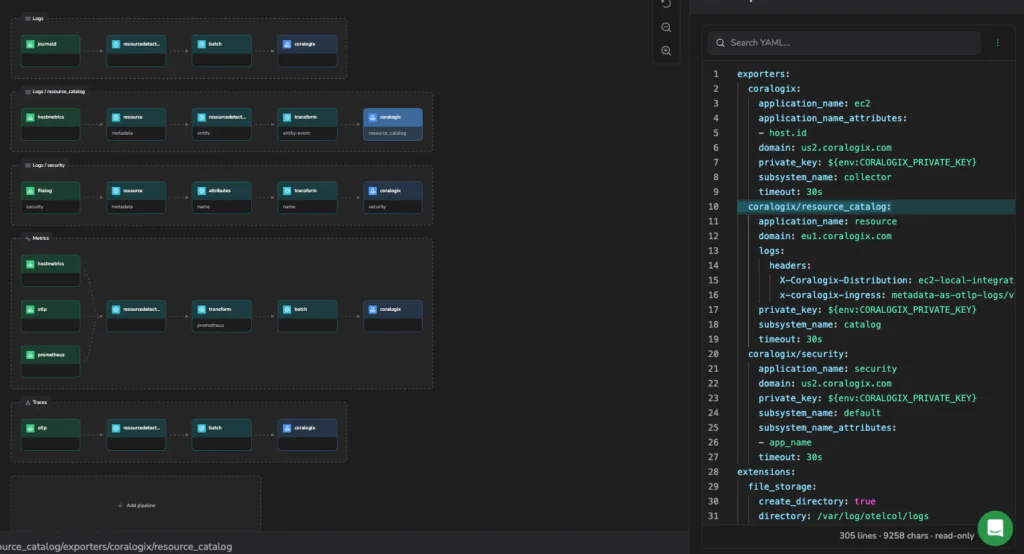
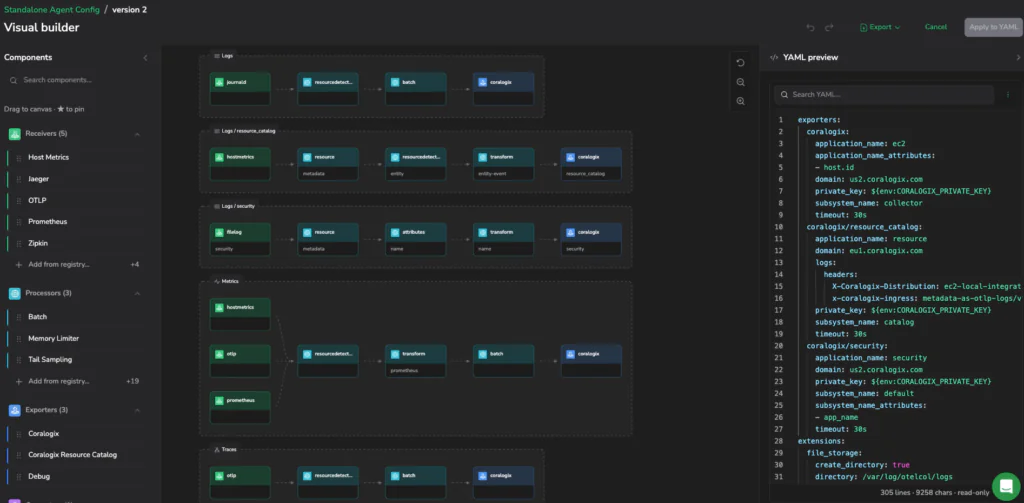
Therefore, the correct move is an intelligent design layer on top of vanilla OpenTelemetry. This layer will make topology a first-class artifact without touching the underlying standard. That’s the architectural principle behind the Coralogix Visual Builder in Fleet Management. It makes the YAML graph visible, validates it before deployment, and compiles back to fully compliant OpenTelemetry collector configuration. This is all with no proprietary runtime, no format lock-in, and no break in the GitOps workflow.

  • Rename a component → references update across the graph automatically
  • Missing exporter / orphaned component → flagged before deploy
  • Tail-sampling policies → schema-aware forms instead of free-text guessing
  • YAML remains first-class → visual edits compile back to vanilla collector YAML

Mechanism Over Magic: What an Observable Design Layer Enables

Each friction point described above has a direct structural answer. We are going beyond feature coverage to offer a one-to-one elimination of the operational risks that accumulate when topology is invisible.

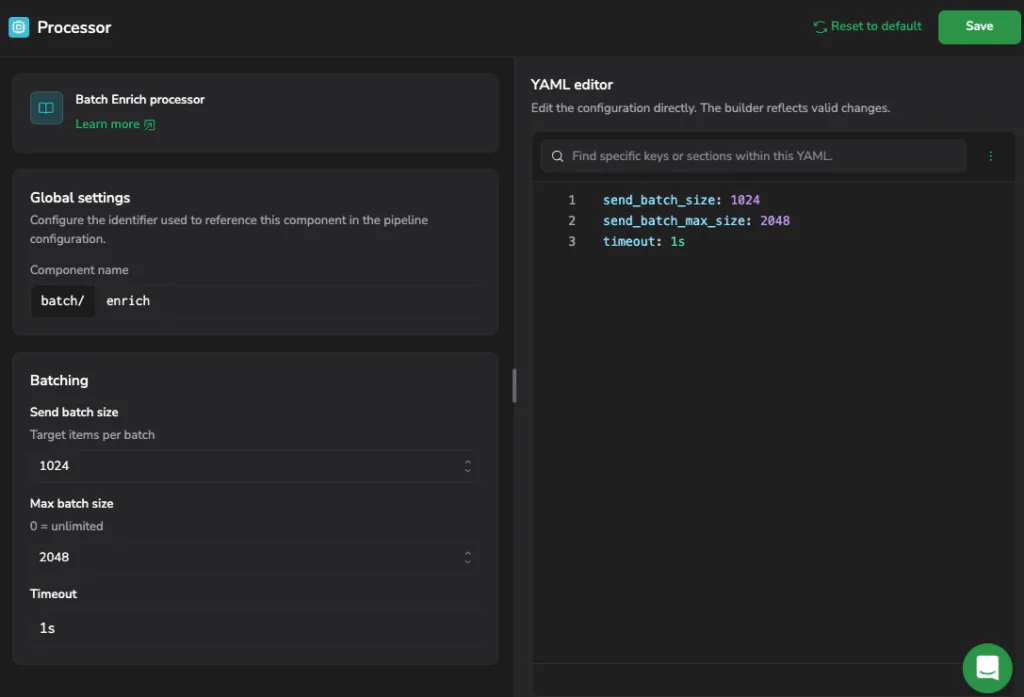
  • Preflight schema validation. The Visual Builder uses upstream OpenTelemetry component schemas aligned to collector releases, so validation matches what you deploy. Configuring a processor or receiver exposes valid schema fields and path parameters inline, inside the canvas. Orphaned components, invalid routes, and missing exporters surface before deployment.
  • Structural safety guardrails. Tail-sampling policies and regex transform blocks are configured through schema-aware forms, not free-text fields. The same class of misconfiguration that silently generates 13 million unique metric dimensions gets caught at authoring time, before it reaches the backend.
  • Automated reference rewriting. Scaling a component across environments means editing suffixes — otlp/app1, otlp/app2 — across every reference in service.pipelines. Miss one and the graph breaks silently. The Visual Builder rewrites every reference automatically on rename, across the entire pipeline graph, including connectors that appear in both receivers and exporters simultaneously.
  • Topology as documentation. Rendering the implicit text graph as an explicit visual map makes architecture immediately legible. A new team member can trace a payment trace flow or a log routing path in minutes rather than excavating YAML. The knowledge is now in the interface, not in someone’s head.

Absolute compliance, with zero lock-in

Skeptical infrastructure teams treat visual configuration tools as abstractions that trade engineering rigor for convenience. The Visual Builder inverts that assumption.

The output is pure, vanilla OpenTelemetry collector YAML. No proprietary runtime. No black-box format. No break in the GitOps loop. An engineer can build a pipeline visually, drop into the YAML pane to hand-edit a field the form doesn’t expose, and apply it back as part of the same workflow.

The moment telemetry pipelines became a distributed infrastructure, they inherited the operational problems of distributed infrastructure. Kubernetes earned a control plane. CI/CD earned deployment gates and rollback primitives. In fact, until now OpenTelemetry pipelines were the exception. They were managed with the same flat-text workflows that worked when a single collector was a novelty. Visualizing topology isn’t a UX improvement. It’s how you make change safe in a distributed telemetry data plane.

Book a demo to see how Visual Builder turns OpenTelemetry collector YAML into a validated, editable topology and ship pipeline changes faster with less risk.

Unlocking Hidden Business Observability with Holistic Data Collection

Why do organizations invest in data observability?

Because it adds value. Sometimes we forget this when we’re building our observability solutions. We get so excited about what we’re tracking that we can lose sight of why we’re tracking it.

Technical metrics reveal how systems react to change. What they don’t give is a picture of how change impacts the broader business goals. The importance of qualitative data in business observability is often overlooked.

Data-driven insights which only include technical or quantitative modeling miss the big picture. Pulling data from holistic sources unlocks the full power of business observability.

Including holistic data collectors in your observability stack grants visibility not just into what’s happening, but why it happened, and the impact it has on your business outside of your systems.

What are Holistic Data Collectors?

Holistic data collectors draw from unusual or uncommon sources. They log information that wouldn’t usually be tracked, enabling businesses to get a holistic view of their systems. A holistic view means observability of all interconnected components.

A data strategy that includes the collection of holistic data empowers effective business observability. By logging as hidden pockets of data much clearer insight can be generated, and data-backed strategic decisions become much better informed.

The list of data sources it is possible to include is potentially limitless. With the proper application of collectors, any communication platform or user service can become a source of data and insight. Holistic data collectors exist for code repositories such as GitHub, collaboration tools like Teams or Slack, and even marketing data aggregators such as Tableau.

When and How to Use Holistic Data Collection

With some creative thinking and technical know-how, almost anything can be a source of holistic data. Common business tools, software, and platforms can be mined for useful data and analysis.

Below are some examples that exemplify and illustrate the usefulness of this approach to data-driven insight.

Microsoft Teams

Microsoft Teams has become a vital communication channel for the modern enterprise. As one of the most popular internal communication platforms on the market, Teams can be an invaluable source of holistic data from within your workforce.

Integrating webhooks into Teams enables you to monitor and track specific activity. Webhooks are a simple HTTP callback, usually in JSON format. They’re one of the simplest ways to connect your systems to an externally hosted channel such as Teams.

Pushing holistic, qualitative Teams data to a third party platform using webhooks enables correlation of non-numeric insight with finance and marketing figures and system metrics. 

As Teams is most often used internally, this is an invaluable asset for understanding how changes to your organization are reflected in the morale of your staff. Many developers use Teams to discuss issues and outages. Having visibility of your IT team’s responses identifies which tasks take the most of their time and what knowledge blindspots exist in their collective technical skillset.

PagerDuty

PagerDuty is transforming the way IT teams deal with incidents. Integrating holistic data collectors greatly expands the level of insight gained from this powerful tool.

High levels of criteria specificity on alerts and push notifications to enable effective prioritizing of support. IT teams can manage large sets of alerts without risking an overwhelming amount of notifications.

As with Teams, webhooks are one of the most common and simplest methods of collecting holistic data from PagerDuty. By collecting enriched event data around incidents, outages, and how your IT teams respond can be analyzed in the context of the wider business organization.

GitHub

Scraping GitHub provides great insight into the performance of your dev teams. What’s not as widely known is the business insight that can be gained by correlating GitHub commits on repositories.

Commits are changes to code in GitHub. Each commit comes with a comment message and log. Keeping GitHub commits under the eye of your monitoring stack reveals a fascinating hidden pocket of data that could change the way your teams approach outages and troubleshooting.

Outages occur for many reasons. Some require more work and code changes than others. Bad or lazy coding creates a lot of outages. Tracking and logging GitHub commits will reveal both the kinds of outages and the specific chunks of code that take up the most time for your engineers.

GitOps

Monitoring GitOps declarations and version edits pinpoint not only where weaknesses exist at an architectural level, but when they were implemented and whether the problem is isolated or part of a wider trend.  

Tableau

Tableau is an invaluable source of marketing data. Integrating Tableau with your log analytics platform opens up integral insight.

Digital marketing is an essential business aspect of modern enterprises. An effective digital marketing presence is key to success, and Tableau is the go-to tool for many organizations.

Tableau is useful for market strategy. It’s when Tableau data is included as part of a wider, holistic picture that organizational intelligence and insight can be gained from it. Scraping Tableau for data such as page bounce rates and read time allows you to see how technical measurements correlate with your marketing metrics.

Silo-Free Reporting

Say you’ve experienced a sudden dip in online sales despite an advertising drive. Your first reaction could be to blame the marketing material.

By including Tableau data in your analytics and reporting you can see that the advertising campaign was successful. Your website had a spike in visitors. This spike in traffic led to lag and a poor customer experience, visible due to an equally large spike in bounce rate. 

Scraping Tableau as a source of holistic data reveals that the sales dip was down to issues with your systems. Your strategy can then be to improve your systems so they can keep up with your successful marketing and large digital presence.

Jira

Integrating your analytics and monitoring platform with Jira can yield powerful results, both in alerting capabilities and collecting insight-generating data.

Using webhooks, your integrated platform can create Jira tickets based on predefined criteria. These criteria can be defined based on data from other sources in your ecosystem, as the issue is being raised and pushed from a third party platform.

Automating this process enables your IT team to deploy themselves both efficiently and with speed. It allows them to concentrate on resolving issues without getting bogged down in logging and pushing the alerts manually.

By having tickets raised by an ML-powered platform with observability over your whole infrastructure, your engineers won’t be blindsided by errors occurring in areas they may not have predicted.  

Use Case: Measuring the Business Impact of Third Party Outages with Holistic Collectors

Third party outages are one of the most common reasons for lost productivity and revenue. Many enterprises rely on third party software, systems, or services to deliver their own. Reliance on one or more third parties is the norm for many sectors and industries.

A third party will inevitably experience an outage at some point.  There’s no way to avoid this. Even the most reliable provider can fall victim to unforeseen circumstances such as power cuts or emergency server maintenance from time to time.

Third party outages can have huge ramifications. These services are often business-critical, and the financial costs of even brief outages can reach far past the hundred thousand dollar mark. 

Lost revenue is one way to measure the impact of such an outage. While financial data helps understand the initial impact of unforeseen downtime, alone it doesn’t provide full visibility of long-term consequences or the reaction of the business and consumers.

Collecting holistic data alongside the usual logging metrics helps to fill in the blanks. It allows a business to answer questions like:

  • Has this affected our public reputation?
  • Are users speaking positively about our response?
  • Did we respond faster or slower to this outage than usual?
  • Was our response effective at returning us to BAU as soon as possible?
  • Is this affecting the morale of our staff?
  • How much work is this making for my IT team?
  • Has web traffic taken a hit?

This leaves any business or organization in a much better position to control and mitigate the long-term impact of a third party outage. 

A study by Deloitte found that direct losses due to third party mismanagement have been found to directly cost businesses as much as $48m. This is before indirect losses are factored in. An outage could have minor immediate financial ramifications but damage long-term prospects through reputational damage. It would be almost impossible to gain the insight to prevent this using financial or systems metrics alone.

A Complete Holistic Data Solution

The Coralogix observability platform is a monitoring solution that enables holistic data collection from sources such as Teams, GitHub, PagerDuty, Slack, Tableau, and many others.

Collecting and logging data from multiple sources, both traditional and unorthodox, can be difficult to manage. Business intelligence and organizational insight are difficult to gain if information is stored and reported from dozens of sources in as many formats.

Coralogix’s observability platform provides a holistic system and organized view in a single pane. Using machine learning, our platform creates a comprehensive picture of your technical estate that comes with actionable business context. For visibility and insight that extends beyond the purely technical, the Coralogix platform is the solution your business needs.