The Data Plane Reality: OTel Scales, While Topology UX Lags

OpenTelemetry won the architectural standards battle. At scale, though, telemetry breaks more like plumbing than code. It breaks quietly, across a graph, with a blast radius you don’t understand until it’s expensive. With over 65% of organizations now running more than 10 collectors in production, hybrid deployments across Kubernetes and VMs are accelerating fast. Telemetry standardization is no longer a project milestone. It is a baseline expectation. (Source: OpenTelemetry Collector Follow-up Survey, Jan 28, 2026)

Crucially, with scale comes a shift in bottlenecks. Growing an observability estate today means introducing specialized data routes, multi-region pipelines, PII redaction rules, tail-sampling criteria, and cost-tier definitions across isolated business units. At that point, your OpenTelemetry configuration has evolved into a distributed data supply chain inheriting every operational problem that comes with one.

The operational paradox

In the OpenTelemetry Collector Follow-up Survey, 61% of respondents rate the experience of building and maintaining collector configurations as complex or neutral. This means that the majority of the industry is operating a critical data plane without adequate authoring infrastructure. They need a structural map, so teams don’t fall back on tribal knowledge.

This persistent friction point surfaces only after OpenTelemetry is already running in production. When configuration tooling forces engineers to mentally compile their architecture from thousands of lines of flat YAML, configuration management becomes a problem of active risk mitigation.
High-friction operational pains

Managing modern telemetry infrastructure through configuration files is architecturally dangerous. When pipelines expand across signals and regions, engineers must manually compile their entire topology from flat text. There are no maps or guardrails. There is only the file. Specifically, we see four friction points emerge consistently across architectural reviews and post-incident retrospectives with enterprise platform teams running OpenTelemetry at scale.

1. Drift becomes the default

Multi-region collector deployments don’t stay synchronized by default. Platform teams respond with GitOps pipelines, Helm charts, and layered values.yaml overrides. Merging vendor-supplied templates with environment-specific requirements turns every variable change into a manual reconciliation exercise. For instance, in Kubernetes, overriding a single tail-sampling block means patching a Helm chart. In ECS on EC2, it means owning the entire master config. The more signals and environments, the more these templates diverge.

2. Topology is implicit (and authoring is blind)

An OTel collector pipeline is a graph: receivers ingest, processors transform, exporters deliver. Raw YAML encodes that graph as flat text with no structural representation. Traditionally, engineers have traced routing paths and dependency chains across thousands of lines, multiple pipelines, and signals manually. Onboarding morphed into a knowledge transfer problem as the architecture existed only in the minds of whoever wrote the config last.

3. Blast radius is unknowable

A Git diff cannot tell you whether a line change silently broke a routing path, dropped a telemetry stream, or introduced a cardinality dimension. Span metrics misconfigured without schema awareness can generate tens of millions of unique metric dimensions before anyone notices. When that happens, the only available response is force. You must block the entire data stream at the platform level and accept the visibility loss while you debug.

4. Cost controls become guesswork

Tail-sampling processors and regex transforms are the primary levers for cost control and PII scrubbing. Both are completely opaque to tune via raw text. The interdependencies between decision_wait windows, num_traces buffers, and live trace volume have no visual representation. A wrong setting will have the collector fall behind its own queue. When the processor can’t evaluate a trace against its policy within the decision window, it drops the trace with no warning or visibility. In a live incident, those are exactly the traces you needed.
Feedback loop latency and brittle workarounds

The main frustration is that the validation loop is completely decoupled from the authoring loop.

To verify a pipeline change works, an engineer must modify code, commit, deploy to a cluster, restart collector runtimes, then hunt for signals to confirm telemetry is flowing. Every iteration is a multi-step, multi-minute cycle of editing an invisible map with no feedback until the very end. The cognitive burden is on debugging the gap between what you wrote and what the pipeline actually does.

Version control can’t see the graph

Git tracks lines but cannot tell you whether a one-line variable change silently reordered processor execution, broke a routing reference, or dropped a signal entirely. Even with a clean-looking diff, the pipeline is broken.

This is where the bus factor compounds the problem. Because topology lives in engineers’ heads rather than in any structural representation, telemetry expertise is concentrated within a small number of specialists. When they are unavailable, the platform stalls.

How teams cope and why they fail

Rather than solving the underlying visibility problem, platform teams build defensive workarounds that create new ones:

  • Configuration splitting. Breaking master configs into smaller decoupled files feels safer until you need to track a global version upgrade across a dozen fragmented files that have drifted independently.
  • Ad-hoc visualization. Engineers paste production YAML into external open-source visualizers to manually verify routing before deploying. This works until a compliance incident arises, or until the visualization tool disagrees with the actual runtime behavior.
  • Emergency gatekeeping. When a cardinality avalanche or blind authoring error hits production costs, the only available lever is a blunt blocking rule at the platform layer protecting the budget at the expense of visibility

Ultimately, these are less workarounds and more the structural symptoms of a data plane being operated without a control plane.
Elevating OTel Operations Without Lock-In

The industry has reached the shared conclusion that telemetry configuration is a graph problem being solved with a text editor. Some observability vendors use that gap as leverage forcing users to adopt proprietary configuration languages just to get a visual interface.

Replacing open standards like OpenTelemetry to fix the tooling problem just moves the risk from configuration complexity to vendor dependency.

The obvious objection is that visual tooling often comes with a hidden trade: proprietary configuration languages, black-box runtimes, or workflows that don’t survive a GitOps reality. Fixing authoring shouldn’t require replacing OpenTelemetry. It should make the existing graph visible, validatable, and safer to change.

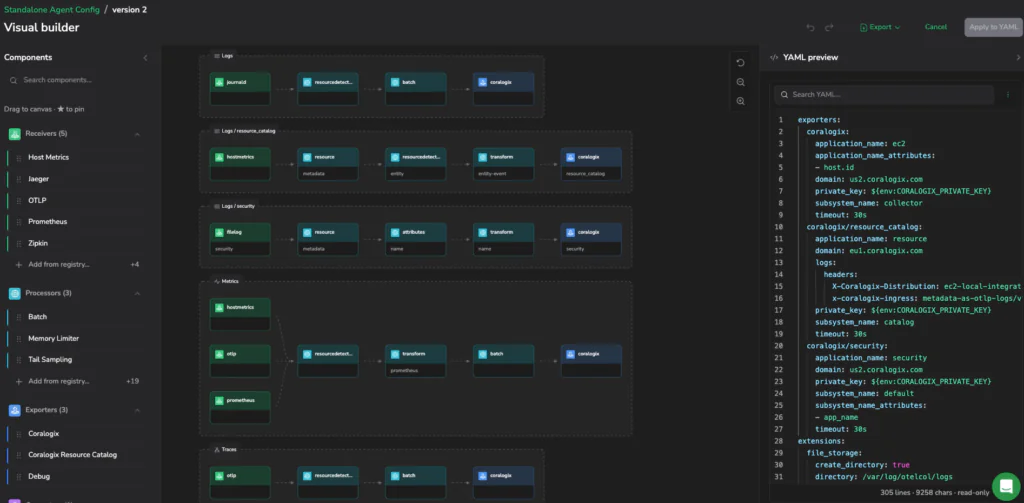
Therefore, the correct move is an intelligent design layer on top of vanilla OpenTelemetry. This layer will make topology a first-class artifact without touching the underlying standard. That’s the architectural principle behind the Coralogix Visual Builder in Fleet Management. It makes the YAML graph visible, validates it before deployment, and compiles back to fully compliant OpenTelemetry collector configuration. This is all with no proprietary runtime, no format lock-in, and no break in the GitOps workflow.

  • Rename a component → references update across the graph automatically
  • Missing exporter / orphaned component → flagged before deploy
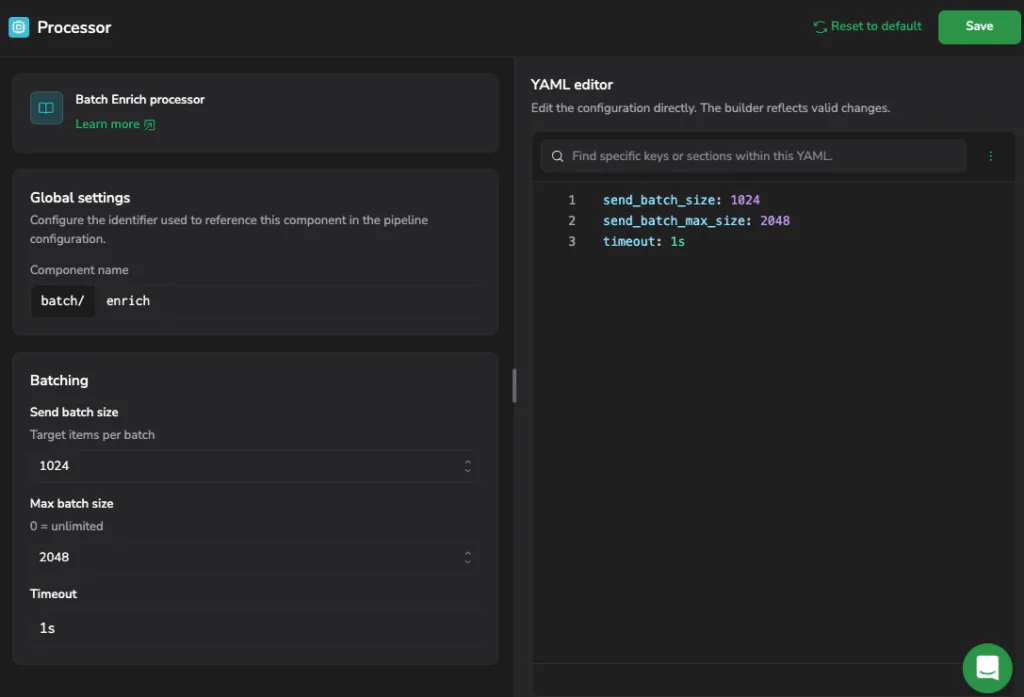
  • Tail-sampling policies → schema-aware forms instead of free-text guessing
  • YAML remains first-class → visual edits compile back to vanilla collector YAML
Mechanism Over Magic: What an Observable Design Layer Enables

Each friction point described above has a direct structural answer. We are going beyond feature coverage to offer a one-to-one elimination of the operational risks that accumulate when topology is invisible.

  • Preflight schema validation. The Visual Builder uses upstream OpenTelemetry component schemas aligned to collector releases, so validation matches what you deploy. Configuring a processor or receiver exposes valid schema fields and path parameters inline, inside the canvas. Orphaned components, invalid routes, and missing exporters surface before deployment.
  • Structural safety guardrails. Tail-sampling policies and regex transform blocks are configured through schema-aware forms, not free-text fields. The same class of misconfiguration that silently generates 13 million unique metric dimensions gets caught at authoring time, before it reaches the backend.
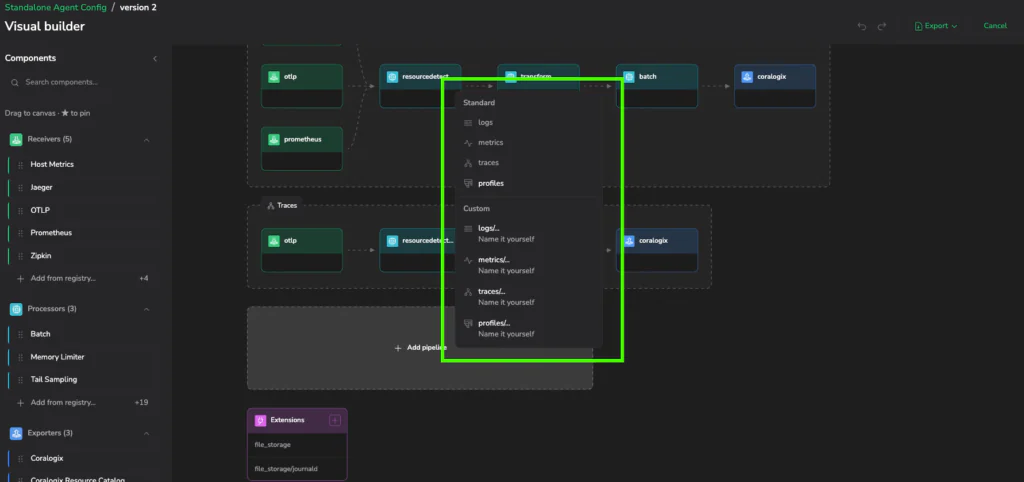
  • Automated reference rewriting. Scaling a component across environments means editing suffixes — otlp/app1, otlp/app2 — across every reference in service.pipelines. Miss one and the graph breaks silently. The Visual Builder rewrites every reference automatically on rename, across the entire pipeline graph, including connectors that appear in both receivers and exporters simultaneously.
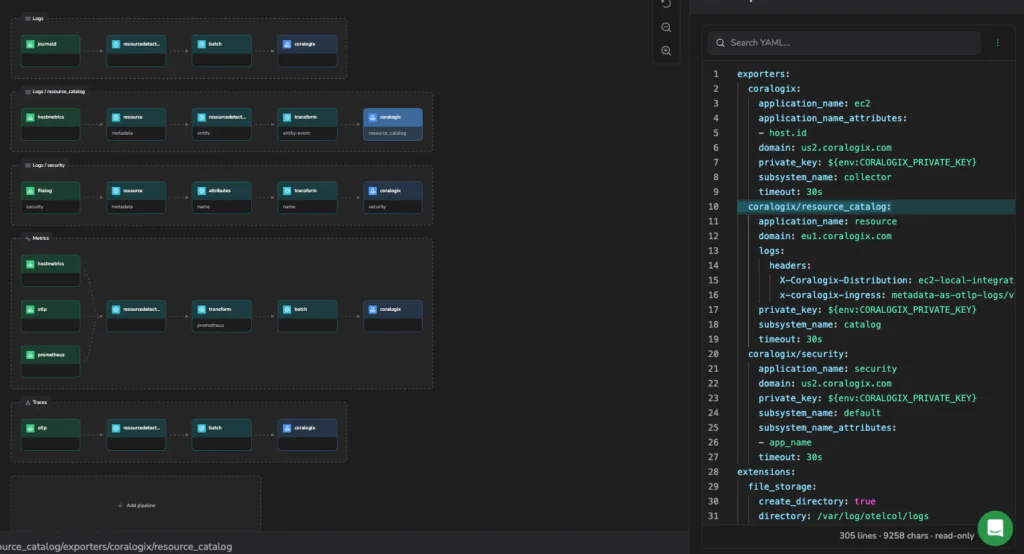
  • Topology as documentation. Rendering the implicit text graph as an explicit visual map makes architecture immediately legible. A new team member can trace a payment trace flow or a log routing path in minutes rather than excavating YAML. The knowledge is now in the interface, not in someone’s head.

Absolute compliance, with zero lock-in

Skeptical infrastructure teams treat visual configuration tools as abstractions that trade engineering rigor for convenience. The Visual Builder inverts that assumption.

The output is pure, vanilla OpenTelemetry collector YAML. No proprietary runtime. No black-box format. No break in the GitOps loop. An engineer can build a pipeline visually, drop into the YAML pane to hand-edit a field the form doesn’t expose, and apply it back as part of the same workflow.

The moment telemetry pipelines became a distributed infrastructure, they inherited the operational problems of distributed infrastructure. Kubernetes earned a control plane. CI/CD earned deployment gates and rollback primitives. In fact, until now OpenTelemetry pipelines were the exception. They were managed with the same flat-text workflows that worked when a single collector was a novelty. Visualizing topology isn’t a UX improvement. It’s how you make change safe in a distributed telemetry data plane.
Book a demo to see how Visual Builder turns OpenTelemetry collector YAML into a validated, editable topology and ship pipeline changes faster with less risk.

Ship OpenTelemetry Data to Coralogix via Reverse Proxy (Caddy 2)

It is commonplace for organizations to restrict their IT systems from having direct or unsolicited access to external networks or the Internet, with network proxies serving as gatekeepers between an organization’s internal infrastructure and any external network. Network proxies can provide security and infrastructure admins the ability to specify specific points of data egress from their internal networks, often referred to as an egress controller.

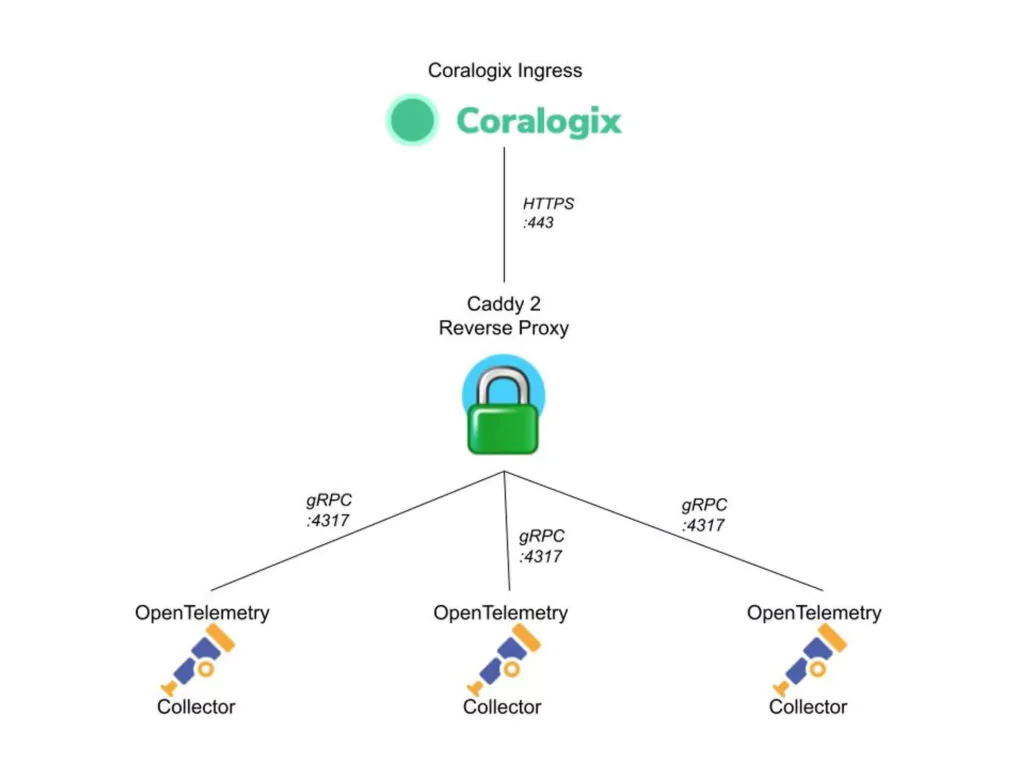
This tutorial demonstrates how to leverage open-source telemetry shippers in conjunction with an open-source network proxy to create a hub-and-spoke architecture that sends your data to Coralogix with a single specified point of data egress.

Before You Begin

What exactly will you find here?

At the outset, this guide assumes that you have already deployed the OpenTelemetry Collector as a DaemonSet within the Kubernetes cluster to export your data to Coralogix.

We’ll show you how to easily:

  • Install and configure the Caddy 2 Reverse Proxy server on a dedicated Debian host outside of the Kubernetes cluster
  • Deploy OpenTelemetry and a single instrumented application in a K3s Kubernetes cluster

Caddy 2 Setup

Installation

Install the latest stable release of Caddy 2 on a Debian server.

sudo apt install -y debian-keyring debian-archive-keyring apt-transport-https
curl -1sLf '<https://dl.cloudsmith.io/public/caddy/stable/gpg.key>' | sudo gpg --dearmor -o /usr/share/keyrings/caddy-stable-archive-keyring.gpg
curl -1sLf '<https://dl.cloudsmith.io/public/caddy/stable/debian.deb.txt>' | sudo tee /etc/apt/sources.list.d/caddy-stable.list
sudo apt update
sudo apt install caddy

Configuration

STEP 1. Create a file called Caddyfile in your working directory.

touch Caddyfile

STEP 2. Copy the following configuration into Caddyfile:

{
        servers {
                protocols h1 h2 h2c
        }
}

<caddy_server_address>:4317 {
        log {
                output stdout
                level DEBUG
        }
        reverse_proxy ingress.coralogixstg.wpengine.com:443 {
                transport http {
                        tls_server_name ingress.coralogixstg.wpengine.com
                }
        }
}

:2019 {
        metrics /metrics
}

STEP 3. Define any global options that apply to the entire Caddy server, including which HTTP protocols to support. The h2c scheme allows us to translate gRPC requests into HTTPS onward requests to Coralogix.

{
        servers {
                protocols h1 h2 h2c
        }
}

STEP 4. Define the parameters of the reverse proxy, including the address and port for the inbound traffic coming from our OpenTelemetry Collectors. This allows us to successfully forward inbound gRPC traffic from our OpenTelemetry Collectors to Coralogix ingress via HTTPS.

<caddy_server_address>:4317 {
        log {
                output stdout
                level DEBUG
        }
        reverse_proxy ingress.coralogixstg.wpengine.com:443 {
                transport http {
                        tls_server_name ingress.coralogixstg.wpengine.com
                }
        }
}

Notes:

  • The log function is used to write all associated logs to stdout with a level of DEBUG or higher.
  • The destination of our reverse proxy connections is specified as ingress.coralogixstg.wpengine.com:443 with the transport type specified to HTTP.
  • The tls_server_name parameter is set to ingress.coralogixstg.wpengine.com.

STEP 5. Instruct Caddy 2 to publish Prometheus-format metrics of the Caddy 2 server itself. This step allows us to use our OpenTelemetry Collectors to scrape these metrics and actively monitor our egress controller without deploying any additional components into our telemetry stack.

:2019 {
        metrics /metrics
}

STEP 6. To apply the configuration for the first time and start the Caddy server, use the following command:

caddy run

STEP 7. To make any changes to the Caddyfile, reapply the configuration with the following command:

caddy reload

STEP 8. To view the logs generated by Caddy 2 in stdout, use the following command:

sudo journalctl -u caddy -f

OpenTelemetry

Now that have implemented our Caddy 2 server, update the configuration of our OpenTelemetry Daemonset to send the gRPC traffic to the reverse proxy listening address.

Use this example values.yaml file with Helm to apply the new configuration to our OpenTelemetry Collectors.

global:
  traces:
    endpoint: "<caddy_proxy_address>:4317"
  metrics:
    endpoint: "<caddy_proxy_address>:4317"
  logs:
    endpoint: "<caddy_proxy_address>:4317"

opentelemetry-collector:
  mode: "daemonset"
  presets:
    logsCollection:
      enabled: false
    kubernetesAttributes:
      enabled: true
    hostMetrics:
      enabled: true
    kubeletMetrics:
      enabled: true

  config:
    exporters:
      coralogix:
        timeout: "30s"
        private_key: "${CORALOGIX_PRIVATE_KEY}"
        traces:
          endpoint: "{{ .Values.global.traces.endpoint }}"
          tls:
            insecure_skip_verify: true
        metrics:
          endpoint: "{{ .Values.global.metrics.endpoint }}"
          tls:
            insecure_skip_verify: true
        logs:
          endpoint: "{{ .Values.global.logs.endpoint }}"
          tls:
            insecure_skip_verify: true
  receivers:
      prometheus:
        config:
          scrape_configs:
            - job_name: 'caddy'
              scrape_interval: 10s
              static_configs:
                - targets: ['<caddy_proxy_address>:2019']

This demands a bit of an explanation:

<strong>endpoint</strong>

The first part of this file specifies the endpoint configuration to match the value we used for our reverse proxy listening address in our Caddyfile.

global:
  traces:
    endpoint: "<caddy_proxy_address>:4317"
  metrics:
    endpoint: "<caddy_proxy_address>:4317"
  logs:
    endpoint: "<caddy_proxy_address>:4317"

<strong>tls</strong>

As this is a tutorial environment, we have added tls: insecure_skip_verify: true configurations to each of the endpoints (traces, metrics, logs) for the Coralogix Exporter.

The setting insecure_skip_verify: true allows us to send the data using unencrypted gRPC (without TLS verification) to our Caddy 2 egress controller. Caddy 2 then handles the TLS handshake with Coralogix ingress over HTTPS.

Important note folks! This is for a non-production environment. If you have a valid SSL/TLS architecture available, we recommend you secure the traffic between the OpenTelemetry Collectors and Caddy 2 using TLS.

  config:
    exporters:
      coralogix:
        timeout: "30s"
        private_key: "${CORALOGIX_PRIVATE_KEY}"
        traces:
          endpoint: "{{ .Values.global.traces.endpoint }}"
          tls:
            insecure_skip_verify: true
        metrics:
          endpoint: "{{ .Values.global.metrics.endpoint }}"
          tls:
            insecure_skip_verify: true
        logs:
          endpoint: "{{ .Values.global.logs.endpoint }}"
          tls:
            insecure_skip_verify: true

<strong>prometheus</strong>

Here we add a configuration in our OpenTelemetry Collector configuration that leverages the Prometheus receiver to scrape the metrics published by Caddy 2. All we need to do here is change <caddy_proxy_address> to the address of our Caddy 2 server.

receivers:
      prometheus:
        config:
          scrape_configs:
            - job_name: 'caddy'
              scrape_interval: 10s
              static_configs:
                - targets: ['<caddy_proxy_address>:2019']

All Set!

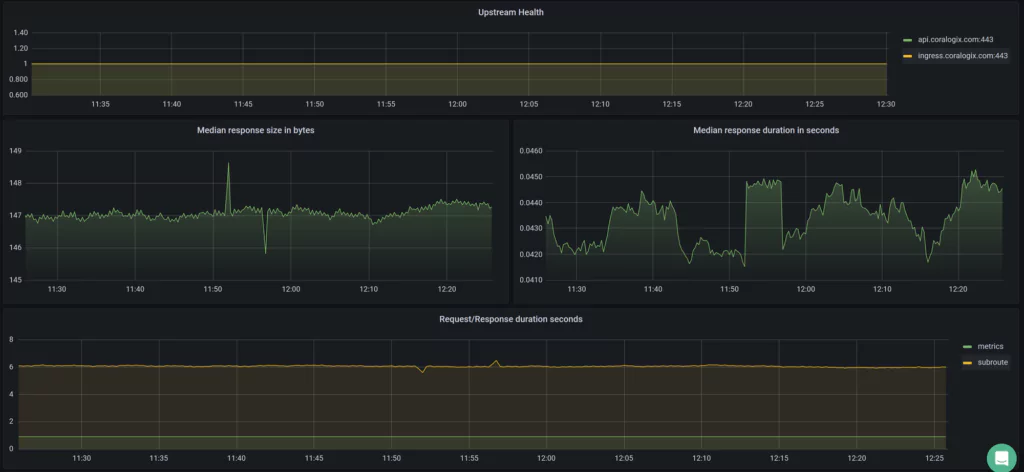
You can now monitor Caddy 2 in your Coralogix dashboard. Go on to configure metric alerts to notify us should any issues occur with our egress controller.

Connecting OpenTelemetry to AWS Fargate

OpenTelemetry is an open-source observability framework that provides a vendor-neutral and language-agnostic way to collect and analyze telemetry data. This tutorial will show you how to integrate OpenTelemetry with Amazon AWS observability Fargate, a container orchestration service that allows you to run and scale containerized applications without managing the underlying infrastructure.

Prerequisites:

  • You should have a basic understanding of OpenTelemetry and Amazon AWS Fargate
  • You should have an AWS account, and the AWS CLI installed and configured on your local machine
  • You should have a containerized application that you want to instrument with OpenTelemetry and run on Fargate

Step 1: Create an Amazon Elastic Container Registry (ECR) repository

The first step is to create an ECR repository where you will push your containerized application. You can do this by running the following command:

aws ecr create-repository --repository-name <your_repository_name>

Step 2: Build and Push Your Containerized Application

Build your containerized application using your preferred containerization tool and then push it to the ECR repository you created in step 1.

# Build the container
docker build -t <your_image_name> .
# Tag the container
docker tag <your_image_name> <your_account_id>.dkr.ecr.<your_region>.amazonaws.com/<your_repository_name>:<your_tag>
# Push the container to ECR
docker push <your_account_id>.dkr.ecr.<your_region>.amazonaws.com/<your_repository_name>:<your_tag>

Step 3: Install the OpenTelemetry Collector as a Sidecar

The OpenTelemetry Collector is a daemon that can collect and process telemetry data from your applications. To install the collector as a sidecar container in your Fargate task, you will need to create a new task definition that includes both your application container and the collector container.

# Create a new task definition
aws ecs register-task-definition --family <your_task_definition_name> --container-definitions "[{"name":"<your_application_name>","image":"<your_account_id>.dkr.ecr.<your_region>.amazonaws.com/<your_repository_name>:<your_tag>"},{"name":"otel-collector","image":"open-telemetry/opentelemetry-collector","environment":[{"name":"OTEL_EXPORTER_OTLP_ENDPOINT","value":"<your_otel_exporter_endpoint>"}]"}]"

Step 4: Create a new Fargate Cluster

Now that you have a task definition, you can create a new Fargate cluster and start a task using that definition.

aws ecs create-cluster --cluster-name <your_cluster_name>
aws ecs run-task --cluster <your_cluster_name> --task-definition <your_task_definition_name>

Step 5: View the Telemetry Data

Once the task runs, you can view the telemetry data collected by the OpenTelemetry collector by sending a request to the location where you have exported your OpenTelemetry data. 

Remember: Coralogix offers a complete integration with Open Telemetry, for logs, traces, and metrics!

Serverless Observability is the next big challenge

As Serverless architectures grow, so will the observability challenge. By combining tools that solve the cross-cutting observability problem, like OpenTelemetry, and Fargate, we bring ourselves one step closer to an efficient, efficient, battle-tested, and production-ready observability solution for the serverless world. 

How to Configure the OTel Community Demo App to Send Telemetry Data to Coralogix

If you’re just getting familiar with full-stack observability and Coralogix and you want to send us your metrics and traces using the new OpenTelemetry Community Demo Application, this blog is here to help you get started. In this simple, step-by-step guide, you will learn how to get telemetry data produced by the OpenTelemetry Demo Webstore into your Coralogix dashboard using Docker on your local machine.

Intro

Earlier this year, OpenTelemetry (OTel) announced a project to build an OpenTelemetry Demo, and more recently it shared OpenTelemetry Demo v1.0 with the world, which allows you to quickly run a complete end-to-end distributed system instrumented with 100% OpenTelemetry traces and metrics. You might be asking why this is such a big deal. It makes OTel that much more accessible, by allowing anyone to easily create a sample application.

The example below uses the OpenTelemetry (OTel) Collector to ingest metrics and traces and sends them to us, where you can analyze and gain valuable insights from your data, including through the use of our new APM features.

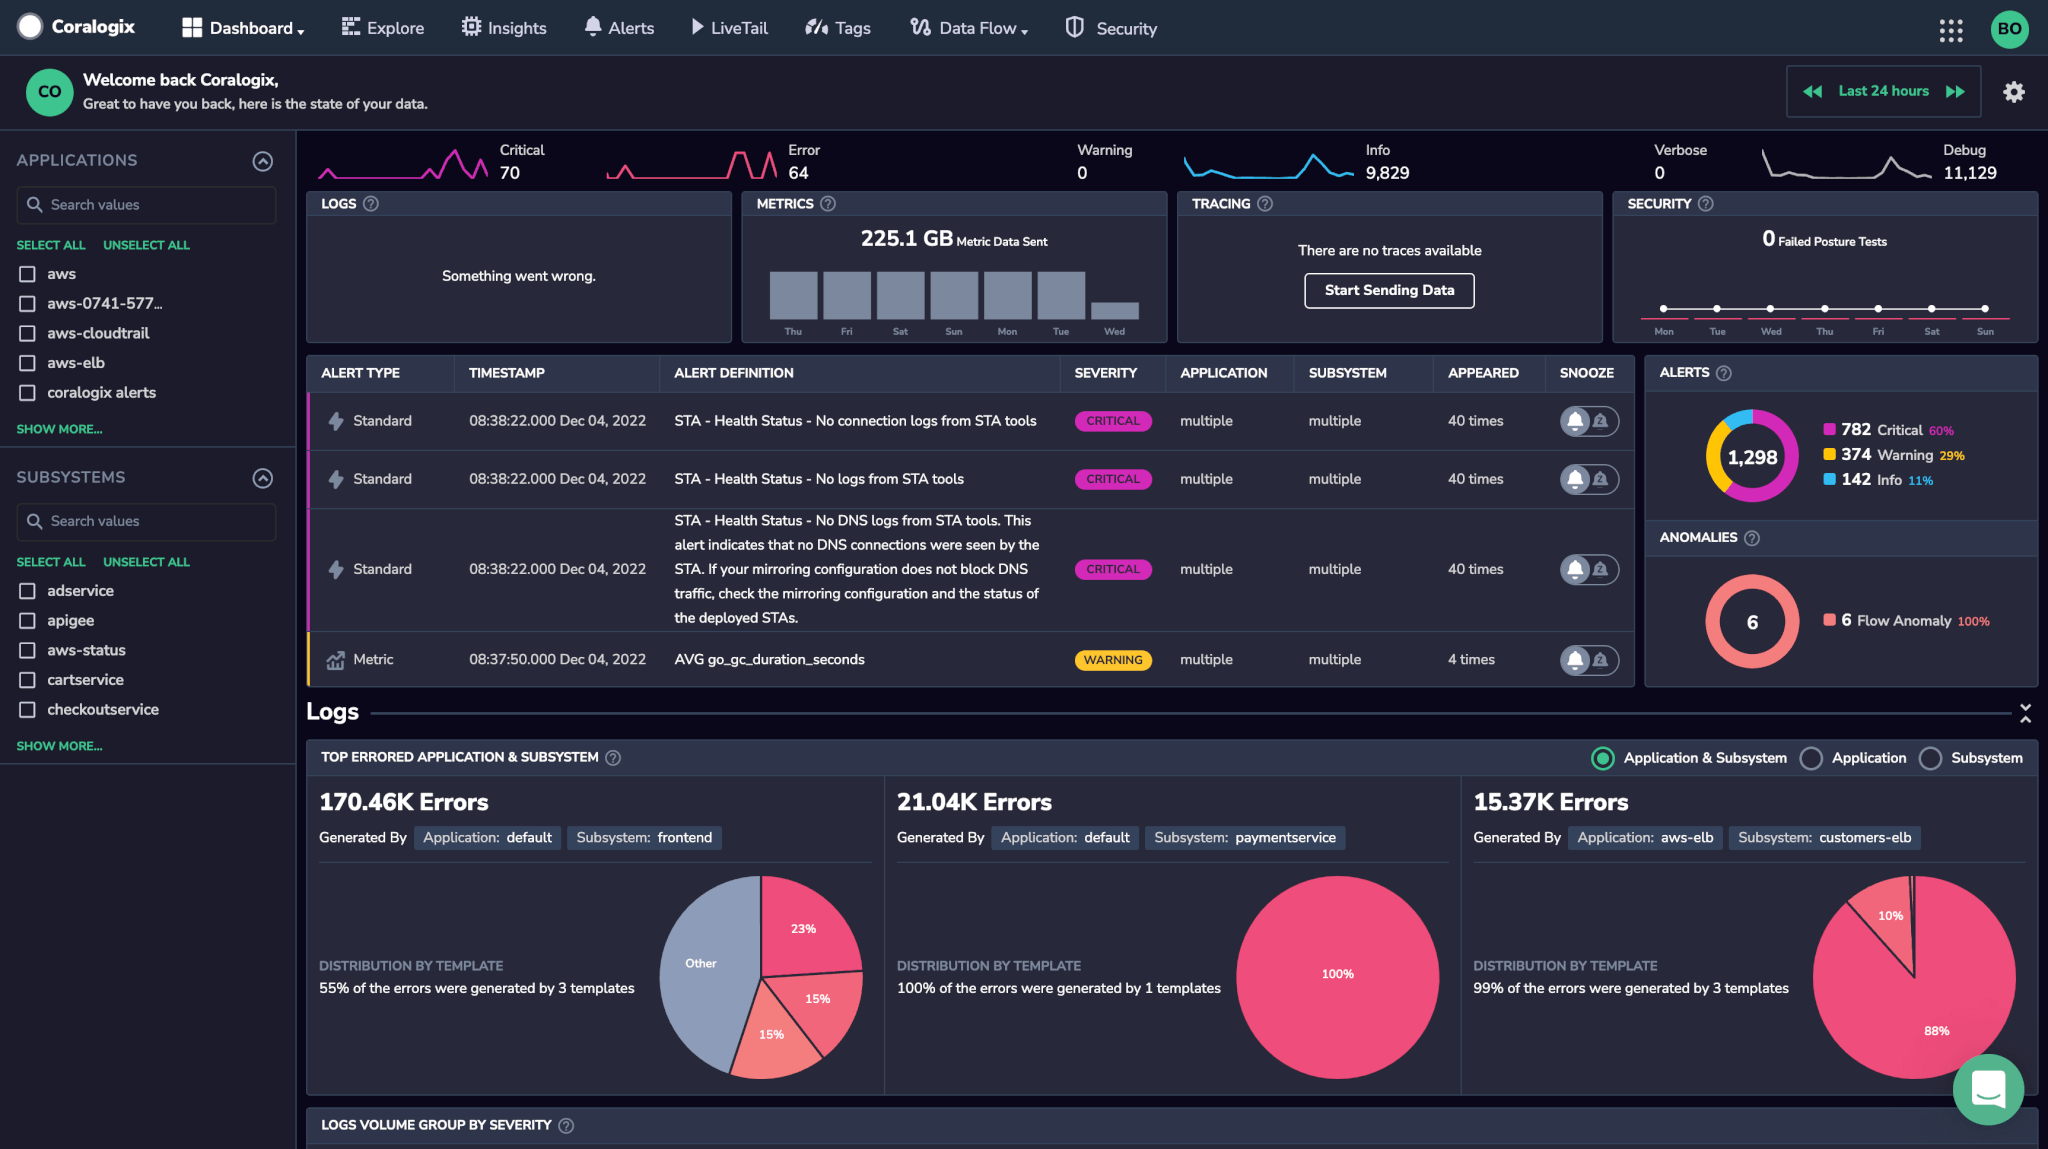
Coralogix dashboard

OTel Demo App

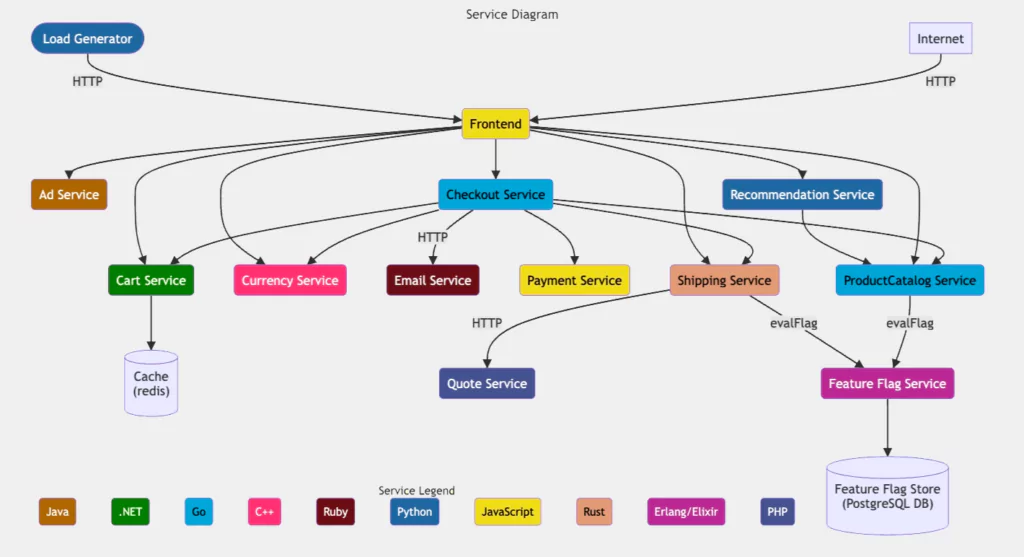
The OTel Demo App serves as a fully-functioning online store, the OpenTelemetry Astronomy Shop, a microservice-based distributed system intended to illustrate the implementation of OpenTelemetry in a near real-world environment.

The app consists of more than 14 micro-services that communicate with each other via gRPC, Redis, and HTTP libraries, with support for 6 languages (C#, Go, Java, Node.js, Python, and Ruby).

The demo app also comes with supporting components such as OpenTelemetry Collector, Grafana, Prometheus, and Jaeger to export and visualize metrics and traces. OpenTelemetry Collector can be configured to send telemetry data to multiple backends, including Coralogix.

OpenTelemetry demo application architecture diagram
OpenTelemetry demo application architecture diagram. (https://github.com/open-telemetry/opentelemetry-demo)

OTel Collector

At the heart of the OTel Demo is the OTel Collector. It offers a vendor-agnostic implementation of how to receive, process and export telemetry data. It removes the need to run, operate, and maintain multiple agents/collectors.

The OTel Collector is configured via YAML, which is used to define receivers, processors, exporters, and pipelines.

To run the OTel Collector as part of the demo, you’ll need either a Docker or Kubernetes environment. We’ll deploy it locally using Docker Compose, which runs Docker, and send telemetry data to Coralogix as a backend.

Our ‘How-to’ Guide

Prerequisites

  • Docker, Docker Compose, and Git installed on your local workstation
  • Coralogix account in the domain corresponding to the region within which you would like your data stored

6 Easy Steps

STEP 1 – Clone the Webstore Demo repo

git clone <https://github.com/open-telemetry/opentelemetry-demo.git>

STEP 2Set up Exporter Configuration

  • Change the directory and edit the .env file, add the following lines to the bottom and update the values to reflect your Coralogix account environment variables, as in the example below:
    • CORALOGIX_DOMAIN: You’ll need to include your account’s specific domain in the Coralogix endpoint.
    • CORALOGIX_PRIVATE_KEY: Insert your Coralogix private key. Bear in mind that this information is sensitive and be kept secure.
    • CORALOGIX_APP_NAME & CORALOGIX_SUBSYS_NAME: Customize and organize your data in your Coralogix dashboard using application and subsystem ****names.
# ********************
# Exporter Configuration
# ********************
CORALOGIX_DOMAIN=eu2.coralogix.com
CORALOGIX_APP_NAME=otel
CORALOGIX_SUBSYS_NAME=otel-demo
CORALOGIX_PRIVATE_KEY=b3887c90-5e67-4249-e81b-EXAMPLEKEY
  • Next, edit the file src/otelcollector/otelcol-config-extras.yml and add the following:
# extra settings to be merged into OpenTelemetry Collector configuration
# do not delete this file

exporters:
  coralogix:
    domain: ${CORALOGIX_DOMAIN}

    # Your Coralogix private key is sensitive
    private_key: "${CORALOGIX_PRIVATE_KEY}"

    # AppNameSubSystem values.
    # The first non-empty resource attribute is used.
    # application_name_attributes:
    #   - "service.namespace"
    #   - "k8s.namespace.name"
    # subsystem_name_attributes:
    #   - "service.name"
    #   - "k8s.deployment.name"
    #   - "k8s.statefulset.name"
    #   - "k8s.daemonset.name"
    #   - "k8s.cronjob.name"
    #   - "k8s.job.name"
    #   - "k8s.container.name"
    # It is required that logs, metrics and traces emitted by this exporter
    # are tagged in Coralogix
    # with the default application and subsystem constants.
    # Traces, Metrics and Logs emitted by this OpenTelemetry exporter
    # are tagged in Coralogix with the default application and subsystem constants.
    application_name: "${CORALOGIX_APP_NAME}"
    subsystem_name: "${CORALOGIX_SUBSYS_NAME}"

    # (Optional) Timeout is the timeout for every attempt to send data to the backend.
    timeout: 30s

processors:
  batch/traces:
    timeout: 1s
    send_batch_size: 50
  batch/metrics:
    timeout: 60s
  resourcedetection:
    detectors: [env, docker]
    timeout: 5s
    override: true

service:
  pipelines:
    traces:
      receivers: [otlp]
      processors: [transform, batch/traces, batch]
      exporters: [otlp, debug, spanmetrics, coralogix]
    metrics:
      receivers: [hostmetrics, docker_stats, httpcheck/frontend-proxy, otlp, redis, spanmetrics]
      processors: [resourcedetection, batch/metrics, batch]
      exporters: [otlphttp/prometheus, debug, coralogix]
    logs:
      receivers: [otlp]
      processors: [batch]
      exporters: [opensearch, debug, coralogix]

Next edit the following file /src/otelcollector/otelcol-config.yml

connectors:
  spanmetrics:

service:
  pipelines:
    traces:
      receivers: [otlp]
      processors: [transform, batch]
      exporters: [otlp, debug, spanmetrics]
    metrics:
      receivers: [hostmetrics, docker_stats, httpcheck/frontend-proxy, otlp, redis, spanmetrics]
      processors: [batch]
      exporters: [otlphttp/prometheus, debug]
    logs:
      receivers: [otlp]
      processors: [batch]
      exporters: [opensearch, debug]  

STEP 3 – Update the OTEL Collector container definition

  • Open docker-compose.yml and update the otelcol container definition to match the environment variables that we defined earlier. Add the environment section to file, as done in the example below.
# OpenTelemetry Collector
otelcol:
  image: ${COLLECTOR_CONTRIB_IMAGE}
  container_name: otel-col
  deploy:
    resources:
      limits:
        memory: 200M
  restart: unless-stopped
  command: [ "--config=/etc/otelcol-config.yml", "--config=/etc/otelcol-config-extras.yml" ]
  user: 0:0
  volumes:
    - ${HOST_FILESYSTEM}:/hostfs:ro
    - ${DOCKER_SOCK}:/var/run/docker.sock:ro
    - ${OTEL_COLLECTOR_CONFIG}:/etc/otelcol-config.yml
    - ${OTEL_COLLECTOR_CONFIG_EXTRAS}:/etc/otelcol-config-extras.yml
  ports:
    - "${OTEL_COLLECTOR_PORT_GRPC}"
    - "${OTEL_COLLECTOR_PORT_HTTP}"
  depends_on:
    - jaeger
  logging: *logging
  environment:
    - ENVOY_PORT
    - HOST_FILESYSTEM
    - OTEL_COLLECTOR_HOST
    - OTEL_COLLECTOR_PORT_GRPC
    - OTEL_COLLECTOR_PORT_HTTP
    - CORALOGIX_DOMAIN
    - CORALOGIX_APP_NAME
    - CORALOGIX_SUBSYS_NAME
    - CORALOGIX_PRIVATE_KEY

STEP 4 – Launch the sample

  • To run the environment, use the following command:
docker compose up --no-build
  • If you are using a M1/M2 Mac, you’ll need to build the containers to ensure that they’re using the right architecture. This will take significantly longer (upwards of 20 minutes).
docker compose up --build
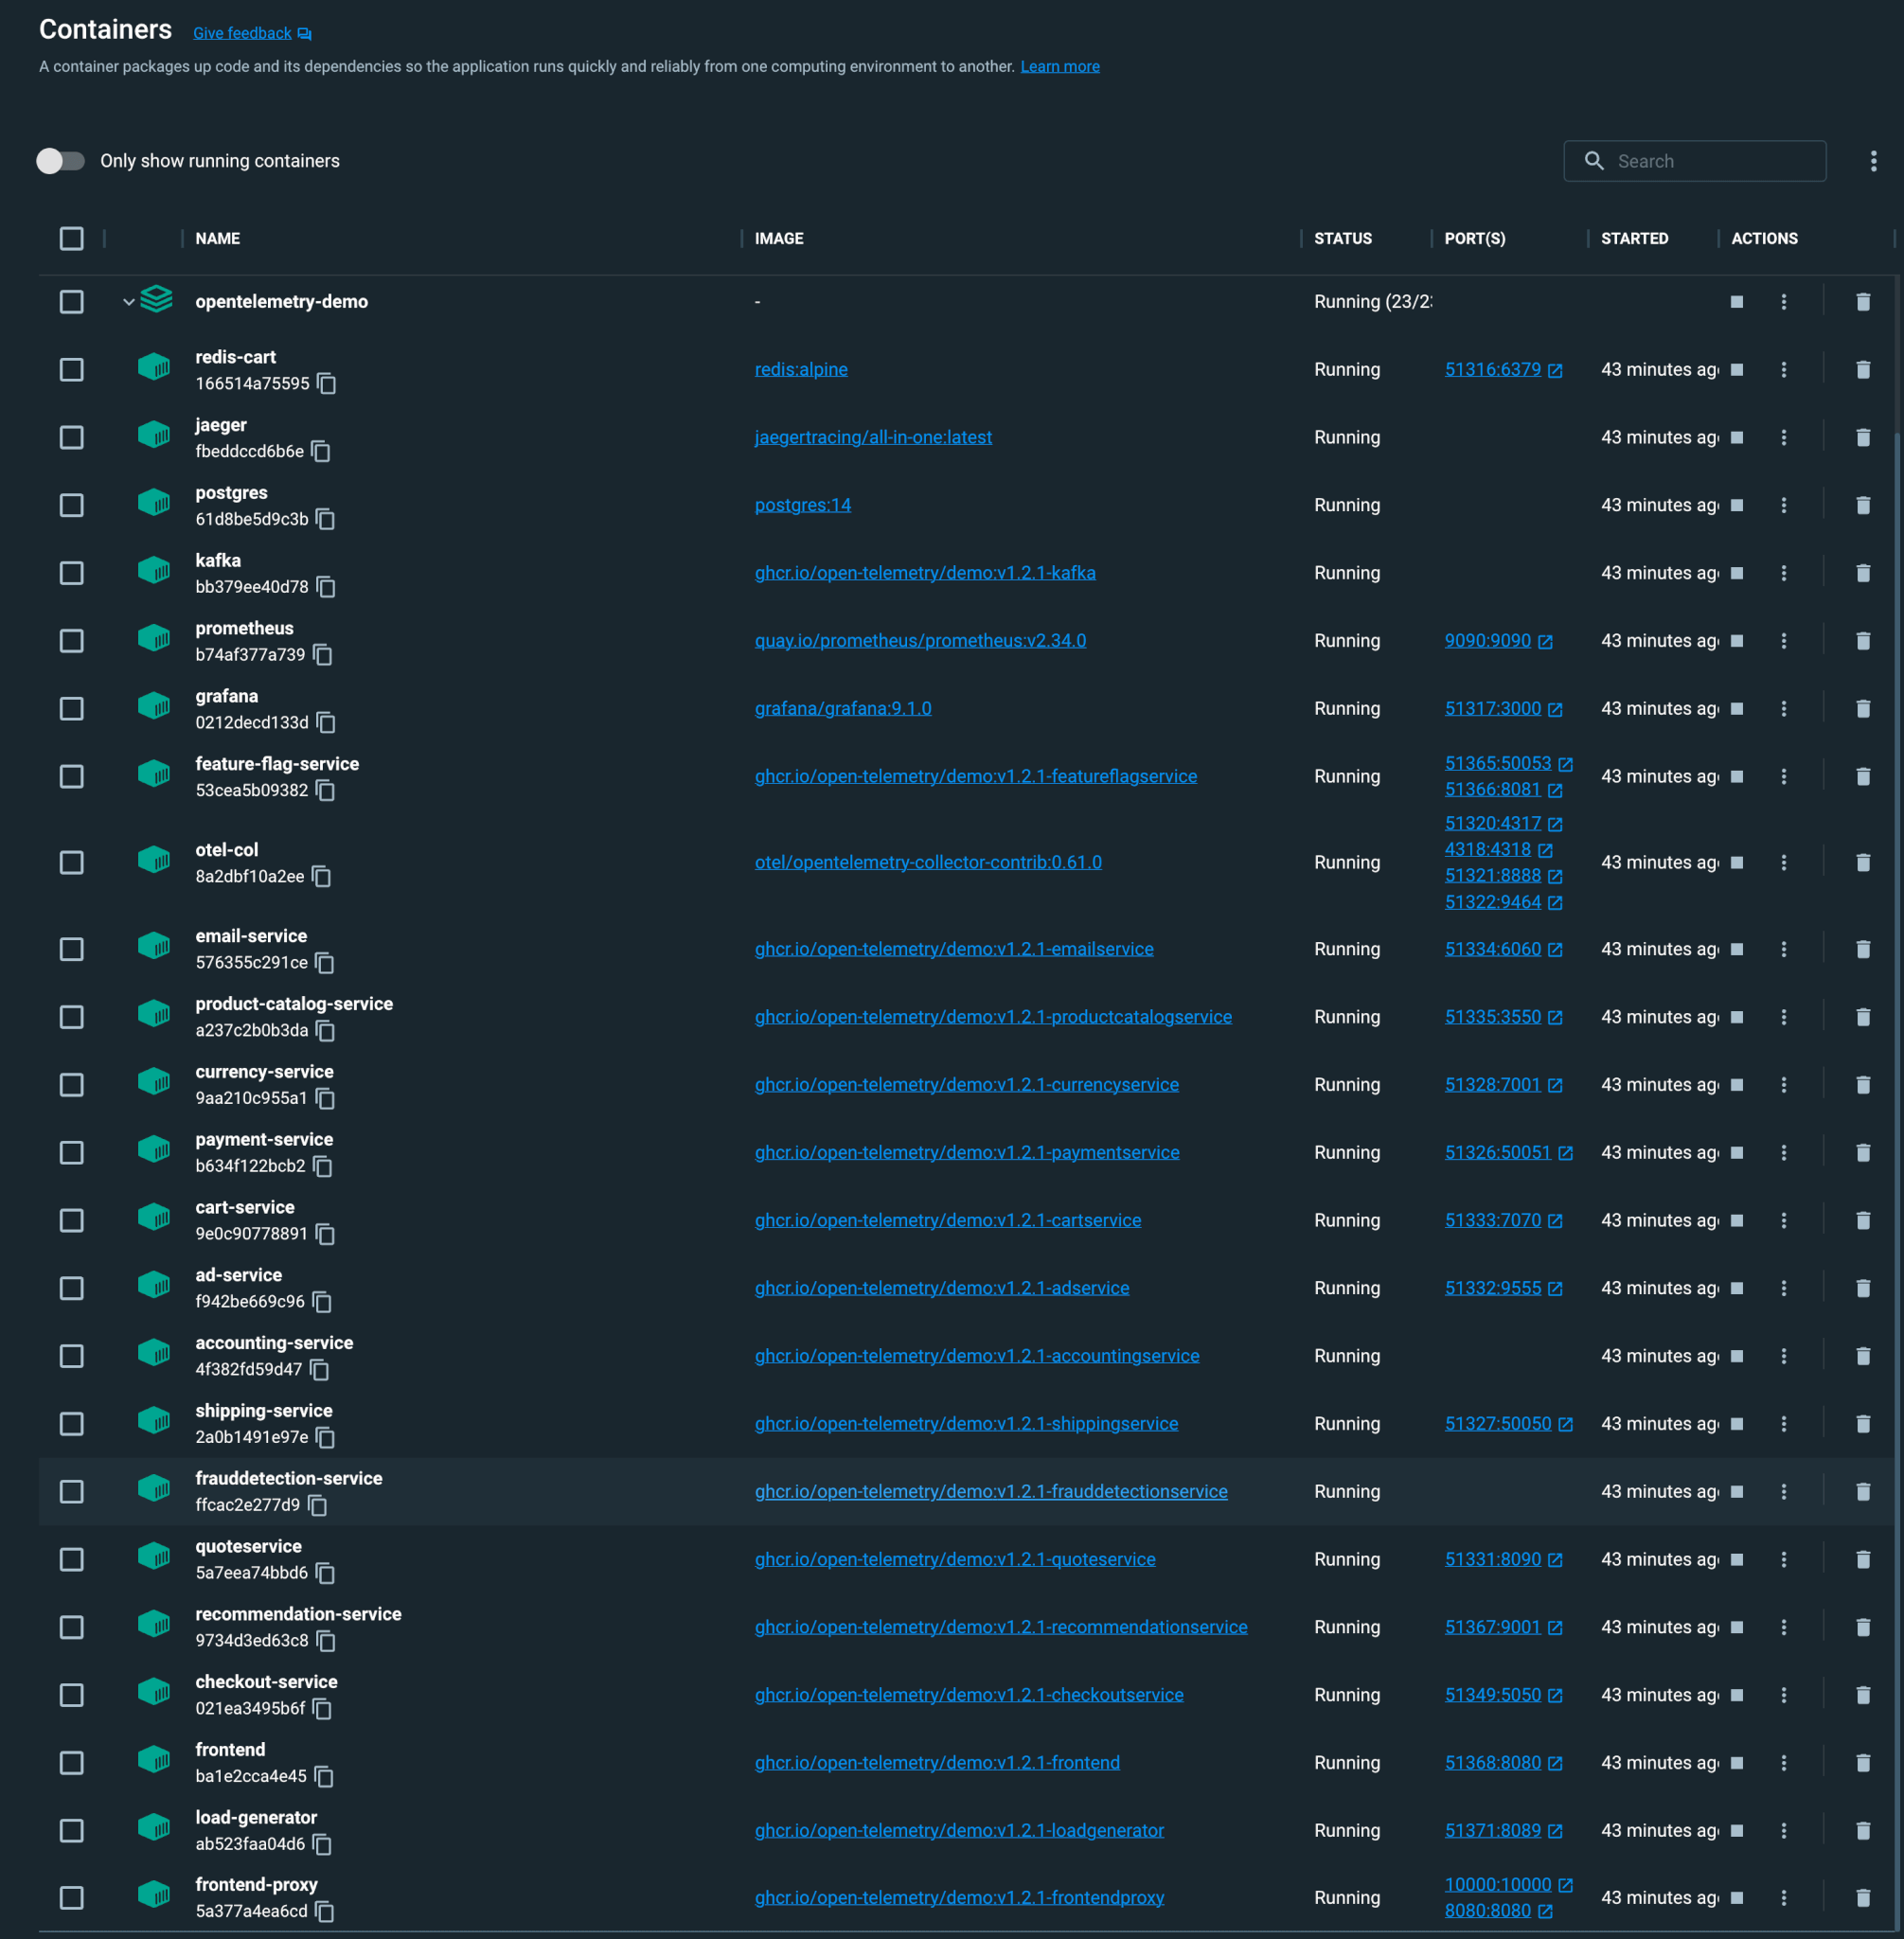
  • Here is what your Docker desktop dashboard should look like:
Docker desktop dashboard

STEP 5 – Welcome to the Webstore!

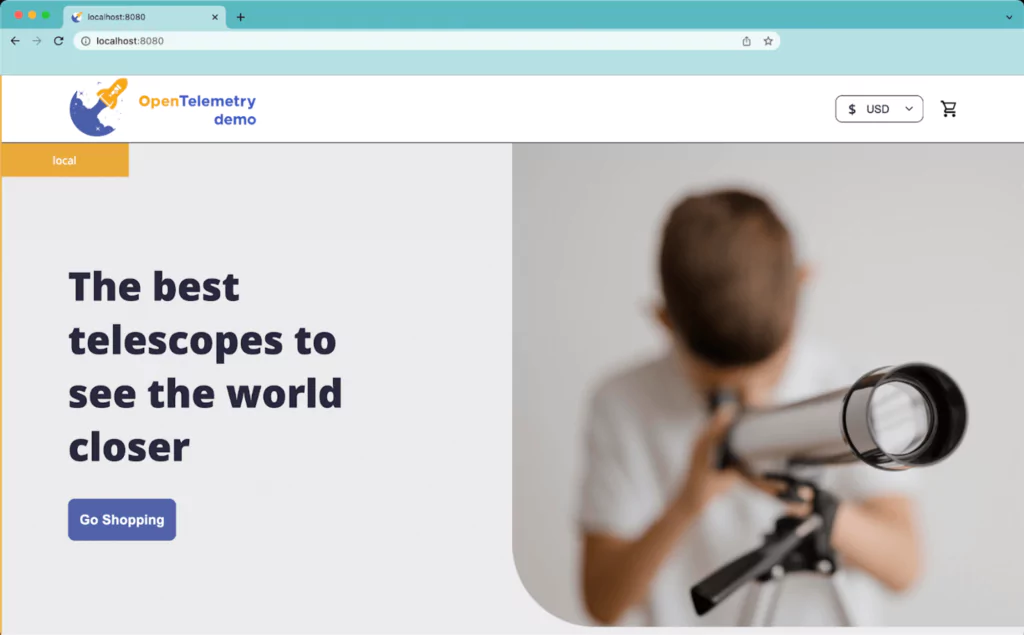
  • Once the images are built and containers are started you can access the webstore at the following URL: https://localhost:8080/.
Webstore
  • By default, there is a load generator that simulates 10 users using the webstore. Join them – browse, check out and purchase products on the site! You can view stats on this service at the URL: https://localhost:51371/.

STEP 6 – View your telemetry data on your Coralogix dashboard

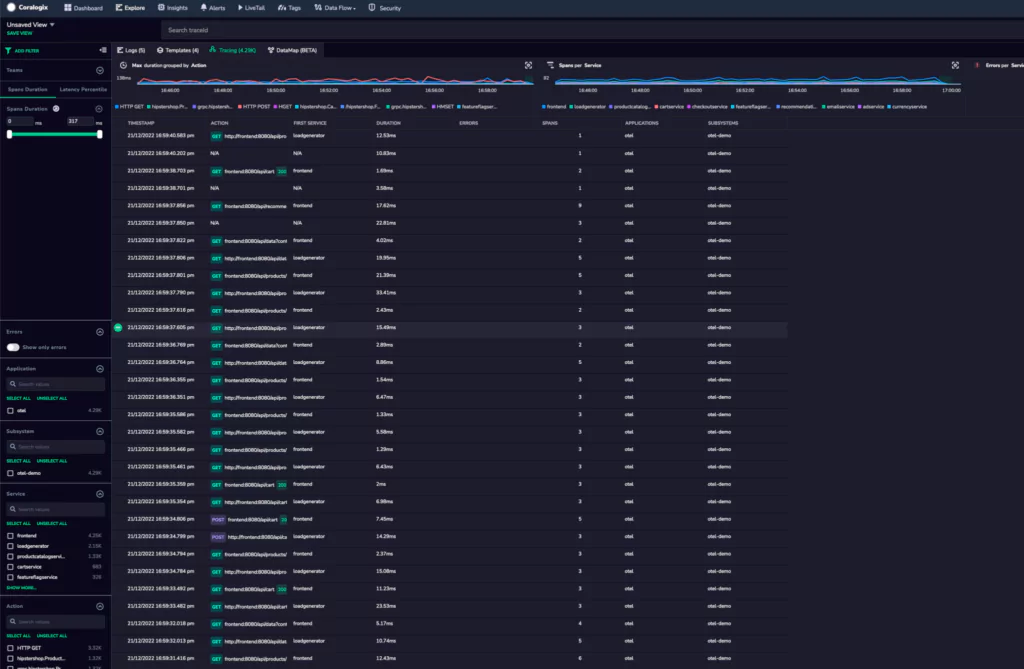
  • View the traces generated by the project on Coralogix dashboard.

Explore tab > Tracing

Traces - Coralogix dashboard
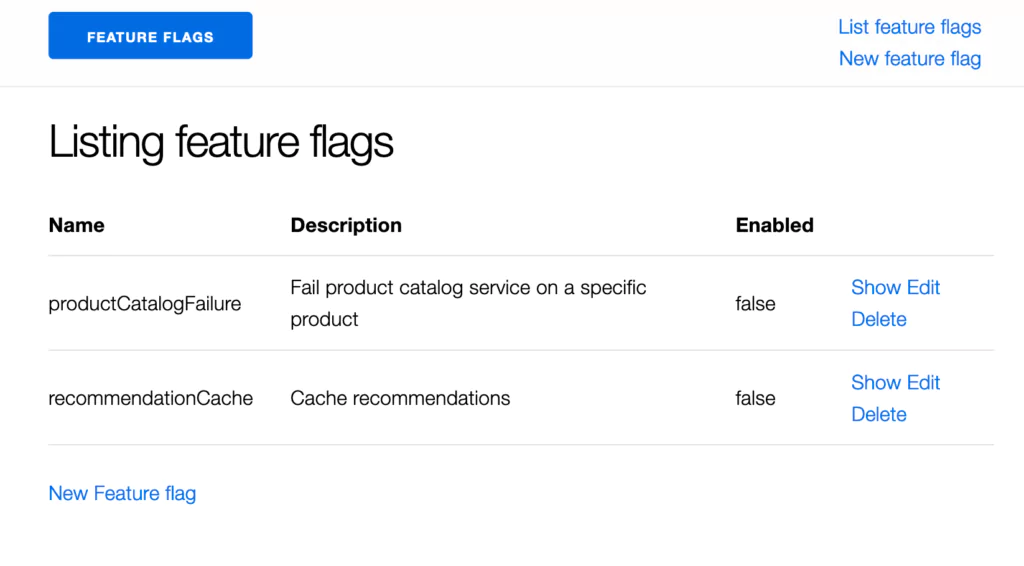
  • The OTel Demo has Feature Flags that you can enable to introduce errors into the environment, these flags can be accessed here: https://localhost:8080/feature/featureflags.
Feature flags
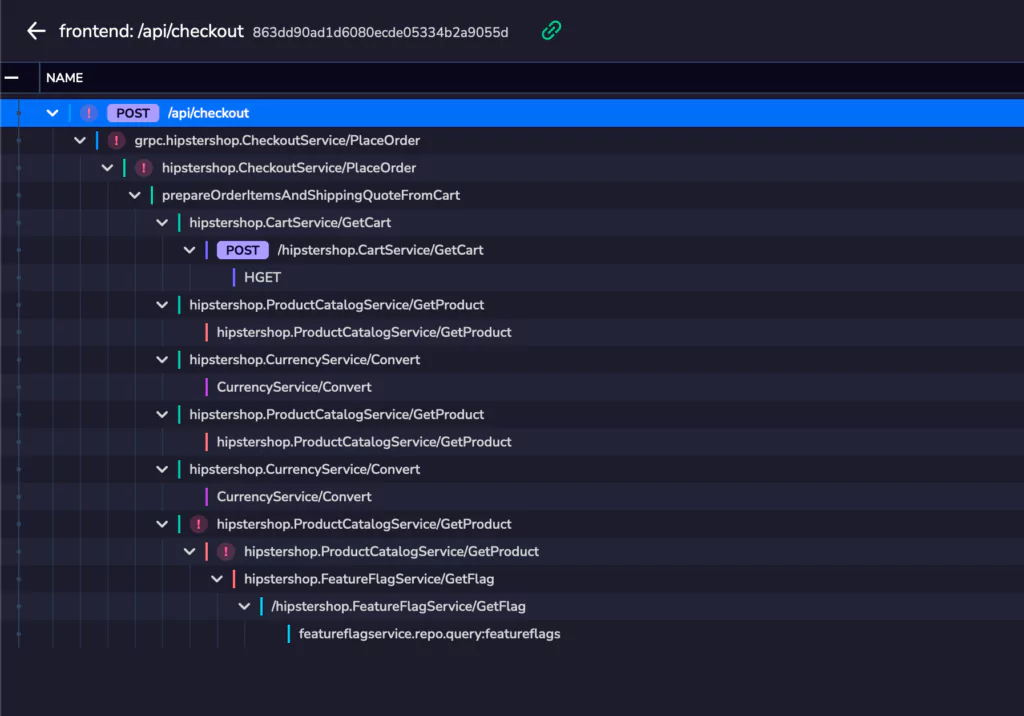
  • Click on one of these traces in your dashboard to view in greater detail.
Traces
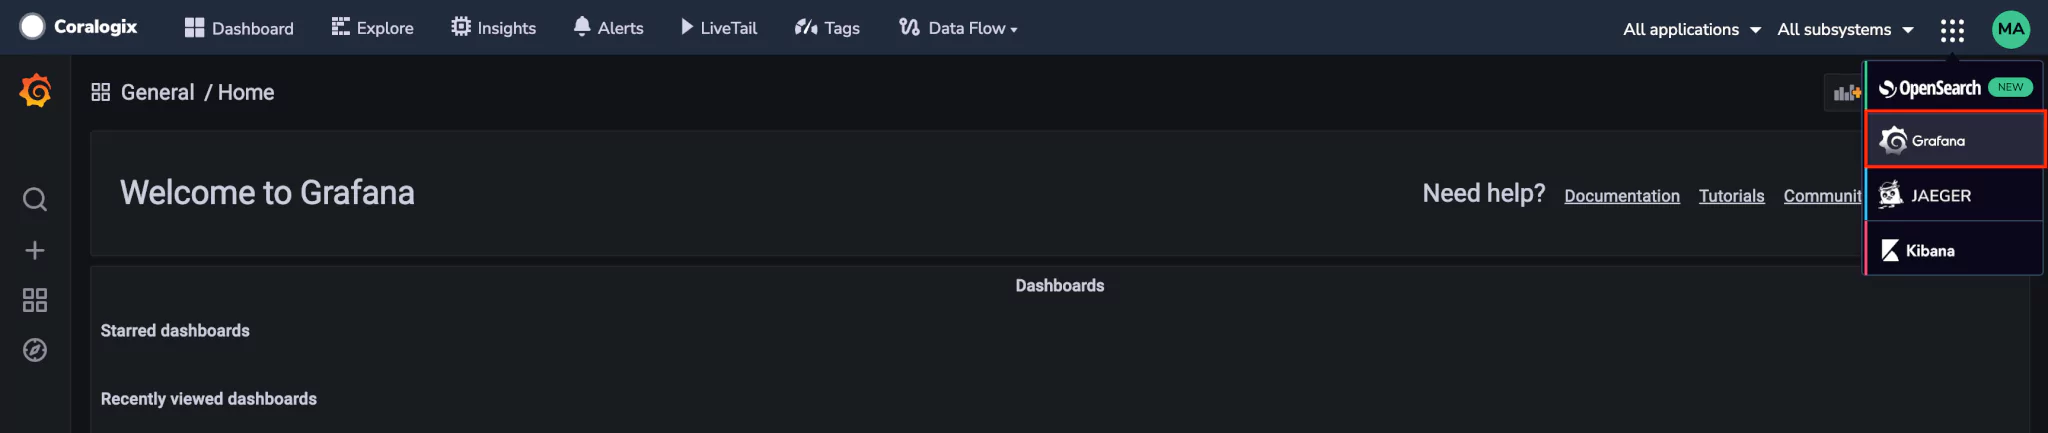
  • View the metrics generated by the project accessing Coralogix-hosted Grafana
Welcome to Grafana

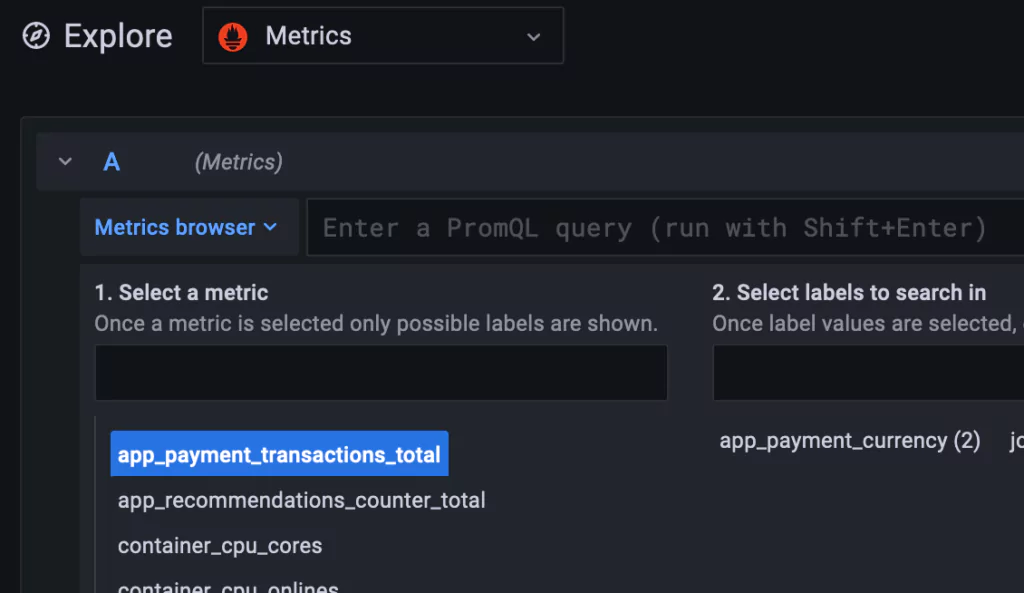
Grafana in the dropdown menu > Select a metric

Select a metric

OTel and Coralogix

The OpenTelemetry Community Demo application is an exciting tool for getting to know OpenTelemetry and its instrumentation best practices. In this blog, we showed how to configure the Demo App to send telemetry data to Coralogix in 6 easy, straightforward steps.

Interested in learning more?

  • Dive into our more advanced OTel Demo tutorial: Tail Sampling with Coralogix and OpenTelemetry
  • Review the OTel documentation on the Coralogix site
  • Check out our awesome, instructional OTel videos
    • Here’s a video on how to integrate traces into Coralogix using OpenTelemetry, Kubernetes & Helm
    • Here’s another on capturing Kubernetes logs, transform with Logs2Metrics, and render with DataMap
  • Contact us! Our world-class customer success team is available 24/7 to walk you through your setup and answer any questions that may come up. Feel free to reach out to us via our in-app chat or by sending us an email at [email protected].

AWS Service Observability using OpenTelemetry 

Effective AWS observability tools can help teams proactively solve problems.

The efficient use of observability statistics is essential to any microservice architecture. OpenTelemetry is a project supported by the Cloud Native Computing Foundation (CNCF) to enhance the observability of microservice projects. AWS Distro for OpenTelemetry (ADOT) is an AWS-supported distribution of the OpenTelemetry project specifically designed to improve the observability of AWS projects. 

Observability Data

Observability data includes metrics, traces, and logs, and each of these data types is integral in understanding the status of your system. 

Observability Standards in Industry

Cloud applications are complicated. Whether you are a small company or a large service, this isn’t something to underestimate. If you cannot efficiently troubleshoot your system, issues will affect users.

Researchers have published several industrial surveys since distributed systems have become the go-to model for new and upgraded software solutions. Distributed systems have improved aspects of software creation by separating pieces of the infrastructure, making them simpler to edit without affecting the entire system. However, distributed systems have also brought about new issues with observability. These include:

Scale and complexity of data: this is primarily an issue with logs which tend to be more verbose than metrics and races. However, long systems that include traces with hundreds of points or metrics for complicated services can also be complex.

Instrumentation: depending on if you are adding monitoring to existing cloud systems, rebuilding monitoring that isn’t working, or creating a new system with monitoring in mind, instrumentation requires different amounts of work. 

Incomplete Information: troubleshooting microservices is especially challenging without a complete picture of the problem, including logs, metrics, and traces. 

Studies have shown that the three pillars of observability (logs, metrics, and traces) combined provide a method for preventing outages and predicting failures before they occur.  In one study, researchers interviewed individuals from ten companies ranging in size, domain, and deployment type; eight of the ten companies had already implemented a distributed tracing model to augment their existing logging and metric infrastructure. The other two companies were either planning or beginning the implementation of such a model. 

One other industry study, which interviewed individuals from sixteen companies, has shown that company culture and awareness of the usefulness of observability infrastructure in their business model is essential to success when running a distributed system. Often companies might be acting reactively to issues that arise when users experience failures. Developers will be focused on troubleshooting in these situations and reactively implementing ad-hoc solutions without fully realizing the extent of technical problems. Observability infrastructure implemented early can prevent the need for such reactionary work. 

Observability with OpenTelemetry

The OpenTelemetry project enables cloud users to collect all three types of observability data about their cloud services and analyze them. However, the ADOT project currently supports a stable integration for metrics and traces; log integration is still in the beta stage. Developers can use other tools like FluentBit to fill in the log data so all three values can be used to analyze the health of your system. 

Without analytics, the observability data is less useful. Developers and DevOps teams require a way to quickly read and see the system’s health using this data. ADOT can send telemetry data to several observability tools within AWS, such as XRay, OpenSearch, or CloudWatch. Data can also be sent directly or via these other tools to external services such as Coralogix’s observability engine

OpenTelemetry Specifications

OpenTelemetry is an open-source set of APIs, SDKs, tools, and integrations used to create and manage observability data. The project defines an implementation that can make a move to similarly-formatted data without considering your cloud vendor. OpenTelemetry is not a back-end to analyze observability data but provides a means to export data from any cloud vendor to any such back-end. It is a pluggable architecture that AWS has used to create the AWS Distro for OpenTelemetry. 

OpenTelemetry has defined several data sources supported by its infrastructure. 

Log

Logs are the most commonly-used observability tool, spanning all architecture types. A log is a timestamped record of an event in your software. They can be structured (typically JSON) or unstructured. Logs can be used to determine the root cause of an issue. 

In OpenTelemetry, a log is an independent event but may be associated with a span (or a single operation within a trace). OpenTelemetry defines a log as anything that is not part of a trace or metric. 

Metric

A metric represents system performance data measured over time as a numerical value. Metric data includes the measurement itself, the time it was captured, and any relevant metadata. Metrics can be used to indicate both the availability and performance of services. Custom metrics can also be used to measure the performance of more platform-specific data. 

OpenTelemetry defines three metric types: 

  1. Counter: a metric value summed over time
  2. Measure: a value aggregated over time
  3. Observer: a set of values measured at a moment in time

Trace

Traces are used to track the progression of a single request as it flows through services in a platform. Distributed tracing is helpful in microservices since these records track a command from its initialization to its termination.

A span is a unit of work in a trace, and a trace is comprised as a tree of spans completed throughout an application. Spans will show work cone by a single service within a complete request. Each span includes request, error, and duration data that can be used to troubleshoot an application or feature. 

Baggage

Though the three pillars of observability include only logs, metrics, and traces, OpenTelemetry also defines a type called baggage. Baggage is used for propagating name/value pairs used for indexing events in one service with attributes provided in an upstream service. Baggage is used to establish relationships between these events. For example, baggage can be used to add the API user or token that triggered a series of events in a SaaS platform.

ADOT with AWS Compute Services

Since its initial preview release in October 2021, the project has been made generally available with new features added according to the AWS roadmap. AWS supports the ADOT distribution, providing a means to record observability data across different AWS compute services, including tasks deployed using ECS and Lambdas. 

ADOT uses a collector, a set of components combined to handle events. The collector is made up of a:

Receiver: the component which receives data to trace and transforms it to an internally-used format recognized by the processor.

Processor: the component that will transform the received data by adding it or dropping it and then forward it to the exporter.

Exporter: the component which forwards the data to its destination either internal to AWS (e.g., X-Ray) or a file that an external analyzer can then use (e.g., Coralogix Analytics Platform) 

The ADOT collector will forward trace events to AWS X-Ray and metric events to AWS CloudWatch, though these destinations are customizable. From both of these services, data can be sent to third-party tools for further analysis and to predict when issues will arise in the platform.

AWS Distro for OpenTelemetry with AWS Lambda

AWS Distro for OpenTelemetry supports exporting metrics and traces for AWS Lambda using a Lambda layer plugin. Lambda layers provide an easy setup where developers do not need to configure the ADOT code directly; traces will automatically send to AWS X-Ray. Metrics are not yet available for Lambda through the OpenTelemetry Distro, though many Lambda metrics are already automatically available through CloudWatch. 

AWS Distro for OpenTelemetry with AWS ECS

AWS ECS allows you to export metrics and trace data to several services using the ADOT sidecar container built and maintained by AWS as an open-source service. The container will collect and route observability data to your chosen destination. Recent updates to the AWS console allow developers to specify observability data collection during task definition creation. 

Customizations of the ECS task definition and the ADOT configuration are available if custom configurations are required for your use case. 

Collecting Trace Data

Trace data can be turned on in ECS tasks by configuring it in the ECS console. There is no need to add any logic or configurations to the code to get started. Traces appear by default in AWS X-Ray. Customized configurations are available for traces by configuring the ADOT setup. Traces may also be sent to other services or stored in files for export to third-party vendors for analysis.

Collecting Metric Data

Currently, the collection of metric data, or Container Insights, within ECS is in preview. The preview is fully available to all AWS accounts, and users need to be able to handle updates that may come to the service before it is made generally available. 

Container insights can be turned on directly when running a task in ECS. This setting has been integrated into the console for easy access. The same insights are also available if using Amazon Elastic Kubernetes Service (EKS) and Kubernetes on EC2. 

Container insights include information not typically collected with AWS CloudWatch. Container insights give further diagnostic information as metrics to help detect and recover from container issues like restart failures. Collected metrics include CPU, memory, network, and disk usage. Detection can be done using a CloudWatch alarm or sending metric data to third-party services for analysis and alarm.