AWS recently introduced a new Lambda Telemetry API giving users the ability to collect logs, metrics, and traces for analysis in AWS services like Cloudwatch or a third-party observability platform like Coralogix. It allows for a simplified and holistic collection of AWS observability data by providing Lambda extensions access to additional events and information related to the Lambda platform.
Leveraging the release of the AWS Lambda Telemetry API, we have built a newly optimized Lambda extension called Coralogix AWS Lambda Telemetry Exporter to further streamline the collection of logs, metrics, and traces for monitoring, alerting, and correlation in the Coralogix platform.
This post will discuss the benefits of using the new AWS Lambda Telemetry API and cover use cases for leveraging your telemetry data to get you started.
Benefits of New AWS Telemetry API
Prior to the launch of AWS Lambda Telemetry API, Coralogix built an AWS Lambda Extension which collects logs using the AWS Lambda Logs API.
With the launch of AWS’s Lambda Telemetry API, we are now able to support simplified instrumentation for logs, platform traces, and platform metrics with enhanced observability for your Lambda execution environment lifecycle. The Telemetry API provides deeper insights into your Lambda environment with support for new platform metrics and traces.
Getting Started with Coralogix AWS Lambda Telemetry Exporter
If you have previously used the Coralogix AWS Lambda Extension the deployment process is very similar. You can use the Coralogix AWS Lambda Telemetry Exporter as a richer replacement for the Coralogix AWS Lambda Extension. You will need to adjust the configuration!
For more information about the Coralogix AWS Lambda Telemetry Exporter visit our documentation.
Enhanced Observability Use Case
Unlike its predecessor, Coralogix AWS Lambda Telemetry Exporter augments logs from Lambda functions with a span ID, making it easier to analyze related logs and traces in the Coralogix platform.
Observing Lambda Latency
A major benefit of the AWS Lambda Telemetry API is that it provides additional information about the initialization of the AWS Lambda execution environment and other valuable performance indicators. We can collect that information with the Coralogix AWS Lambda Telemetry Exporter and use Coralogix tracing features to better understand latency of Lambda functions.
Example: Cold start of Java Lambda
Let’s review an example of a Lambda function written in Java. Typical response times of that function vary between 300ms and 1500ms. We can get a better understanding of what’s happening by looking at the traces.
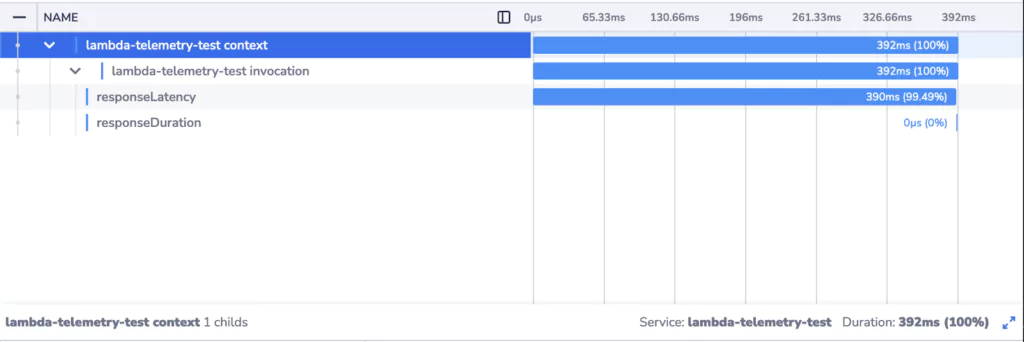
Trace of a warm start Lambda function invocation:
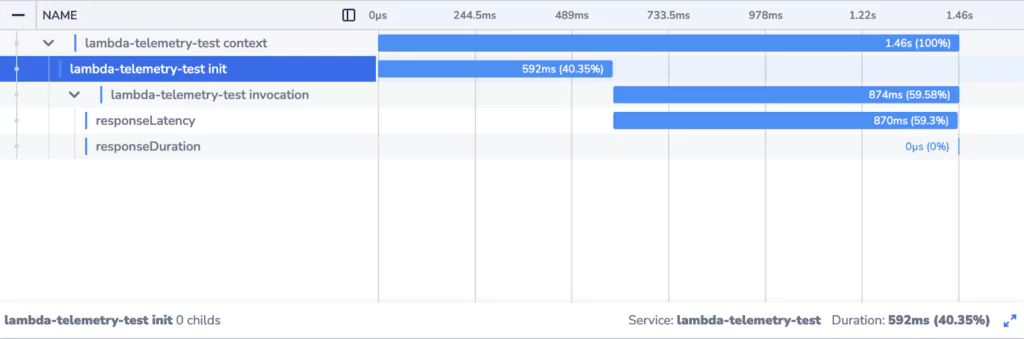
Trace of a cold start Lambda function invocation:
We can clearly see that when a new Lambda instance is initialized, the response times are much higher. There’s an additional element in the trace corresponding to initialization of the Lambda execution environment. The effect of waiting for the initialization to complete is compounded by the fact that the invocation is itself slower.
Knowing that this is a fresh Lambda instance helps us understand why. The first invocation of the function involves initialization of the function code and dependencies. Platforms utilizing Just-In-Time compilation (Java/JVM being an example of such a platform) in particular will experience longer durations for the first invocation.
Visibility into the initialization process provided by Telemetry API enables you to be better prepared to deal with cold start invocations of your Lambda functions and more quickly detect and address abnormal latency and performance issues.
Lambda is a top-rated compute service available on the AWS cloud service network. Its popularity largely derives from its ease of use, allowing users to run Lambda functions reliably without provisioning or managing servers. Lambda can be triggered manually or by any linked events in the AWS network, including DynamoDB streams, SQS, Kinesis, and more.
To use Lambda in a production setting, you must consider more than just the development time you save using Lambda. Developers and DevOps professionals need to watch functions for code errors and potential infrastructure optimizations. These settings include memory, duration, concurrency. As well, tracking error rates and causes, throttles from the AWS platform, and AWS delivery failures will contribute to the overall health of your system.
Having clear and easily-analyzed metrics, logs, and traces are keys to a well-observed architecture. AWS provides some observability capabilities for Lambda with AWS CloudWatch. Lambda Extensions provides various partner programs that enhance your Lambda observability.
Lambda Observability using CloudWatch
CloudWatch has several internal tools helpful in observing the health of your Lambda functions. These include viewing and searching logs, configuring and using metrics, setting alarms, and configuring rules to trigger other events.
CloudWatch features have grown significantly over the last several years enabling developers to have more insight into their Lambda functions. Some enterprises also want to augment the capabilities of CloudWatch using third-party tools that have different features than those provided by AWS. Coralogix’s log analytics tool can automatically detect unusual behavior in functions and alert you of the need for intervention. Developers can use AWS and third-party Lambda observability tools together, or they may choose to use one or the other.
Turning Off CloudWatch in Lambda
CloudWatch is the defacto observability tool for Lambda. It is automatically linked to Lambda no matter what method you use to deploy your function. You generally need to turn it off actively if you do not want to use it. If you use the Serverless Framework, the deployment process will automatically add log policies and groups for each Lambda function in the service. Users suggest declining permissions for CloudWatch in the IAM roles section to remove logging events, as shown below.
Lambda Extensions is used to plug your Lambda function into supporting tools. AWS partners like Coralogix may provide tools, or you may write your own. You would choose to utilize an Extension instead of in-line functionality when users want to send telemetry data to another vendor or when users need to collect and use data over a long period or across concurrent Lambdas.
Lambda Extension Use Cases
Lambdas are short-lived, stateless functions, making it challenging to observe valuable data. Lambda Extensions provide more ways to integrate with and monitor your Lambda functions and your execution environment.
Since Extensions initialize before your Lambda function is invoked and shut down after your Lambda function is complete, you will be able to capture metrics during all phases of your Lambda’s lifecycle. Available metrics include previously-hidden data before and after function invocations.
Lambda’s being stateless can sometimes mean maintaining databases simply to hold state. You can use Lambda Extension to store configurations and settings and reduce the need for extra infrastructure.
Extensions can also be used to log and alert you on security issues that may arise during a Lambda’s execution. You can add up to ten Extensions per Lambda function using up to five Lambda layers or a container image.
Available Extensions for Lambda Observability
Extensions built by third-party teams can be found in the AWS Serverless Application Repository. These include simple examples to help you test out using Extensions and Extensions that enhance Lambda Observability. This repository does include applications that are not used for Extensions, so be aware of your chosen application’s use.
Third-party teams like Coralogix have provided Lambda Extensions that connect your function’s logs with their machine learning tools. The Lambda Extension allows you to send log and metric data directly to analytics platforms. If all the analytics are done in a third-party tool, you may turn off CloudWatch to reduce the cost incurred running the Lambda. Previous to Lambda Extensions, log and metric data had to be sent using CloudWatch, but now that service can be bypassed.
Once Lambda log and metric data are in the Coralogix platform, our service can provide insights into the health and maintenance of your AWS Infrastructure. Our AWS Obervability solution can collect data from across your AWS account, using it to detect and provide alerts on anomalous activity. Its Log Analytics platform can provide insights specific to your Lambda function’s behavior to ensure it is working as expected.
How to Add Extensions
Lambda Extensions can be added no matter how you build your Lambdas. When using Lambda container images, you build the Extension image using Docker’s CLI or AWS SAM with a Dockerfile. When using deployment methods such as Serverless Framework or Terraform, you use the same methods of deploying Lambda Layers to deploy Lambda Extensions. Environment variables need to be added here to invoke Extension capabilities. Instructions on how to add Extensions built by third-party teams like Coralogix are readily available.
Internal and External Extensions
Lambda Extensions come in two flavors: internal and external. External Extensions run independently of the Lambda execution environment and are not limited by Lambda’s runtime or coding language. Internal Extensions use the same runtime process as the Lambda and use wrapper scripts or other in-process tools that depend on your chosen language.
Internal Extensions allow you to modify the runtime process. You can use them to add parameters to the runtime and collect metrics otherwise not available. They can also be used to pre-load functionality without modifying your actual Lambda function. This feature is useful when you have many Lambdas or Lambda services that should use the same startup routines. Internal Extensions may be run using environment variables dependent on the used language or run using wrapper scripts.
External Extensions run as a separate process from your Lambda. They can start before Lamba’s runtime and continue after the Lambda runtime completes. They can also be triggered to run before the container running the Lambda stops to provide metrics.
Performance and Execution of Lambda Extensions
Lambdas use a secure and isolated execution environment. Lambda Extensions run in the same environment as your Lambda function. They are extracted from a Lambda layer during the init phase of execution, and the Lambda will start all attached Extensions in parallel.
The Extensions must be initialized completely before your Lambda function can be invoked. Ensuring a fast initialization time for your Extension is critical; otherwise, you may add latency to your Lambda functions and slow down regular processing times.
The size of the Extension will count towards the total Lambda deployment package size. The Extension will also share memory, CPU, and storage with your Lambda. Offloading intensive computations to an Extension can increase your function’s duration and memory usage, and allocating more memory to a function can increase the function’s throughput.
Cost
AWS charges users for any Lambda execution time consumed by the extension. The cost is broken down in one millisecond increments just as regular Lambda runtimes. There is no charge for the installation of your Extensions to Lambda.
Note that the cost of running Lambdas does increase per unit time as you increase the memory allocation. While increasing memory may be required to improve the speed of calculations, cost should be considered in this infrastructure design. You need to optimize memory allocation throughout time and cost based on these settings and the needs of the Lambda function.
Security
Lambda extensions share resources with the Lambda function. Resources such as memory allocation, CPU, and environment variables are shared. This includes sharing IAM roles, meaning that the Lambda extension has access to everything your Lambda function does. Keeping with AWS’s recommended security principles of allowing access to only required infrastructure is critical to securing your Lambda function and its associated extensions. Further, if the extension needs access to some AWS service, it should be included in the IAM roles of the Lambda, even if that access is only needed for the extension.
Summary
Lambda Extensions is a new, fully available service used to plug in extra functionality to Lambda runtimes. The typical use-case it provides is to streamline data exports to third-party observability tools like Coralogix’s machine learning platform. Using Lambda Extensions can save on your AWS bill because it allows you to bypass CloudWatch, which was previously required to export data automatically.
Modern computing has come a long way in the last couple of years and the introduction of new technologies is only accelerating the rate of advancements. From the immense compute power at our disposal to lightning-fast networks and ready-made services, the opportunities are limitless.
In such a fast-paced world, we can’t ignore economics. Services are dormant most of the time only to be woken up to a certain peak or two every day, and paying for server time that isn’t being used can be incredibly expensive.
When AWS observability was introduced Lambdas as their serverless compute solution, everything changed. Why maintain servers and all the wrappers around it when you can just focus on the code. In the last couple of years, we’ve seen more and more workloads being migrated to serverless computing with AWS Lambda functions.
Now there’s a new generation of Lambda that offers even more savings based on ARM CPUs. Arm-based Lambda functions can get up to 34% better price performance over x86-based Lambda functions. And with the world going towards a greener, cleaner world we really all win by getting more power for less carbon footprint. These are exciting times!
AWS Lambda: The Story So Far
But what about the Lambda itself you ask? Lambda started from a basic container or a “wrapper” of sorts for one’s code. As the service gained more traction, more features and extensions were added to it along with various runtimes
Ever since AWS began offering EC2 instances with ARM hardware, we’ve been asking the question – when will AWS bring this awesome technology, with its lower costs and next-level performance, to the world of serverless. Well, the day has come.
This new generation of Lambda is basically the same service but runs on hosting nodes utilizing Graviton2 – ARM64 architecture CPUs.
How we are using the next-gen Lambda
As an AWS Advanced Technology Partner, we at Coralogix were happy for the opportunity to test the next generation of Lambda.
As part of the beta, we created an ARM version of our Lambda extension and tested our SDKs to make sure that when you need them they will be ready for you (and they are!).
Lambda is built with a plug & play infrastructure, meaning you can connect any service you need to it – A gateway, a network, a queue, or even a database. This is a great facilitator to the agility of Lambda as a serverless solution.
Logic within your app can be divided into layers, which allows for the segmentation of processes much like decorators in code. We love layers, and we use them too.
In fact, we offer one to facilitate all of your app logging delivery. Our Coralogix extension layer will collect and funnel all of your logs into Coralogix, and we now offer it for both x86 and arm64 architectures.
Both solutions we offer for Lambda are rather simple to integrate and are well documented on our website.
We can offer observability as an SDK for any major platform.
We at Coralogix are all about observability. Regardless of the architecture or the hardware type of the underlying nodes, we know you need visibility into what is happening with your code at any given time.
This is especially true during a migration to a new architecture. Even when the migration is rather seamless, some pieces of code may behave unexpectedly, and we need to be able to identify any issues and resolve them in as little time as possible. With Coralogix, you can achieve full observability for your cloud-native apps in AWS without worrying about cost or coverage.
Serverless computing is on the rise, having already earned the mantle of “The Next Big Thing”. For developers, serverless computing means less concern regarding infrastructure when deploying code, as all computing resources are dynamically provisioned by the cloud provider.
Azure pricing is generally on a pay-as-you-use model and is based on resources consumed – which is in line with modern business principles of “on-demand”, flexibility and rapid scaling.
We’ll look at some of the big players in this space, including what to look out for when considering the right partner when it comes to serverless computing for your organization.
The Serverless Landscape
As technology moved from mainframes to PCs, to the appearance of “the Cloud” in the mid-2000s, there has been a move towards increased efficiency, better use of resources, and lower costs.
A decade later, “serverless” entered the mainstream conversation and is now recognized almost universally. The term has been linked to Backend as a Service (BaaS), such as the authentication services offered by providers like Facebook; or Function as a Service (Faas), where applications with server-side logic are run over stateless containers, and completely managed by 3rd party providers.
This popularity has been further served by leading technology companies offering their own implementations: AWS offering its AWS Lambda since 2014, Microsoft with its Functions architecture for Azure, and of course Google Cloud Functions.
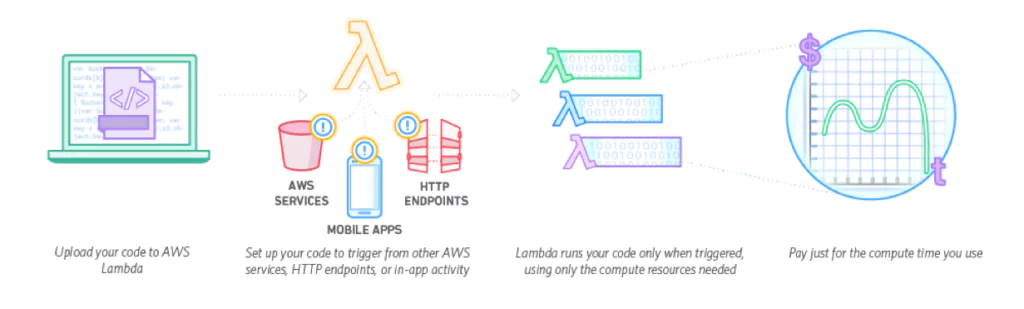
AWS Lambda
AWS Lambda is a serverless computing platform, implemented on top of AWS platforms such as EC2 and S3. AWS Lambda stores and encrypts your code in S3. When a function is requested to run, a “container” is created using your runtime specifications, deployed to one of the EC2 instances in its compute farm, and that function is executed.
When a Lambda function is created, you need to specify things like the runtime environment, memory allocation, roles, and the method to execute. You can build Lambda functions in Node, Java, Python, and C#, and AWS Lambda seamlessly deploys your code, does all the administration, maintenance, and security patches, and provides built-in logging and monitoring through Amazon CloudWatch.
General positive feedback about Lambda is that it’s simple to set up, pricing is excellent, and it integrates with other internal AWS products such as RDS and Elastic Beanstalk.
When it comes to drawbacks of the solution, there have been 2 main areas where there has been criticism:
“Cold Start”: Creating a temporary container (that is subsequently destroyed) can take between 100 milliseconds to 2 minutes, and this delay is referred to as “cold start”.There are various workarounds to negate this, but it is something important to be aware of.
Computational Restrictions: Being based on temporary containers means that usable memory is limited, so functions requiring a lot of processing cannot be handled by AWS Lambda. Again workarounds are available, such as using a step function.
Additionally, there is an element of “lock-in”, as choosing to go with AWS invariably means you’ll be integrating (and become reliant on) other AWS tools and products in the Amazon ecosystem.
Security for AWS Lambda is impressive, starting with securing your code’s access to other AWS services through the built-in AWS SDK, and integration with AWS Identity and Access Management (IAM). Code is run within a VPC by default, or you can choose to configure AWS Lambda to access resources behind your own VPC. AWS Lambda is SOC, HIPAA, PCI, ISO compliant.
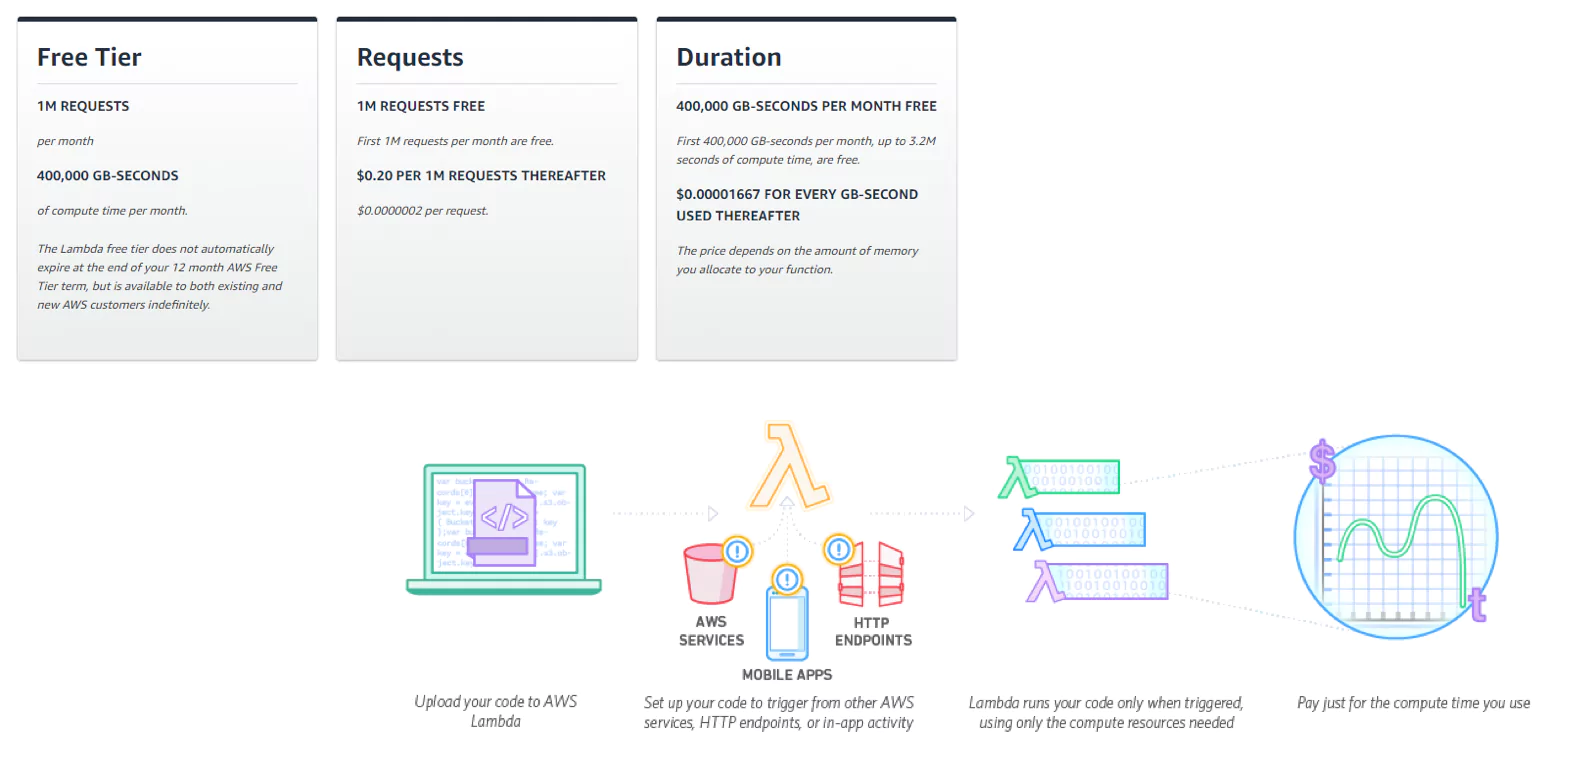
Pricing is per 100ms your code executes, and the number of times your code is triggered – meaning that you don’t pay anything when your code is not running.
The Lambda free tier includes 1m free requests per month and 400,000 GB-seconds of compute time per month. After this, it’s $0.20 per 1m requests, and $0.00001667 for every GB-second used.
Azure Functions
Azure Functions lets you develop serverless applications on Microsoft Azure. Like the other “serverless” solutions, with Microsoft’s Azure, you just need to write the code, without worrying about a whole application or the infrastructure to run it.
Languages supported include C#, F#, Node.js, Java, or PHP, and like AWS Lambda and Google’s Cloud Function offerings, you only pay for the time your code runs.
Advantages of Azure Functions include flexible development, where you can code your functions right in the portal or deploy through GitHub, Visual Studio Team Services, and other supported development tools; the Functions runtime is open-source and available on GitHub; you can use your favorite libraries with support for NuGet and NPM, and integrations with other products in the Microsoft ecosystem.
Integrations are impressive, with the following supported: Azure’s Cosmos DB, Event Hubs, Event Grid, Mobile Apps (tables), Notification Hubs, Service Bus (queues and topics), Storage (blob, queues, and tables), GitHub (webhooks) and Twilio (SMS messages).
Like the other solutions, one of the main disadvantages is vendor lock-in; by going the route of Microsoft Azure, you will in many ways be pinning your colors to the Microsoft mast, which is not for everyone.
Security-wise, you can protect HTTP-triggered functions using OAuth providers such as Azure Active Directory, Facebook, Google, Twitter, and Microsoft Account.
There are 2 types of pricing plans:
Consumption plan: You only pay for the time that your code runs
App Service plan: Run your functions just like your web, mobile, and API apps. When you are already using App Service for your other applications, you can run your functions on the same plan at no additional cost
The Consumption plan is billed on a per-second resource consumption and executions basis.
Execution time is at $0.000016 per GB-second, with 400,000 GB-seconds free per month, and Total Executions is billed at $0.20 per million executions, with 1 million executions free per month.
There are also various support plans available (with an additional cost element).
Google Cloud Functions
Google Cloud Functions is Google’s serverless solution for creating event-driven applications.
With Google Cloud Functions, you can create, manage, and deploy Cloud Functions via the Cloud SDK (Gcloud), Cloud Console web interface, and both REST and gRPC APIs, and build and test your functions using a standard Node.js runtime along with your favorite development tools.
Cloud Functions can be deployed from your local machine or from a source repository like GitHub or Bitbucket.
Pricing
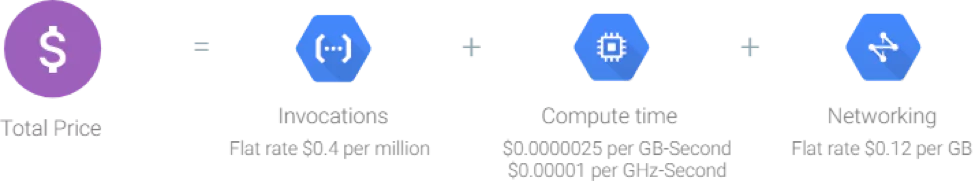
Google cloud functions pricing is based on the number of requests to your functions and compute resources consumption, rounded to the nearest 100 milliseconds, and of course, only while your code is running.
The free tier includes 400,000 GB-seconds, and 200,000 GHz-seconds of compute time.
Advantages of Google Cloud Functions include an excellent free offering to get started ($300 free credit during the first year, and 5GB of storage free to use forever after that), easy integration with other Google Cloud Services like Kubernetes Engine, App Engine or Compute Engine; and detailed and well-managed documentation.
Criticisms of Google’s offering have included high support fees, a confusing interface, and higher (and more complex) pricing.
Serverless Simplicity
Going serverless has a number of advantages, including reduced complexity, lowering administrative overhead, cutting server costs, reduced time to market, quicker software releases, and developers not having to focus on server maintenance, among others. For some, it’s a no-brainer.
When it comes to which solution to go with, particularly when it comes to AWS Lambda, Azure Functions, and Google Cloud Functions, the answer is less obvious.
Each has its own advantages and quirks, and each one will try and tie you into its ecosystem. Overall, it seems that Google is lagging behind from a features perspective and that while Azure is offering a solid solution, AWS Lambda, the oldest on the block, offers a more complete product.
The choice is yours, as we look forward to many more exciting developments in this space.
Serverless computing is becoming increasingly popular in software development due to its flexibility of development and the ability it affords to test out and run solutions with minimal overhead cost. Vendors like AWS provide various tools that enable businesses to develop and deploy solutions without investing in or setting up hardware infrastructures.
In this post, we’ll cover the many different services AWS observability tools provides for supporting serverless computing.
AWS Service Descriptions
To break down which service to choose, we will first look at each of these services’ capabilities and tradeoffs. Each of the tools described here works as a serverless computing engine, but they each have different features that will provide advantages and disadvantages depending on your specific use case.
Ideally, users will understand the project’s requirements before choosing a service to ensure the service meets your needs. Here is a brief description of each of the services we will compare:
Elastic Compute Cloud (EC2)
EC2 is an implementation of infrastructure-as-a-service (IaaS) that allows users to deploy virtual computing environments or instances. You can create instances using templates of the software configuration called Amazon Machine Images (AMIs).
Customizing EC2 is an option, making it a powerful option for experienced users. With the flexibility of EC2 comes additional complexity compared to other solutions when it comes to setting up and maintaining the service. AWS uses EC2 to provide both Fargate and Lambda services to AWS users.
Fargate with ECS and EKS
AWS Fargate provides a way to deploy your serverless solution using containers. Fargate is an implementation of container-as-a-service (CaaS). Amazon Elastic Container Service (ECS) and Amazon Elastic Kubernetes Service (EKS) are other AWS-managed services used to manage containers. In this article, both ECS and EKS are discussed as separate deployment options since they have different features.
Running Fargate on both ECS and EKS allows you to run the required application without provisioning, monitoring, or managing the compute infrastructure as required when using EC2. Docker containers package applications that either ECS or EKS can then launch.
Lambda
Lambda is a compute service that runs without provisioning or managing servers. Strictly speaking, it is an implementation of a function-as-a-service (FaaS). It is a stateless service which will run on an automatically provisioned infrastructure when it is triggered. Many AWS services have a built-in ability to trigger Lambda functions, making them highly functional in AWS designs.
[table id=65 /]
Scalability and Launch Methodology
Each compute service is able to scale to meet the demands of the workload, though each type will scale using a different method. In the case of Fargate and EC2, the user is required to set up autoscaling, while in Lambda this will occur automatically.
EC2
Users may automatically add or remove EC2 instances by configuring EC2 auto-scaling. There are different auto-scaling types used for EC2, including fleet management, scheduled scaling, dynamic scaling, and predictive scaling.
Fleet management will automatically detect EC2 instances that are unhealthy or impaired in some way. AWS automatically terminates and replaces detected functions with new instances to ensure consistent behavior of your compute function.
If the load on EC2 is predictable, users can configure scheduled scaling to add or remove EC2 instances ahead of time. Otherwise, typically users will employ dynamic auto-scaling and predictive auto-scaling individually or together. Dynamic auto-scaling uses the demand curve of your application to determine the required provisioning of your instance. Predictive auto-scaling uses machine learning implemented by AWS to schedule EC2 instance scaling based on anticipated load changes.
Fargate with ECS
Fargate runs tasks (which carry out the required compute logic) within a cluster. The ECS scheduler is responsible for ensuring tasks run and gives options for how a scheduler may instantiate the task. Scheduler options include: using a service to run and maintain a user-specified number of tasks simultaneously, using a CloudWatch Events rule to trigger a task periodically, creating a custom scheduler within ECS which can use third-party schedulers, or manually running a task using the RunTask command from the AWS Console or another AWS service.
Using ECS, tasks may run as always-on. Using tools like ECS services will also ensure that it will restart with a cleared memory cache even if the task fails. While Fargate with ECS cannot be triggered by as many other AWS services as Lambda can, continuously running the task allows you to use library functions to listen for events in other services. For example, AWS Kinesis and AWS SQS can both send events to a task listening for events.
ECS also has auto-scaling capabilities using the AWS Application Auto Scaling service. ECS publishes metrics to CloudWatch, including average CPU and memory usage. These are then used to scale out services according to settings to help deal with peak demand and low utilization periods. Users may also schedule scaling for known changes in usage.
Fargate with EKS
Amazon EKS allows the configuration of two types of auto-scaling on Fargate pods running in the cluster. The EKS cluster can scale with both the Kubernetes Vertical Pod Autoscaler (VPA) and the Kubernetes Horizontal Pod Autoscaler (HPA).
The VPA will automatically adjust CPU and memory settings for your Fargate pods. The automatic adjustments help improve resource allocation within your EKS cluster so pods can work together on the same node more efficiently. To use the VPA, users must install the Kubernetes metric server, which tracks the resource usage in the cluster. The VPA then uses this information to adjust the pod configuration.
Horizontal scaling allows the node to add or remove Fargate pods from the node based on CPU utilization. During setup, users configure a requested utilization percentage, and the HPA will automatically scale to try and hit the given target. Using the Kubernetes aggregation layer, users can also plug in third-party tools such as Prometheus to aid in task scaling and visibility into usage.
Once tasks are running in pods, functionality within the Fargate task is like using ECS. Users may ensure at least some pods are always on having functions running which track events from other AWS services like AWS Kinesis or AWS SQS. Again, there are fewer options for automatic triggering of Fargate functions running in pods than is available for Lambdas.
Lambda
Lambda functions are scalable by design. These functions will launch more instances automatically to handle demand increases. You can limit the number of concurrently running functions if required for your needs, having as little as one instance up to a maximum of 1000 concurrent Lambda functions running at once per AWS account. AWS may increase this number upon request.
When first launched, a Lambda instance requires extra time, or cold-start time, to set up the function’s instance. Once an instance exists, it can launch a new function more quickly. Instances live for 15 to 30 minutes, after which time they are closed if not in use.
You can invoke Lambdas directly using the AWS CLI, Console, and AWS SDK, or use one of the many different AWS services that can trigger Lambda functions. Services that can trigger Lambda include API Gateway, DynamoDB streams, S3 streams, SQS, and many other services. For a complete list, see the AWS website.
Compute Costs
Compute costs in AWS are typically a driving factor in which service to use for creating functions. In general, there is a break-even point for each type of function where one compute service will be the same cost as another.
This point is based on how many requests your function must handle in a period of time, how long each computation must run for, and the amount of memory required to handle your workload. Below is a breakdown of the pricing types available for the compute service types and when it is ideal to choose one option over another.
EC2
When running EC2, the instance requires time to set up resources before use. This initial setup time has some latency. But using the instance repeatedly, startup times will be faster after the initial latency. With EC2, users pay for computing capacity while the instance is running.
Among other considerations, users should consider the tradeoff between instance startup latency and cost in the system’s design. EC2 is well suited for long-running tasks, and a required long-running task may be less costly running in EC2 than other services.
AWS has four pricing models for the user to choose from. These models are On-Demand, Spot Instances, Reserved Instances, and Dedicated Hosts.
In On-Demand pricing, similar to Lambda and Fargate, you pay for what you use based on the region your EC2 instance is deployed. You pay either by the hour or by the second, depending on your EC2 instance setup. This pricing model is well suited for users who cannot predict the load that their EC2 instances will require, or if you have short spiky loads, or while you are developing a new compute function.
Spot instances work similarly to On-Demand pricing in that you pay for what you use. However, users can set a price limit on what they want to pay to run their EC2 instance. If the compute cost is above the user’s set limit, the instance will not run (or will terminate). This could save users significantly if they do not require real-time processing or if the cost to run instances is the most important development factor.
Reserved instance pricing means the user has reserved capacity on the AWS servers. The cost to run the instances is significantly less than On-Demand pricing, but users should only consider this model if they have predictable or steady loads.
With Dedicated Host pricing, users can request a physical EC2 server that will run only their EC2 instances. This is especially useful if users have strict compliance requirements since it gives users control over the physical system their compute code runs on. Pricing with dedicated hosts can be done On-Demand or as a Reserved Instance.
Fargate with ECS and EKS
Like with Lambdas, there is a tradeoff between a task’s duration and the allocated memory resources. Cost per unit time will increase with a higher memory allocation for the function. AWS calculates pricing in the same way for both ECS and EKS clusters running Fargate.
Containers running Fargate tasks will cost users based on the number of vCPUs (virtual CPUs) allocated and memory resources used. Runtime is from when the container pulls images from the ECR until the task terminates. AWS rounds task and pod duration to the nearest second and charges users for a minimum of 1 minute of runtime for each new task or pod. The cost per vCPU hour also depends on the region in which the service is running.
Users can also request spot pricing, which has the same cost model based on vCPU and duration, but both tasks and pods will terminate if the cost is above a specified limit. The spot price is determined by long-term EC2 trends looking at both supply and demand to calculate current EC2 capacity. AWS calculates the spot price at the beginning of each instance-hour for your running instance.
The user may also choose between different pricing models. Choices are to use either on-demand pricing where users pay for run time to the nearest second as the pod uses compute capacity (like with ECS), or savings plans where users make commitments to a consistent amount of usage for 1 or 3 years.
Lambda
AWS Lambdas are limited duration functions. They can only run for a maximum of 300 seconds before the function will timeout and shut down the process, even if the function is in the middle of a process. Depending on what triggers the Lambda, there may be shorter duration limits. If an API Gateway triggers Lambda, the function may only live for 30 seconds.
Lambda bases its pricing on how long a function runs. AWS previously charged the user for every 100ms the function would run. In December 2020, this cost model changed to charging to the nearest 1ms.
Memory limits of the Lambda also affect the cost and runtime of the function. The higher the memory, the faster the function may run, but the more cost per 100ms. Users must analyze their functions to find the most efficient balance between run time, memory requirements, and cost.
Lambda is a proper solution for short-lived, fast tasks but is less suited for long-running tasks. If you are using the Lambda to call another function or API, which may take significant time to respond, you will be increasing the required Lambda duration.
Security
In all cases, security is a shared responsibility between AWS and the user. AWS ensures the security of the infrastructure running in the cloud. You can learn more about how AWS achieves its compliance standards on the AWS compliance programs page.
When you set up any of the compute resources, you must provide permissions to allow the function or container to perform actions on other AWS resources. To do this, you must set up IAM roles assumed by the service while running. Each of the compute options uses IAM. The differences between them are in how the roles are created and maintained.
EC2
EC2 computing requires users to configure and maintain security on multiple parts of the service. Users have full root access to virtual instances and are responsible for securing them. Recommended security practices include disabling password-only access for guests and adding multi-factor authentication (MFA) for access to the instance. Users are also responsible for updating and patching the virtual instance, and this includes security updates.
Amazon maintains a firewall that it forces all traffic to transmit through. EC2 users must set explicit permissions to allow traffic through the firewall to the virtual instance. The firewall settings are not accessible through the virtual instance directly. Instead, users configure using their certificate and key available in the AWS console.
Your AWS secret access key obtained with your AWS user must sign commands to grant API access for launching and terminating virtual machines, changing firewall permissions, and other security functions. This user must have IAM permissions set to perform these maintenance and setup tasks.
AWS IAM is used within the running virtual instance to grant permission for EC2 to use and control other AWS services from within the instance.
Fargate with ECS
With Fargate running on ECS, the permissions are associated with the container the task runs in. The user can select an IAM role to use as the task role when creating the container. You must create the IAM role before you can complete the creation of the container.
The IAM role is formed separately from the Fargate task’s deployment and made using the AWS CLI or manually using the AWS Console. Each container can have its own IAM permissions, restricting service access to the user’s requirements.
Fargate with EKS
Amazon EKS supports IAM for authentication and VPC to isolate clusters, running a single control plane for each cluster. In September 2020, AWS implemented the ability to assign EC2 security groups to individual pods running on EKS clusters. Using security groups for pods, the user can run applications with different network security requirements on shared compute nodes. Before this update, users had to run nodes separately if they required different security requirements.
For running a node with pods on an EKS cluster, users must configure several policies in IAM. The user must configure the pod execution role, which allows the pod to make AWS API calls needed for the pod to set itself up. For example, this role will allow the pod to pull required container images from AWS Elastic Container Registry (ECR).
Lambda
While you can create a lambda using the AWS console, it is more common to use a framework such as Serverless to create Lambda services. The Serverless framework enables the setup of IAM roles that each lambda function or the lambda service will assume while running. The Serverless framework will recreate IAM role definitions each time you deploy the Lambda using Serverless. For more information on setting up IAM roles with serverless, see the Serverless IAM roles guide.
Suppose you are using a different method of deployment which does not integrate IAM role creation. In that case, you can create IAM roles manually in the AWS Console or the AWS CLI and link them to an existing lambda in the Lambda Console.
Summary
With the rising popularity of serverless computing, new tools are coming out all the time to support the organizations that are moving in that direction. Since each tool has different features and their own set of advantages and disadvantages, it’s important to have a clear understanding of the project’s scope before jumping in with the first serverless computing solution you run into.
Regardless of which serverless solution you decide is the best fit for your needs, Coralogix can seamlessly ingest and analyze all of your AWS data (and much, much more) for full observability and the most extensive monitoring and alerting solution in the market.
AWS Lambda enables you to run serverless functions in the AWS cloud, by manually triggering functions or by creating trigger events. To ensure your Lambda functions are running smoothly, you can monitor metrics that measure performance, invocations, and concurrencies. However, even if you continuously monitor, once in a while you are going to run into what’s termed a Lamba cold start. There are various ways to prevent AWS Lambda cold starts. This article explains how to achieve this with log data.
AWS Lambda Performance Monitoring
Monitoring your functions is necessary to verify that functions are being called correctly, that you are allocating the right amount of resources, and to locate bottlenecks or errors. In particular, you should monitor how Lambda interacts with other services, including calls and request times.
Fortunately, Lambda exposes metrics that you can access through the CloudWatch console or ingest with third-party log management tools like Coralogix. These metrics include:
Invocation—includes invocations, function errors, delivery failures, and throttles. You can use these metrics to gauge the rate of issues during runtime and determine possible causes for poor performance.
Performance—includes duration and iterator age. You can use these metrics to better understand the performance of single invocations, average performance, or maximum performance.
Concurrency—includes concurrent executions on both provisioned and unreserved resources. You can use these metrics to determine the necessary capacity of simultaneous invocations and to measure whether you are efficiently provisioning resources.
What Is an AWS Lambda Cold Start?
A Lambda cold start occurs when a new container instance needs to be created for a function to run. Cold starts can happen if it’s the first time running the function, because the function hasn’t run recently, or because the function’s execution places a demand that exceeds the current available capacity of existing instances.
During a Lambda cold start, the function package is loaded into a container, the appropriate configurations are made, and the container is deployed. This process generally takes anywhere from 400 milliseconds to a few seconds, depending on your function language, memory allocation, and code size.
Once you have a function instance, AWS retains it for an indefinite amount of time. If you call the function again, it is already available and can run instantly, eliminating cold starts for that invocation. However, if you exceed the amount of time AWS allows between invocations, your function instance is eliminated. When this happens, AWS must initialize a new instance before your function can run, resulting in a cold start.
3 Ways to Prevent Lambda Cold Starts Using Log Data
When using Lambda, you’re paying for computing time of every second that your function is initializing and running. This means that every time a cold start occurs, you will get charged for that non-productive initialization time. This isn’t a big deal if you’re only occasionally running functions but once you run a function a few million times, this cost quickly adds up.
To ensure that your costs stay low and your performance stays high, you should try to minimize cold starts as much as possible. The following tips provide a fundamental basis for achieving this. Once you’ve implemented these tips, you can move on to more advanced Lambda cold starts optimization methods.
1. Instrumenting Your Lambda Functions and Measuring Performance
To measure your performance you need to deploy and invoke functions in the conditions you want to measure. You can then analyze your metrics to determine performance. This requires invoking your function multiple times, under many conditions, and aggregating the resulting data. The easiest way to do this is through instrumentation.
Two instrumentation tools you should consider are Gatling and AWS X-Ray. Gatling enables you to repeatedly invoke your function and view the resulting metrics in a report with accompanying visualizations. You can also use it to view raw results.
X-Ray enables you to examine end-to-end request traces via the AWS Console. This data includes HTTP calls and AWS stack calls. X-Ray also provides a visualization of your initialization time and a map of your serverless application components that you can use to narrow down bottlenecks.
With the data collected from your instrumentation, you can identify how efficiently your functions are operating and make changes to increase performance. In particular, these metrics can help you identify when your applications are initiating cold starts, providing an accurate baseline for function provisioning requirements.
2. Using CloudWatch Events to Reduce Frequency of Cold Starts
Outside of provisioning function instances, your best bet for reducing cold starts is to try to keep your functions warm. You can do this by periodically invoking the function and sending a request to a small handler function that contains warming logic.
The best way to do this is with CloudWatch Events. You can use this service, in combination with a Cron job to ping functions every 5-15 minutes. However, this method only works for one function instance.
If you need to keep concurrent instances warm, you need to adopt other tooling and use it to interface with CloudWatch Events. One option to consider is Lambda Warmer, a module for Node.js that enables you to warm multiple functions and define custom concurrency levels. It also integrates with the Serverless Framework and AWS SAM.
3. Keep Shared Data in Memory by Loading Outside the Main Event Handler Function
An additional strategy you can employ is to use log data to identify functions that are loading dependencies at invocation. When you have to load dependencies for each invocation, runtime increases. However, you can store these dependencies in your warm function container outside of your handler logic. Any code that is executed outside of the handler will persist in container storage.
Using your log data as a guide, you can modify function packages to use this method. This eliminates the need to import dependencies with each invocation, speeding runtime. Making this change can significantly boost your function performance when used in combination with the above method for warming. Although this strategy does not affect cold starts it does enable you to boost overall performance.
Conclusion
To avoid cold starts, you can instrument your Lambda functions and measure performance. You can also use CloudWatch events to reduce the frequency of cold starts. Finally, you can keep shared data in memory, by loading outside the main event handler function. This serves to lower costs and improve efficiency, creating a more scalable and robust system.
Going serverless relieves you of setting up servers, updating operating systems, or maintaining physical infrastructure. But what happens when a function doesn’t work and things go wrong? Given the added complexity, working in a serverless environment requires engineers to capture the data flowing from functions and their epithermal containers with a centralized Amazon monitoring logging solution.
In this Lambda logging monitoring guide:
Examine what’s important when designing a monitoring and alerting solution for serverless applications
Build a test application and look at how monitoring/alerting could be relevant to it
Deploy the application to AWS Lambda using its serverless framework
Make sure that the errors logged by our Lambda application are not ignored
Planning, Monitoring, and Alerting of Serverless Applications
When planning out a monitoring and alerting solution for serverless applications, there are several factors to take into consideration. We will discuss each of these in turn.
Scalability
How well does your monitoring solution scale when your application grows? One of the main advantages of deploying your applications on a serverless platform is that they can scale nearly indefinitely. Still, you need to make sure that your monitoring solution can keep up.
It should be able to handle your growing application landscape without you manually provisioning the scaling solution. It should be configured to handle large, quickly-growing amounts of data provided by replicated applications, and still be able to evaluate them in real-time.
Integration
Your monitoring solution should be the one place where all monitored data comes together. That’s why it should provide easy-to-use integration points to accept metrics and logs from different systems and applications.
Independence and Reliability
If your application goes down, you must have access to any logs and metrics and be alerted. Then you are in a position to analyze what is happening and to react as quickly as possible. That’s why you’ll want your monitoring and alerting systems to run reliably and independently of your application.
Ease of Use
Let’s face it, if it is a hassle to read through logs or set up alerts, you will end up not doing it. A monitoring and alerting system is only useful if it is actually easy to use and doesn’t bloat your administrative workload.
Separation of Concerns/Loose Coupling
If you want to reap the benefits of cloud platforms, you’ll want to be able to deploy your application to new platforms quickly. Logging shouldn’t stand in the way. You don’t want to be forced to change application code when you change your logging provider or your deployment platform. You don’t want to implement different log-transportation strategies into your application, but rather just write to STDOUT and be sure that your logs are dealt with.
Also, logging large amounts of data can be a time- and resource-consuming task. It can even slow down your core application and introduce production issues. That’s a situation you’ll want to avoid by loosely coupling your application and your logging platform.
General Best Practices
Stream your CloudWatch apps to Lambda – One way of making sure that your logs keep their integrity across applications is to set up streaming of your logs directly to the Amazon MonitoringElasticsearch Service.
Auto-subscribe new log groups – Whenever a new Lambda function is created, it automatically creates a new grouping in your logs. You can enable CloudTrail to recognize new event patterns and handle the subscription process automatically.
Auto-set Log Retention policies – By default Lambda creates new logs for each function with a “never expire” setting for all events. This is understandably overkill and can fill up your log files with a great deal of unnecessary data, resulting in a reduction in your signal to noise ratio. You may wish to change this setting to auto-expire logs after a certain number of days.
A Sensible Architecture for Logging in Cloud Environments
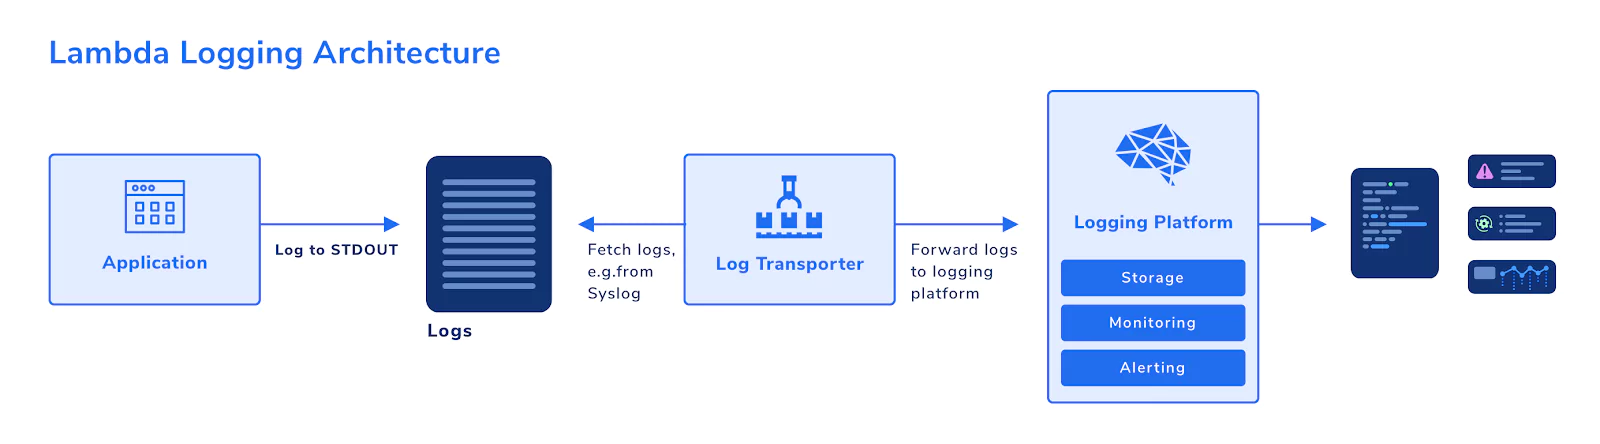
So, how can you set up logging to comply with these requirements? A basic, yet scalable architecture could be designed like this:
Your application simply logs out to STDOUT, for example, using console.log. Writing to STDOUT is all your application needs to know about logging. In this way, you have separated your application logic from your logging activities.
A log transporter then fetches the logs from where they are stored temporarily after writing to STDOUT, e.g., from Syslog. It then forwards new log entries to the logging platform. Your logging platform: stores the log data, has monitoring capabilities, and can alert you to noteworthy events.
Using this pattern, you can ensure that your application remains decoupled from your logging platform. If your system goes down, the relevant logs will still be available in the logging platform.
Also, you enable scalability. Your applications can scale as you please without the need to think about transporting large amounts of log data. You can simply increase the number of log transporters, or change the transport strategy altogether, without affecting your application at all.
The ELK Stack
A classical way of implementing an architecture like that is using the ELK stack. It’s made up of three main components:
Elasticsearch–a search engine and indexer for log data.
Logstash–a log transporter that can accept logs from a wide variety of input channels and formats and can transform (if required) and forward them to output channels, for example, Elasticsearch.
Kibana–a data visualization dashboard that reads and presents data from Elasticsearch.
The ELK stack applies the requirements mentioned above and makes up one of the most widely-used logging platforms. There are a number of cloud-based SaaS platforms that provide you with an ELK stack, for example, Coralogix.
Alternative Solutions
Cloud platforms such as AWS usually provide their own logging stack. AWS, for example, has CloudWatch, which can collect logs from services running on top of AWS, and provides basic stream and search functionality for log data.
When you run single applications that aren’t too complex, using CloudWatch exclusively can be an option. However, when your application consists of multiple components that log data, or when it combines services that run inside and outside of a cloud platform, you’ll quickly reach the limits of that solution. You’ll want a central view on your entire application and the chance to not just read, but to analyze and understand your data. Therefore, it will often make sense to make your logs available in a dedicated logging platform.
Even when doing so, CloudWatch and similar services will play a role in your architecture. They collect your application logs inside your cloud platform and make them acc log transporter.
Let’s get our sleeves rolled up and our hands dirty. We’ll build a demo application using the Serverless framework and deploy it to AWS Lambda. Then we’ll find a potential error scenario in the application and set up monitoring and alerting for that.
Prerequisites
For this article, we assume that you have both Node.js and npm installed. If not, please go to Node.js for instructions.
Set up AWS
If you already have your AWS CLI configured, you can skip this section.
To get started, you’ll need an AWS account. If you don’t have one yet, just follow the instructions on the AWS Portal.
Also, you’ll need to have the AWS CLI (Command Line Interface) installed. You can find instructions in the AWS Documentation.
To make sure that the CLI can work with your AWS account, get an AWS Access Key ID and an AWS Secret Access Key by following the instructions here.
Install the Serverless CLI on your computer by running:
npm i -g serverless
Create the Example Application
Event Handler
Create an empty folder somewhere on your computer. Now create a handler.js file with the following contents:
module.exports.greet = async event => {
    const body = JSON.parse(event.body);
    if (!body.name) {
        throw new Error('No name provided');
    }
    return {
        statusCode: 200,
        body: JSON.stringify(
            {
                greeting: `Hello, ${body.name}`
            },
            null,
            2
        ),
    };
};
This script defines an event handler called greet. When an HTTP request is sent to our application, it will be processed by this handler. It parses the request body and checks if the name property is set. If it is not, the handler throws an error. If it is set, it returns a JSON object to the client, greeting the user by this property value (name).
Serverless Configuration
Now to deploy the application to AWS Lambda, we’ll use Serverless. Serverless will read its configuration from a serverless.yml file and take care of the setup and deployment for us. Create the YAML file in the same folder as handler.js and populate it with the following:
This configuration tells Serverless that we’re running a service called greeter on an AWS Lambda stack with Node.js 12. It then defines one Lambda function called greet, and maps that function to the greet function we defined in our handler.js. Finally, it instructs Lambda to listen to HTTP requests coming in under the path / and, therefore, treat them as events in our greet function.
Deploy the Application
We are ready to deploy the application to Lambda. Simply run sls deploy in the same folder that also contains your handler.js and serverless.yml.
You will get an output like the following:
Service Information
service: greeter
stage: dev
region: us-east-1
stack: greeter-dev
resources: 10
api keys:
  None
endpoints:
  POST - https://xxxxxxxxxx.execute-api.us-east-1.amazonaws.com/dev/
functions:
  greet: greeter-dev-greet
layers:
  None
The most important piece of information here is the list of endpoints. In this example, Serverless tells us that we can reach our application under https://xxxxxxxxxx.execute-api.us-east-1.amazonaws.com/dev/. This URL will be unique to you, so be sure to note it down.
Test the Application
Now that we have our application deployed, let’s go ahead and test it by shooting it an HTTP POST request, letting it know that our name is Maria and waiting for a greeting:
Now let’s look at what happens if we change the request slightly. In the handler.js, we expect the name to be handed over in a request body property called name. What happens if, instead, we commit an error and send it in a property called firstName?
$ curl --data '{"firstName":"Maria"}' https://xxxxxxxxxx.execute-api.us-east-1.amazonaws.com/dev/
{"message": "Internal server error"}
Oops, that doesn’t look so good. It doesn’t come as a surprise in this test application (we explicitly throw an exception). But with just this 500 error message from Lambda, all we know is that there was some issue along the way. Our error does not provide information about what the root cause is.
Monitoring and Alerting
Our test application is primitive, and it’s easy to pinpoint the root cause of an error. In a larger application, however, there are many potential causes for errors. A database connection might have failed. A user’s input data might have been poorly formed and not properly handled. A third-party REST API service might suddenly have become unavailable.
We need some way to see what’s actually going on, rather than just receiving a generic “Internal Server Error” message. One thing we can do to analyze the cause of the error is to look into the logs. We can do this using the Serverless CLI:
$ sls logs -f greet
 START RequestId: b01870f3-b5f0-48dd-9cdc-fccfcade4940 Version: $LATEST
 2020-02-01 10:33:24.766 (+01:00)        b01870f3-b5f0-48dd-9cdc-fccfcade4940    ERROR   Invoke Error         {"errorType":"Error","errorMessage":"No name provided","stack":["Error: No name provided","    at      Runtime.module.exports.greet [as handler] (/var/task/handler.js:6:15)","    at Runtime.handleOnce (/var/     runtime/Runtime.js:66:25)"]}
 END RequestId: b01870f3-b5f0-48dd-9cdc-fccfcade4940
 REPORT RequestId: b01870f3-b5f0-48dd-9cdc-fccfcade4940  Duration: 3.91 ms       Billed Duration: 100 ms      Memory Size: 1024 MB    Max Memory Used: 72 MB
That’s already better. It provides the actual exception we throw in our application, so that helps us quickly identify the root cause. But how can we make sure we actually see errors when they pop up without manually checking the logs every time?
Check Logs in CloudWatch
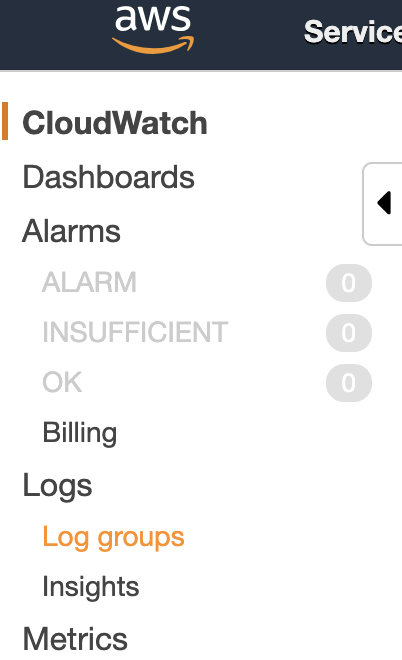
The first step is to make use of CloudWatch. Lambda logging should be stored there. So, open the AWS console log and, from the services menu, open CloudWatch. Now in the left menu, click “Log groups”:
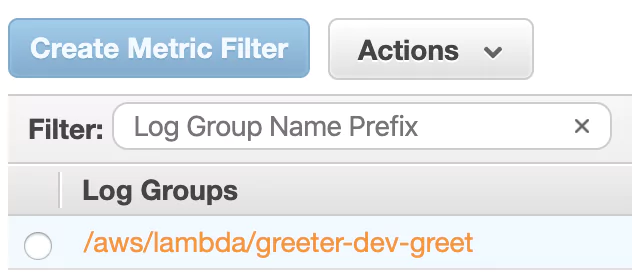
You should see one group for your greeter function (called, for example, /aws/lambda/greeter-dev-greet). A log group is a collection of log streams. The log streams in a log group share some common properties, amongst others: access control and data retention settings.
Click that log group.
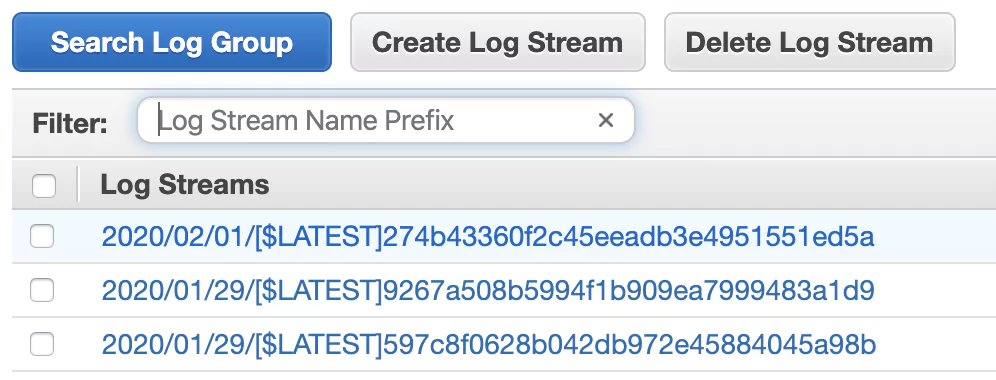
You’ll now see a list of log streams. Each stream contains log messages from one source. Notice that re-deploying a Lambda function can lead to a new log stream being created. Right now, you should see at least one log stream:
Click it and check out the log entries. You’ll see the same messages returned when you pulled the logs using the Serverless CLI earlier.
Send Logs to a Lambda Logging Platform
While you now have a way of collecting and seeing logs using CloudWatch, it’d surely be great to have your logs available in an ELK stack. While it’s easily possible to set up your own ELK stack, it can be cumbersome to get started, to operate it, and to secure it properly. That’s why, for this article, we’ll use Coralogix, a cloud-based observability platform.
So let’s go ahead and send our AWS logs to Coralogix.
Register with Coralogix
First, register for a free Coralogix account. After registration, you’ll receive an email with the subject “Start sending your logs”. It contains a private key, which we’ll need to send logs from AWS to Coralogix. So, be sure to note down that private key.
Set up Lambda Log Transporter
Next, we’ll set up AWS to send its logs to Coralogix. While it is possible to use Logstash for that, Coralogix provides a simple log transporter out of the box.
To get started with it, we’ll set up another Lambda function that simply takes all logs of our test application and forwards them to Coralogix.
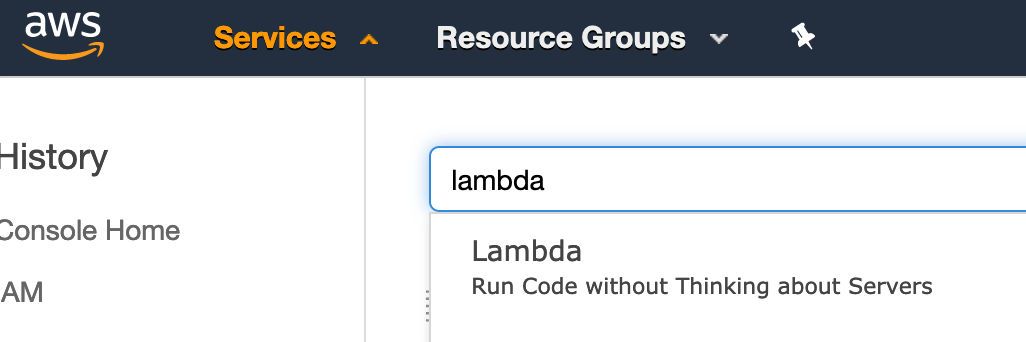
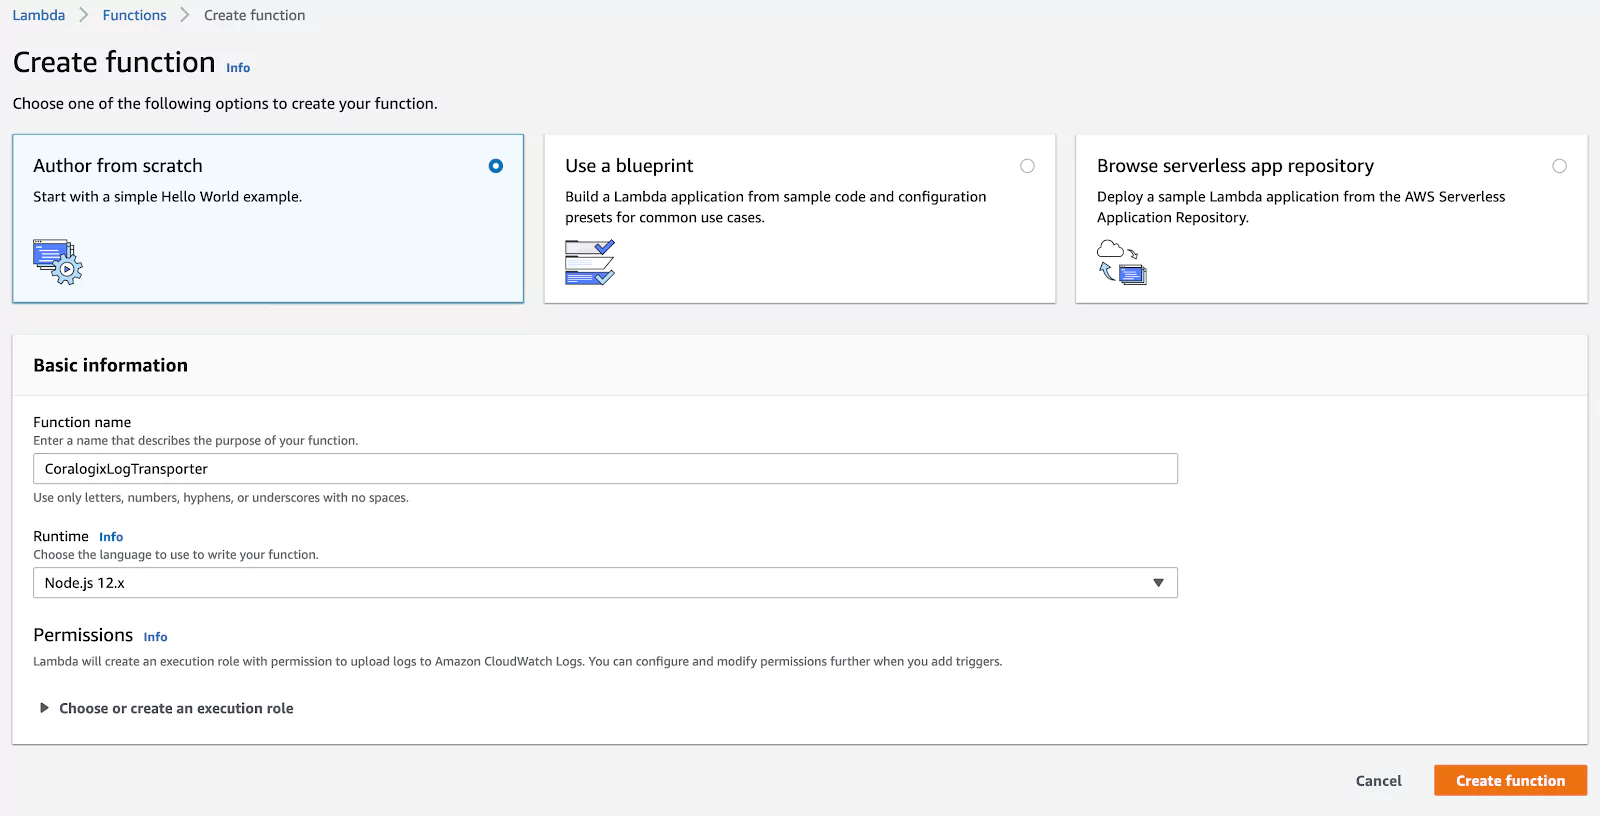
Open the AWS Console, log in and type “Lambda” in the Service menu search field. Then click the “Lambda” entry:
Now click “Author from scratch” to create a new Lambda function. Give it a name (e.g. “CoralogixLogTransporter”) and choose “Node.js 12.x” as the runtime. Then click “Create Function”:
Under “Function code”, paste the following code. This will forward logs from your Lambda applications to Coralogix:
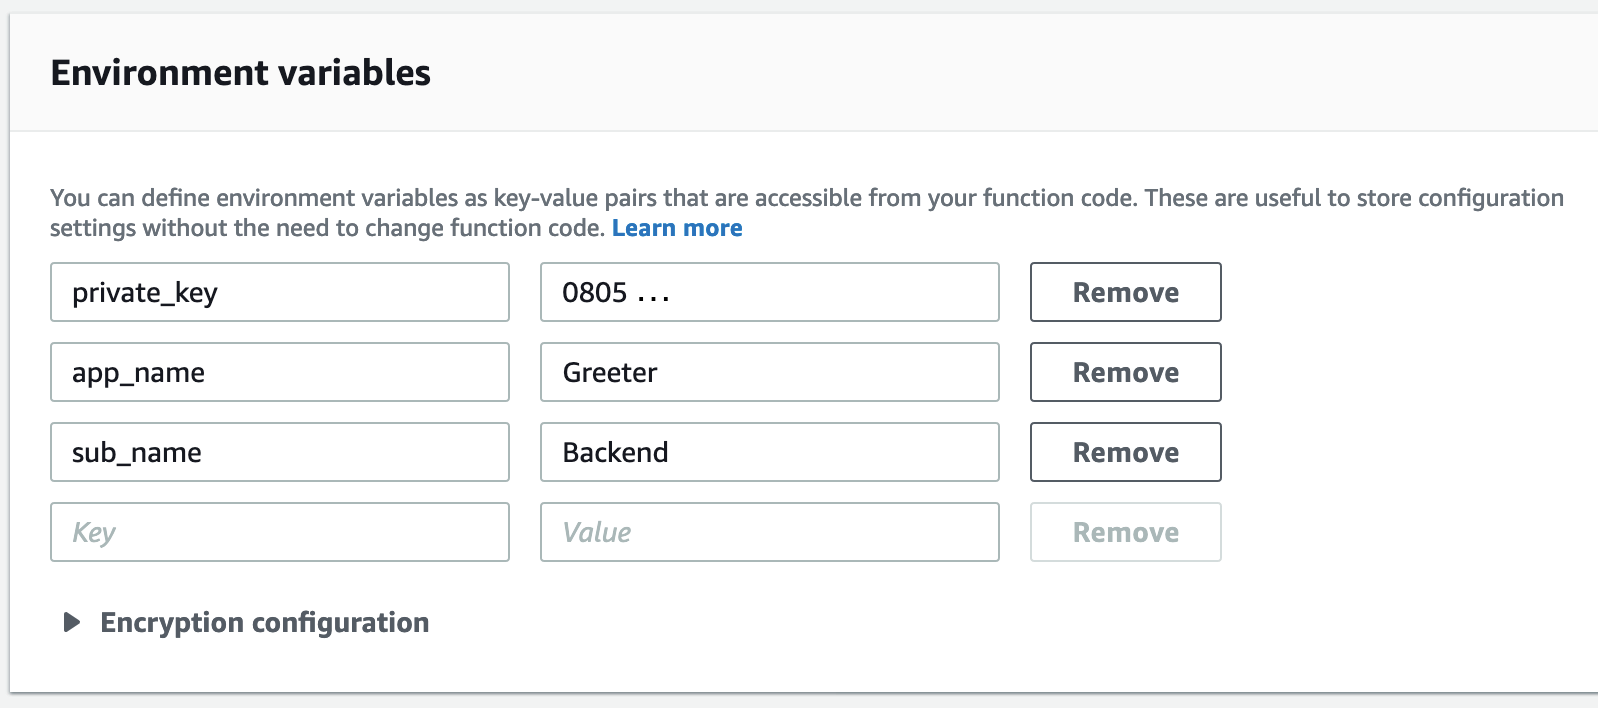
Next, we’ll have to let the log forwarding Lambda function know how to authenticate against Coralogix, and which application and subsystem name to send to Coralogix. These application and subsystem names will be used in the Coralogix user interface to browse logs and set up alerts by application.
Enter the following environment variables:
private_key: The Coralogix private key you noted down earlier.
app_name: A name of your application; in our example: “Greeter”.
sub_name: The name of the subsystem of your application, e.g., “frontend”, backend”, … As our test application is a greeter backend, let’s call it “Backend”.
Add a Trigger to Forward Lambda Logs to Coralogix
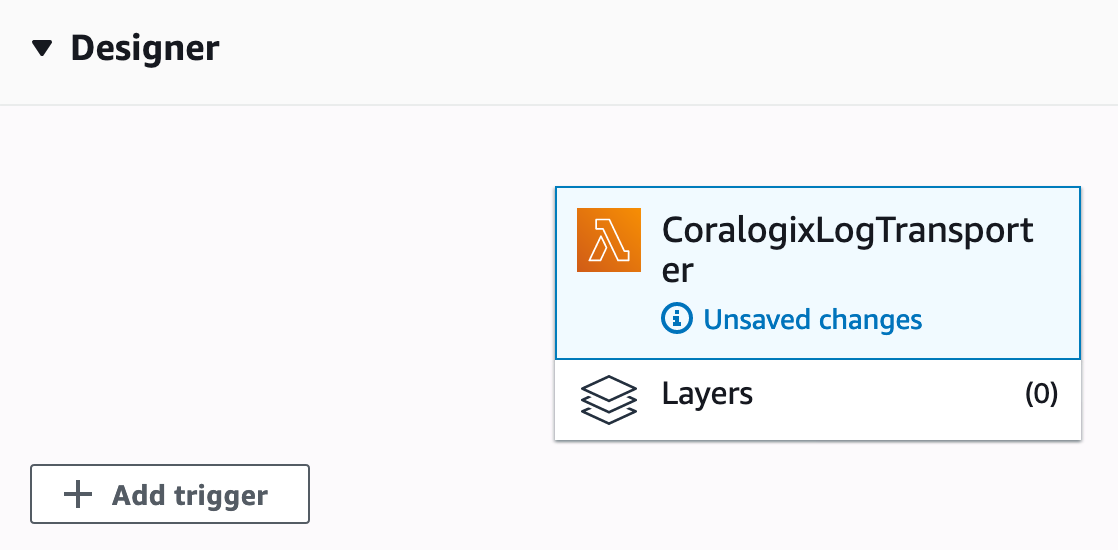
Now, we’ll need to let our log transporter function know to send logs to Coralogix whenever there are new logs available. We do that by clicking “Add trigger” in the Function Designer on the top of the screen:
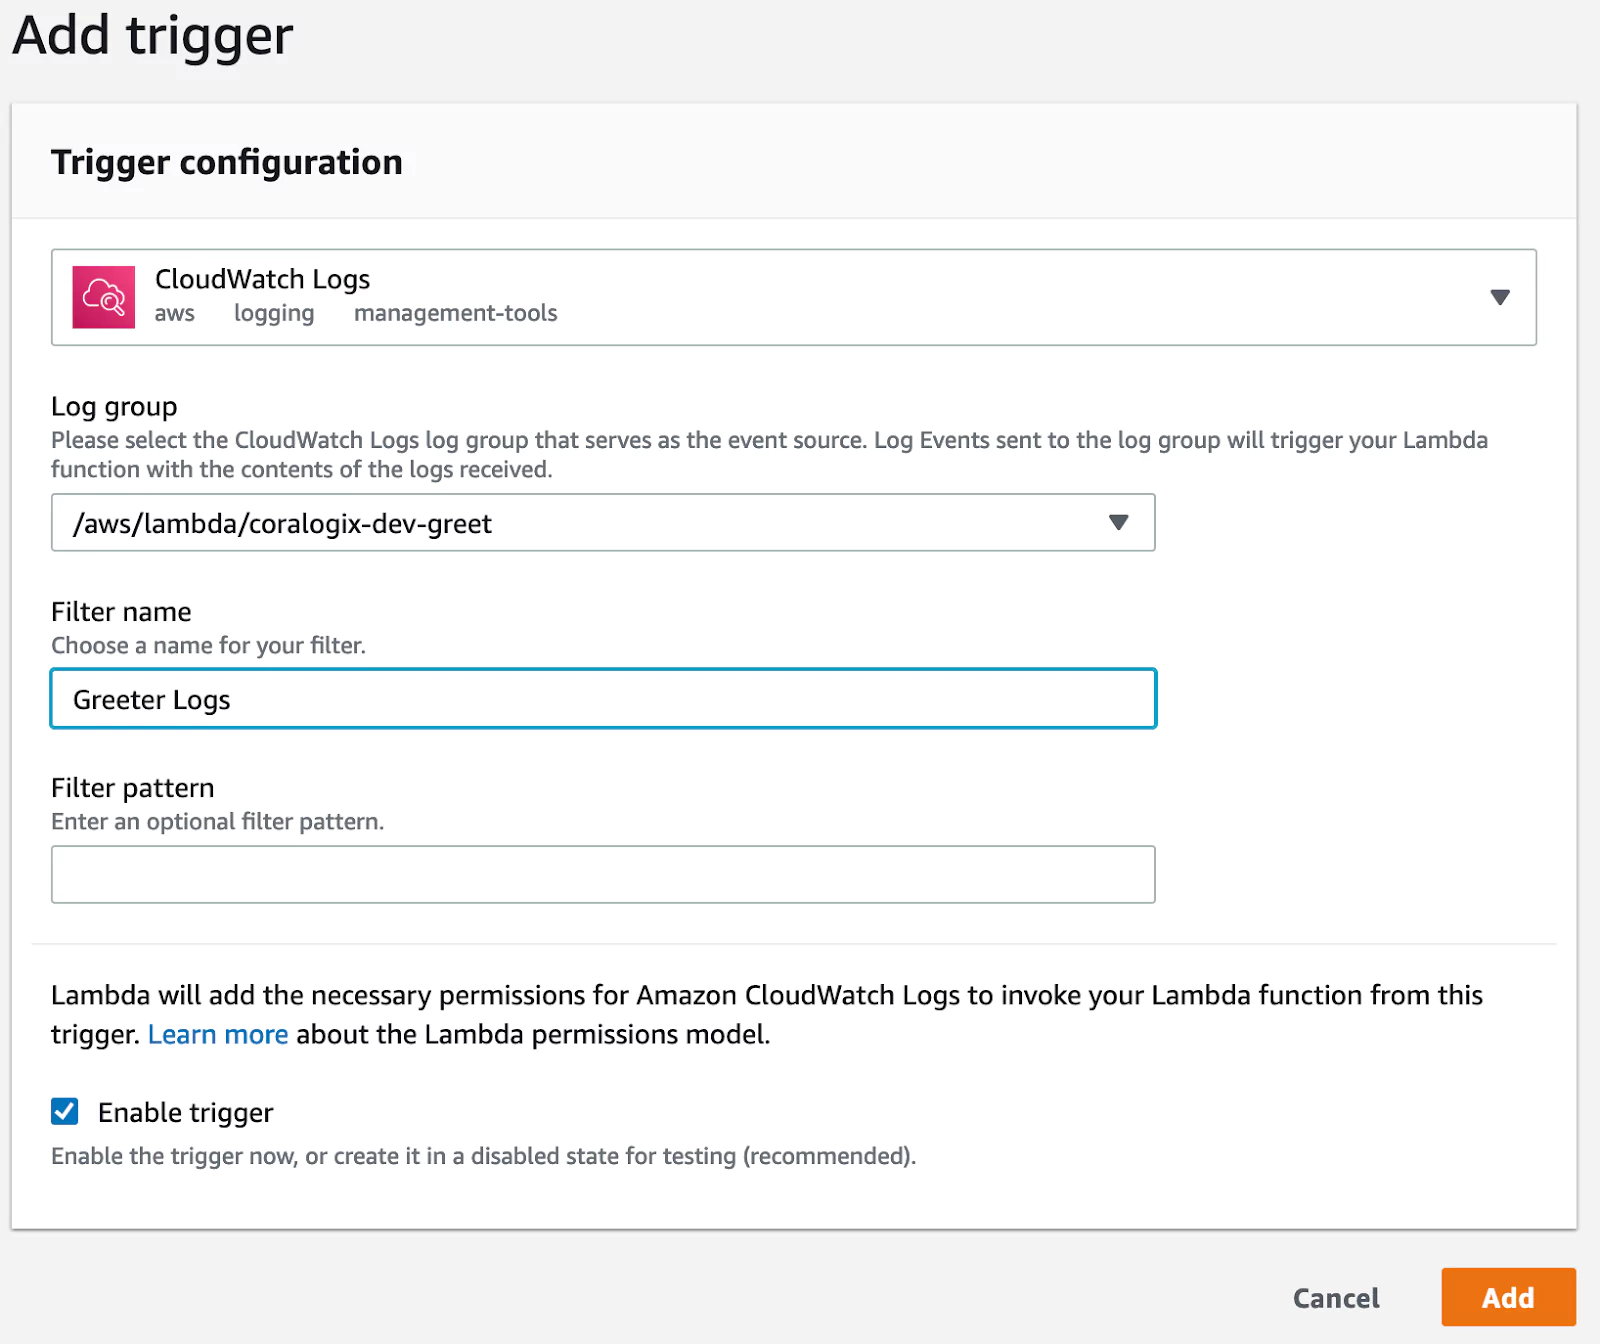
Now let’s configure the trigger. First, choose “CloudWatch Logs” as the trigger type. Then, click the “Log group” dropdown and select your test application. Next, pick a name for this trigger configuration, e.g., “Greeter Logs”, and make sure you enable the trigger. Finally, click “Add”.
Read Lambda Logs
Congratulations, you have set up log forwarding from your test application into Coralogix. Now, you’ll surely want to see your logs stream into Coralogix.
To make sure we have some logs available to see, let’s send two more requests. Make sure you enter your unique Lambda endpoint:
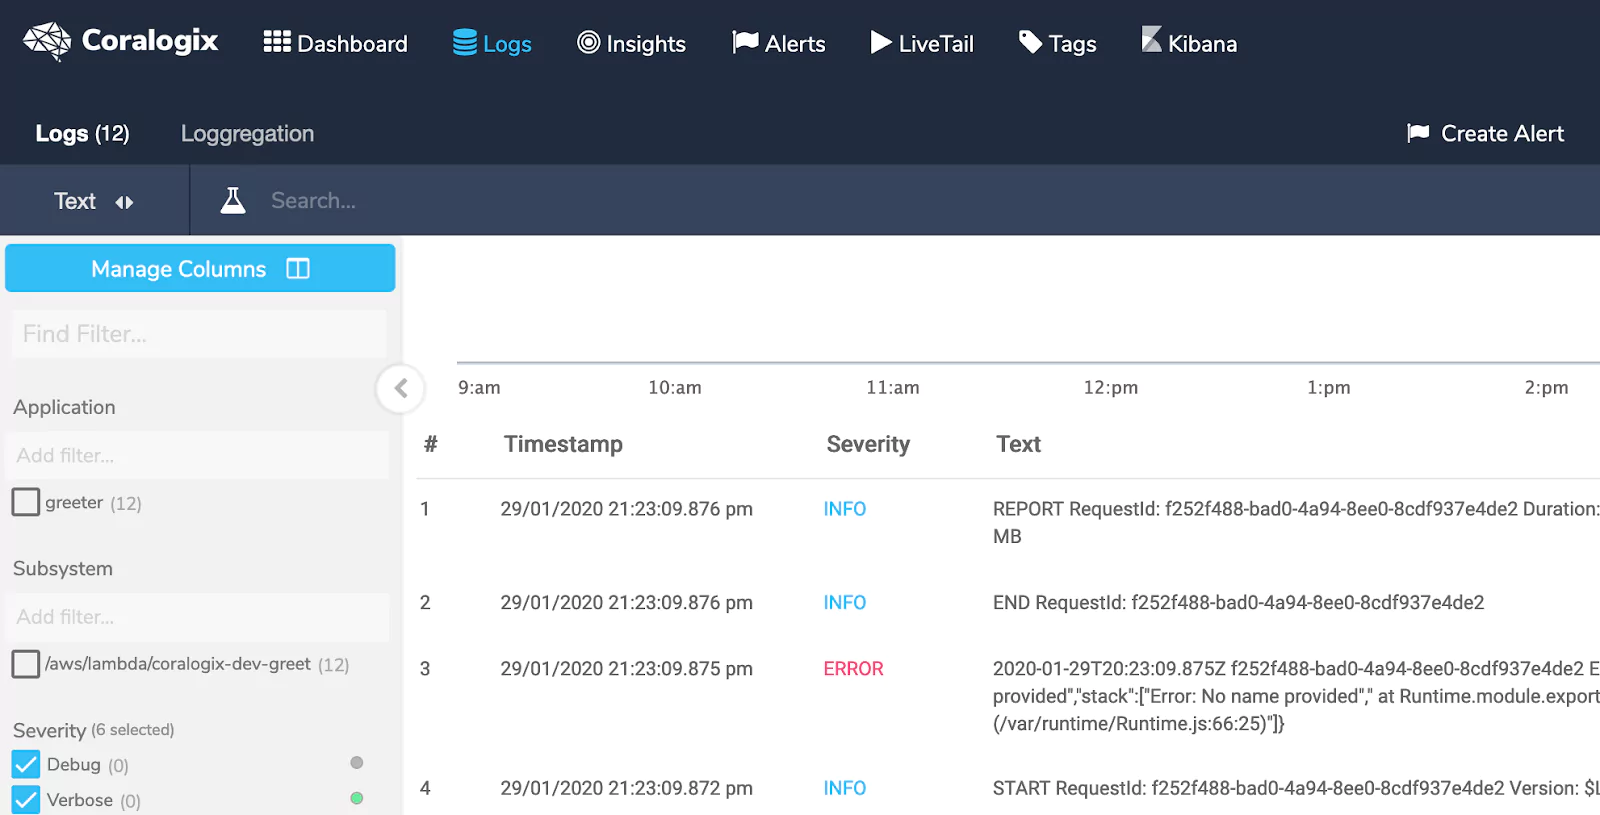
To see the log entries for these requests: Log in to Coralogix, then click “Logs” in the menu. You’ll see at least two log entries: One for the correct request, and another for the faulty one. The correct request will have a severity of “INFO”, while the faulty one has a severity of “ERROR”.
You can browse your logs and filter them using the controls in the sidebar. Additionally, you can filter your log messages by time on the top right.
Set up Alerts
Now that we can see the logs streaming from our application, it would be great to be alerted when there’s an error. So, let’s set up an email alert that will inform us whenever there’s a log message with the severity “ERROR”.
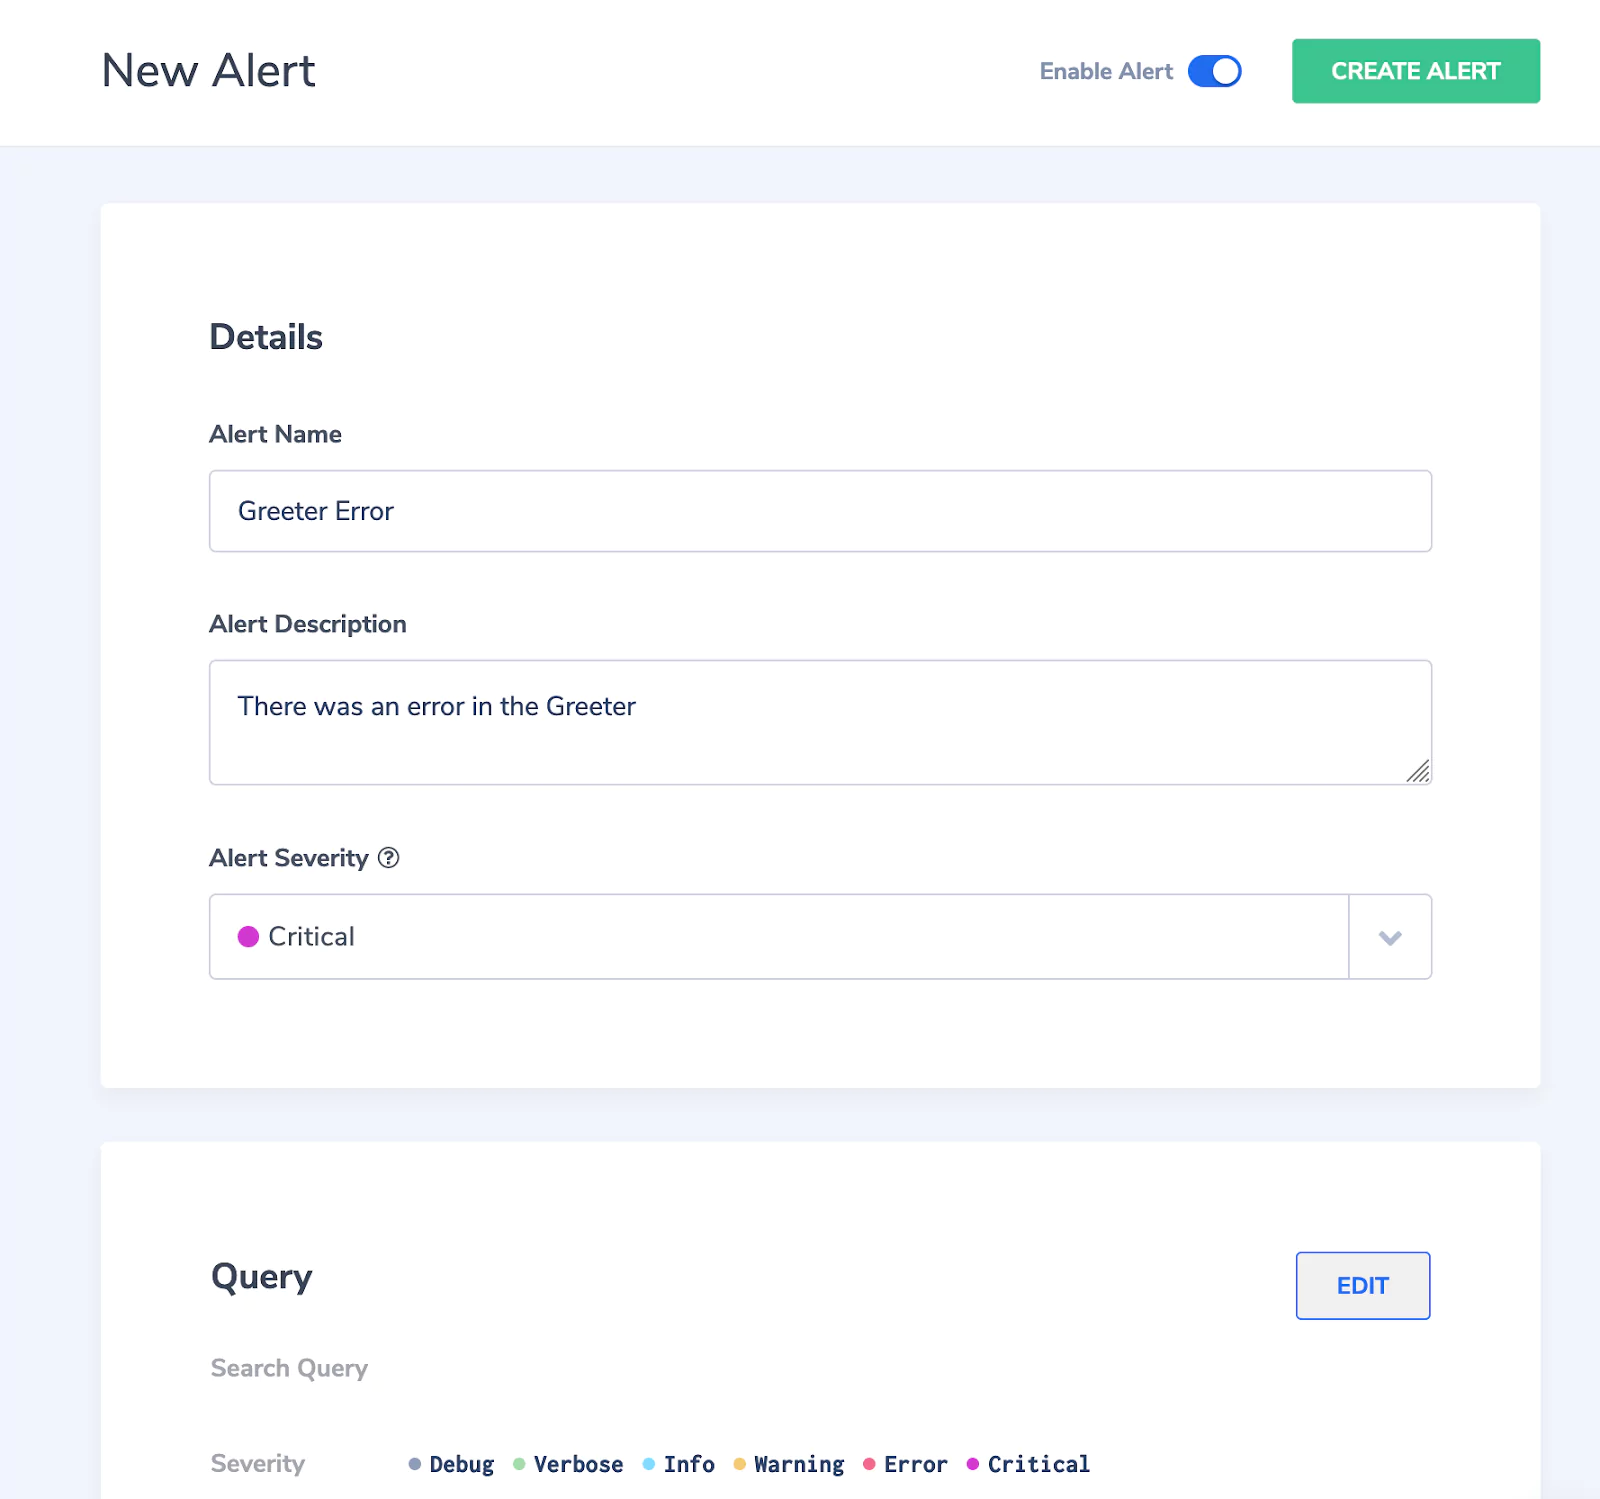
To do so, click “Create Alert” (on the right, just below the menu):
Next, give the alert a name (e.g., “GreeterError”), a description (e.g., “There was an error in the Greeter”), and a severity for the alert (let’s pick “Critical” here). You will receive this information as part of the alert email.
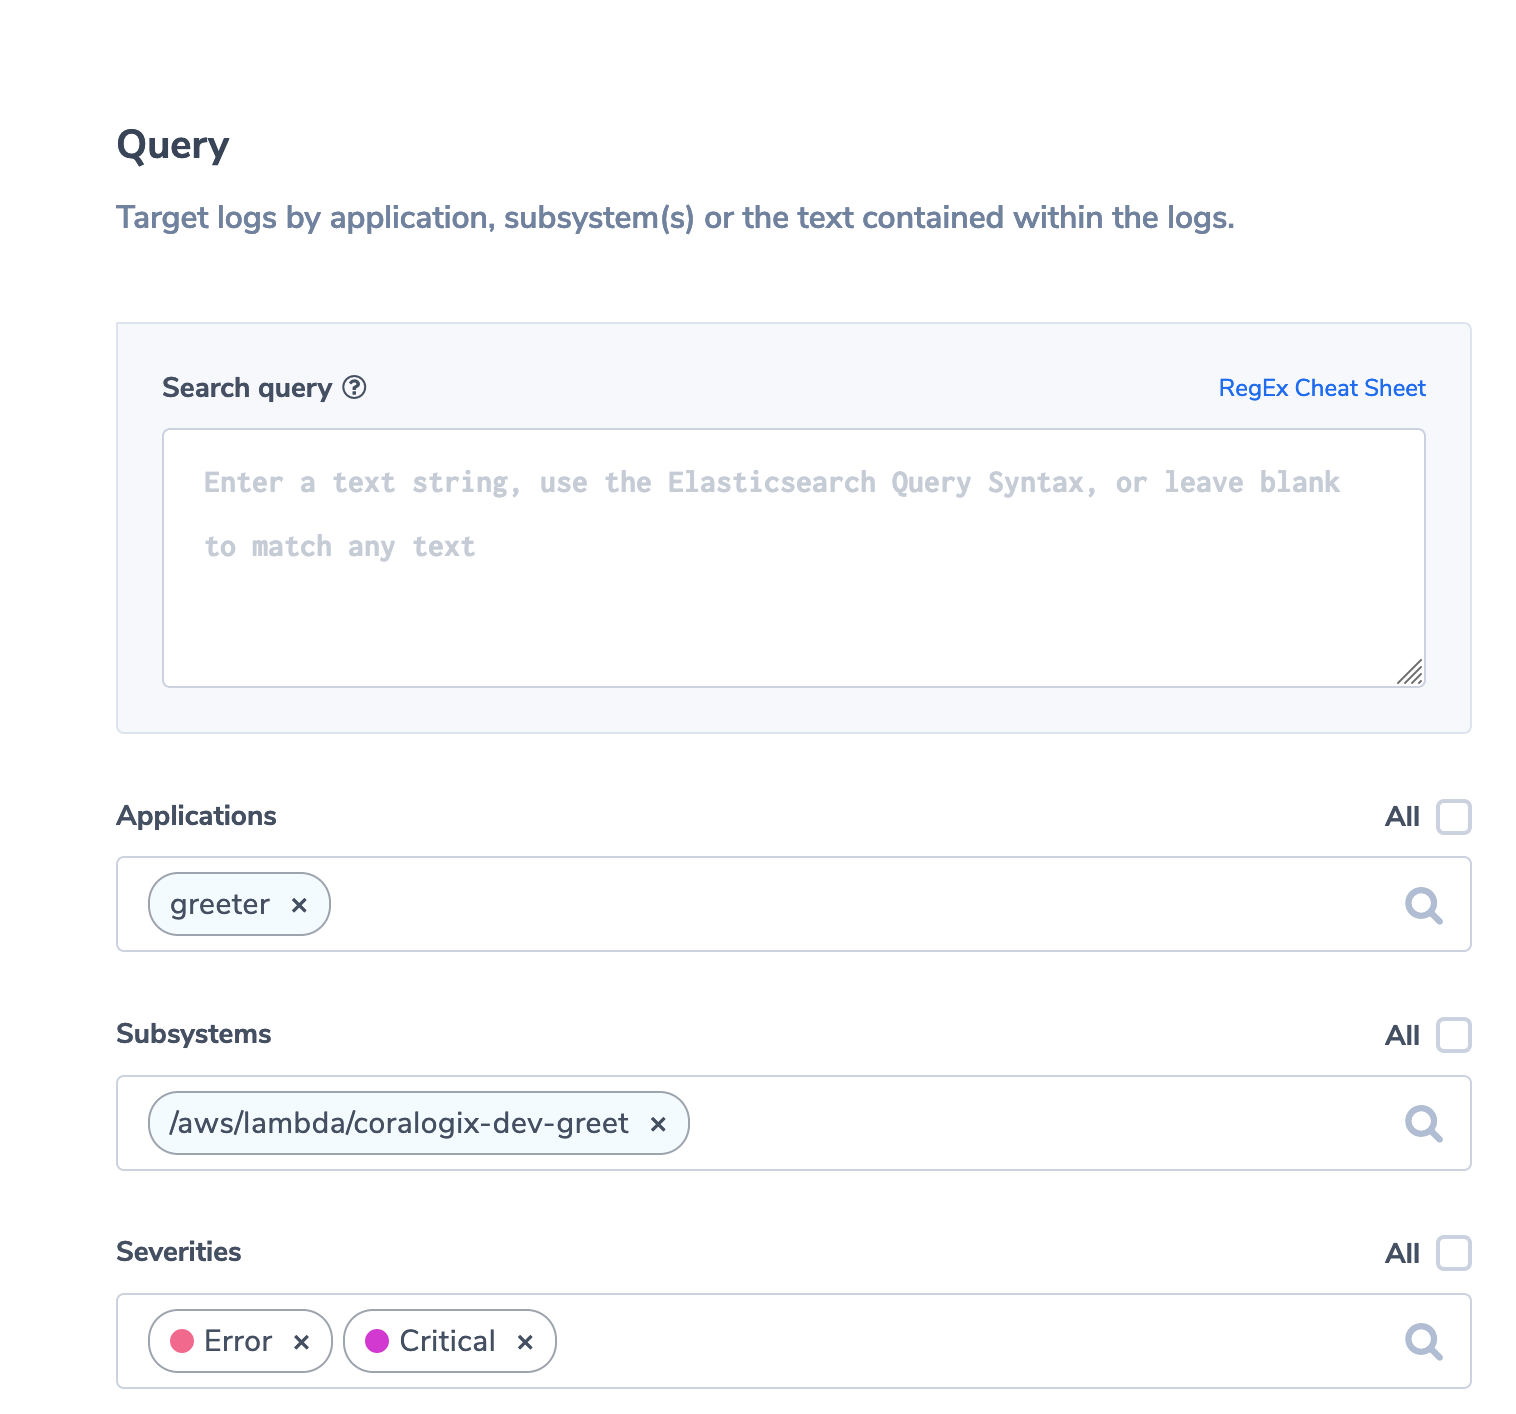
Now, we’ll define what kind of log message triggers an alert. Scroll down to “Query”. For this example, we simply want to be notified whenever there is a log message with severity “ERROR” or “CRITICAL”. So just leave the “Search Query” field empty, pick “greeter” as the application whose logs will be evaluated, and pick “Error” and “Critical” as severities.
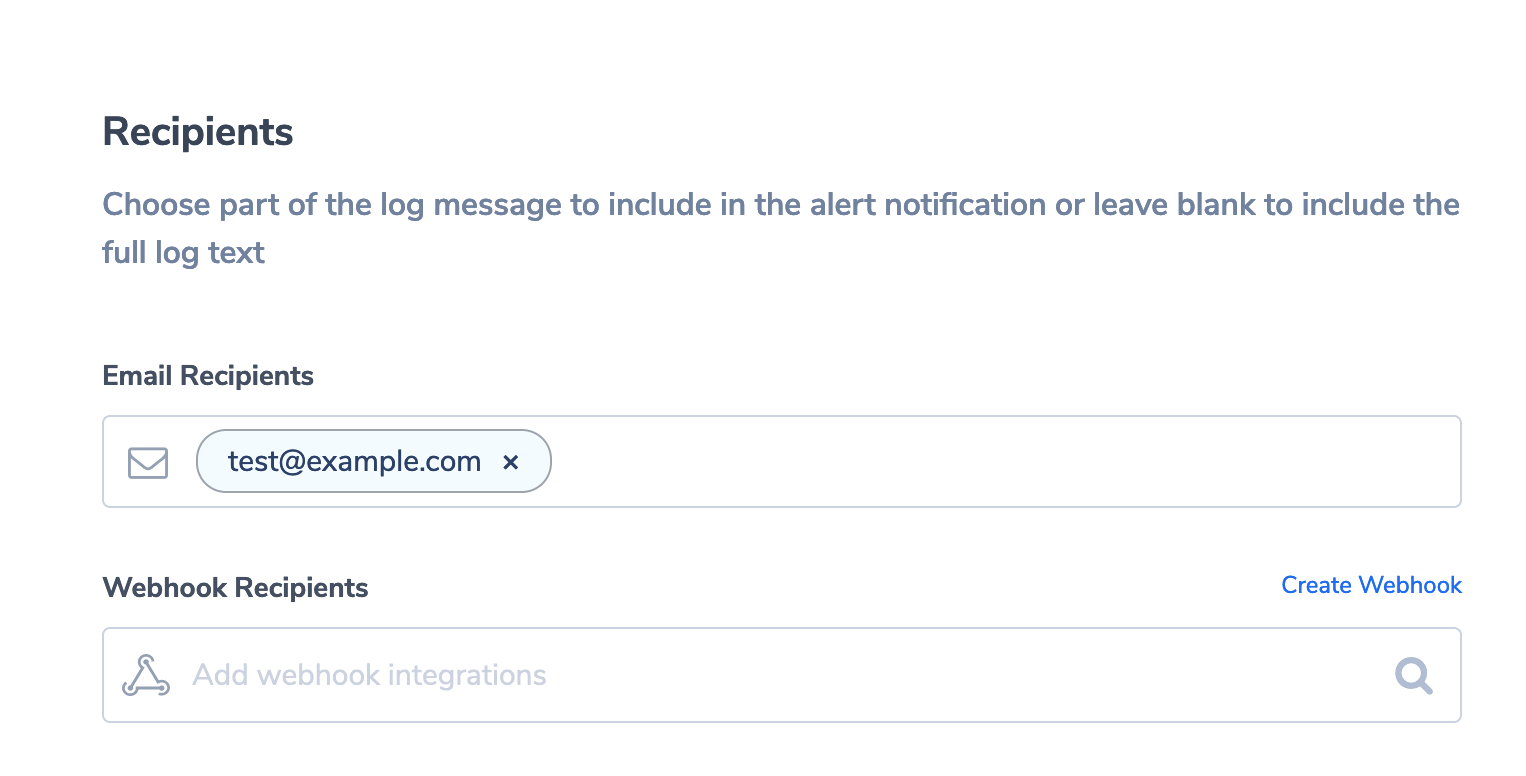
Finally, we’ll define who should receive the alert. So scroll down to “Recipients” and enter your email address:
Make sure the alert is enabled using the toggle button on the top right and click “CREATE ALERT”.
Test the Alert
Wait a little time (15 minutes should be sufficient) until the alert engine loads your alert. Then, send another invalid request to our test application:
You’ll now receive an email to the address you’ve defined with information on your alert and the log message that triggered it.
Conclusion
In this article, we’ve examined what’s important in planning a monitoring and alerting solution for a serverless application, and we implemented a solution with a few simple steps using Coralogix.
You can now easily add further Lambda functions as triggers to your log transporter. This ensures that you are automatically alerted to any errors in your code. This will give you the critical advantage of being able to react immediately when there’s anything wrong with your applications. With access to all the log messages when analyzing the root cause, you are well placed to solve issues efficiently–hopefully, before your users even realize that something’s going on.
Interested in knowing the differences between AWS Lambda, Azure Functions, and Google Cloud Functions? Read more about going serverless in this blog post.
Be Our Partner
Complete this form to speak with one of our partner managers.
Thank You
Someone from our team will reach out shortly. Talk to you soon!
 The new standard of observability is here. Discover Olly, the industry’s first