AWS Lambda Logging & Monitoring Tutorial

Going serverless relieves you of setting up servers, updating operating systems, or maintaining physical infrastructure. But what happens when a function doesn’t work and things go wrong? Given the added complexity, working in a serverless environment requires engineers to capture the data flowing from functions and their epithermal containers with a centralized Amazon monitoring logging solution.
In this Lambda logging monitoring guide:
- Examine what’s important when designing a monitoring and alerting solution for serverless applications
- Build a test application and look at how monitoring/alerting could be relevant to it
- Deploy the application to AWS Lambda using its serverless framework
- Make sure that the errors logged by our Lambda application are not ignored
Planning, Monitoring, and Alerting of Serverless Applications
When planning out a monitoring and alerting solution for serverless applications, there are several factors to take into consideration. We will discuss each of these in turn.
Scalability
How well does your monitoring solution scale when your application grows? One of the main advantages of deploying your applications on a serverless platform is that they can scale nearly indefinitely. Still, you need to make sure that your monitoring solution can keep up.
It should be able to handle your growing application landscape without you manually provisioning the scaling solution. It should be configured to handle large, quickly-growing amounts of data provided by replicated applications, and still be able to evaluate them in real-time.
Integration
Your monitoring solution should be the one place where all monitored data comes together. That’s why it should provide easy-to-use integration points to accept metrics and logs from different systems and applications.
Independence and Reliability
If your application goes down, you must have access to any logs and metrics and be alerted. Then you are in a position to analyze what is happening and to react as quickly as possible. That’s why you’ll want your monitoring and alerting systems to run reliably and independently of your application.
Ease of Use
Let’s face it, if it is a hassle to read through logs or set up alerts, you will end up not doing it. A monitoring and alerting system is only useful if it is actually easy to use and doesn’t bloat your administrative workload.
Separation of Concerns/Loose Coupling
If you want to reap the benefits of cloud platforms, you’ll want to be able to deploy your application to new platforms quickly. Logging shouldn’t stand in the way. You don’t want to be forced to change application code when you change your logging provider or your deployment platform. You don’t want to implement different log-transportation strategies into your application, but rather just write to STDOUT and be sure that your logs are dealt with.
Also, logging large amounts of data can be a time- and resource-consuming task. It can even slow down your core application and introduce production issues. That’s a situation you’ll want to avoid by loosely coupling your application and your logging platform.
General Best Practices
Stream your CloudWatch apps to Lambda – One way of making sure that your logs keep their integrity across applications is to set up streaming of your logs directly to the Amazon Monitoring Elasticsearch Service.
Auto-subscribe new log groups – Whenever a new Lambda function is created, it automatically creates a new grouping in your logs. You can enable CloudTrail to recognize new event patterns and handle the subscription process automatically.
Auto-set Log Retention policies – By default Lambda creates new logs for each function with a “never expire” setting for all events. This is understandably overkill and can fill up your log files with a great deal of unnecessary data, resulting in a reduction in your signal to noise ratio. You may wish to change this setting to auto-expire logs after a certain number of days.
A Sensible Architecture for Logging in Cloud Environments
So, how can you set up logging to comply with these requirements? A basic, yet scalable architecture could be designed like this:
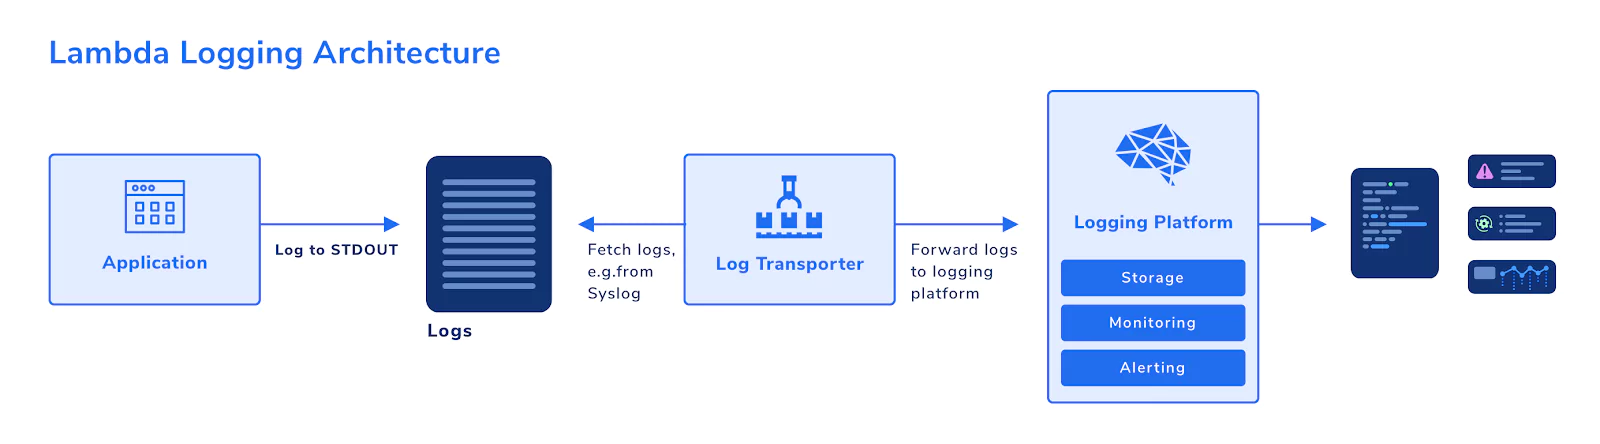
Your application simply logs out to STDOUT, for example, using console.log. Writing to STDOUT is all your application needs to know about logging. In this way, you have separated your application logic from your logging activities.
A log transporter then fetches the logs from where they are stored temporarily after writing to STDOUT, e.g., from Syslog. It then forwards new log entries to the logging platform. Your logging platform: stores the log data, has monitoring capabilities, and can alert you to noteworthy events.
Using this pattern, you can ensure that your application remains decoupled from your logging platform. If your system goes down, the relevant logs will still be available in the logging platform.
Also, you enable scalability. Your applications can scale as you please without the need to think about transporting large amounts of log data. You can simply increase the number of log transporters, or change the transport strategy altogether, without affecting your application at all.
The ELK Stack
A classical way of implementing an architecture like that is using the ELK stack. It’s made up of three main components:
- Elasticsearch–a search engine and indexer for log data.
- Logstash–a log transporter that can accept logs from a wide variety of input channels and formats and can transform (if required) and forward them to output channels, for example, Elasticsearch.
- Kibana–a data visualization dashboard that reads and presents data from Elasticsearch.
The ELK stack applies the requirements mentioned above and makes up one of the most widely-used logging platforms. There are a number of cloud-based SaaS platforms that provide you with an ELK stack, for example, Coralogix.
Alternative Solutions
Cloud platforms such as AWS usually provide their own logging stack. AWS, for example, has CloudWatch, which can collect logs from services running on top of AWS, and provides basic stream and search functionality for log data.
When you run single applications that aren’t too complex, using CloudWatch exclusively can be an option. However, when your application consists of multiple components that log data, or when it combines services that run inside and outside of a cloud platform, you’ll quickly reach the limits of that solution. You’ll want a central view on your entire application and the chance to not just read, but to analyze and understand your data. Therefore, it will often make sense to make your logs available in a dedicated logging platform.
Even when doing so, CloudWatch and similar services will play a role in your architecture. They collect your application logs inside your cloud platform and make them acc log transporter.
Learn More: The complete guide to centralized AWS logging
An Example Application
Let’s get our sleeves rolled up and our hands dirty. We’ll build a demo application using the Serverless framework and deploy it to AWS Lambda. Then we’ll find a potential error scenario in the application and set up monitoring and alerting for that.
Prerequisites
For this article, we assume that you have both Node.js and npm installed. If not, please go to Node.js for instructions.
Set up AWS
If you already have your AWS CLI configured, you can skip this section.
To get started, you’ll need an AWS account. If you don’t have one yet, just follow the instructions on the AWS Portal.
Also, you’ll need to have the AWS CLI (Command Line Interface) installed. You can find instructions in the AWS Documentation.
To make sure that the CLI can work with your AWS account, get an AWS Access Key ID and an AWS Secret Access Key by following the instructions here.
Then, store your credentials as described here.
Install Serverless
Install the Serverless CLI on your computer by running:
npm i -g serverless
Create the Example Application
Event Handler
Create an empty folder somewhere on your computer. Now create a handler.js file with the following contents:
module.exports.greet = async event => {
    const body = JSON.parse(event.body);
    if (!body.name) {
        throw new Error('No name provided');
    }
    return {
        statusCode: 200,
        body: JSON.stringify(
            {
                greeting: `Hello, ${body.name}`
            },
            null,
            2
        ),
    };
};
This script defines an event handler called greet. When an HTTP request is sent to our application, it will be processed by this handler. It parses the request body and checks if the name property is set. If it is not, the handler throws an error. If it is set, it returns a JSON object to the client, greeting the user by this property value (name).
Serverless Configuration
Now to deploy the application to AWS Lambda, we’ll use Serverless. Serverless will read its configuration from a serverless.yml file and take care of the setup and deployment for us. Create the YAML file in the same folder as handler.js and populate it with the following:
service: greeter
provider:
  name: aws
  runtime: nodejs12.x

functions:
  greet:
    handler: handler.greet
    events:
      - http:
          path: /
          method: post
This configuration tells Serverless that we’re running a service called greeter on an AWS Lambda stack with Node.js 12. It then defines one Lambda function called greet, and maps that function to the greet function we defined in our handler.js. Finally, it instructs Lambda to listen to HTTP requests coming in under the path / and, therefore, treat them as events in our greet function.
Deploy the Application
We are ready to deploy the application to Lambda. Simply run sls deploy in the same folder that also contains your handler.js and serverless.yml.
You will get an output like the following:
Service Information
service: greeter
stage: dev
region: us-east-1
stack: greeter-dev
resources: 10
api keys:
  None
endpoints:
  POST - https://xxxxxxxxxx.execute-api.us-east-1.amazonaws.com/dev/
functions:
  greet: greeter-dev-greet
layers:
  None
The most important piece of information here is the list of endpoints. In this example, Serverless tells us that we can reach our application under https://xxxxxxxxxx.execute-api.us-east-1.amazonaws.com/dev/. This URL will be unique to you, so be sure to note it down.
Test the Application
Now that we have our application deployed, let’s go ahead and test it by shooting it an HTTP POST request, letting it know that our name is Maria and waiting for a greeting:
$ curl --data '{"name":"Maria"}' https://xxxxxxxxxx.execute-api.us-east-1.amazonaws.com/dev/
{
  "greeting": "Hello, Maria"
}
As expected, we’re warmly greeted.
Now let’s look at what happens if we change the request slightly. In the handler.js, we expect the name to be handed over in a request body property called name. What happens if, instead, we commit an error and send it in a property called firstName?
$ curl --data '{"firstName":"Maria"}' https://xxxxxxxxxx.execute-api.us-east-1.amazonaws.com/dev/
{"message": "Internal server error"}
Oops, that doesn’t look so good. It doesn’t come as a surprise in this test application (we explicitly throw an exception). But with just this 500 error message from Lambda, all we know is that there was some issue along the way. Our error does not provide information about what the root cause is.
Monitoring and Alerting
Our test application is primitive, and it’s easy to pinpoint the root cause of an error. In a larger application, however, there are many potential causes for errors. A database connection might have failed. A user’s input data might have been poorly formed and not properly handled. A third-party REST API service might suddenly have become unavailable.
We need some way to see what’s actually going on, rather than just receiving a generic “Internal Server Error” message. One thing we can do to analyze the cause of the error is to look into the logs. We can do this using the Serverless CLI:
$ sls logs -f greet
 START RequestId: b01870f3-b5f0-48dd-9cdc-fccfcade4940 Version: $LATEST
 2020-02-01 10:33:24.766 (+01:00)        b01870f3-b5f0-48dd-9cdc-fccfcade4940    ERROR   Invoke Error         {"errorType":"Error","errorMessage":"No name provided","stack":["Error: No name provided","    at      Runtime.module.exports.greet [as handler] (/var/task/handler.js:6:15)","    at Runtime.handleOnce (/var/     runtime/Runtime.js:66:25)"]}
 END RequestId: b01870f3-b5f0-48dd-9cdc-fccfcade4940
 REPORT RequestId: b01870f3-b5f0-48dd-9cdc-fccfcade4940  Duration: 3.91 ms       Billed Duration: 100 ms      Memory Size: 1024 MB    Max Memory Used: 72 MB
That’s already better. It provides the actual exception we throw in our application, so that helps us quickly identify the root cause. But how can we make sure we actually see errors when they pop up without manually checking the logs every time?
Check Logs in CloudWatch
The first step is to make use of CloudWatch. Lambda logging should be stored there. So, open the AWS console log and, from the services menu, open CloudWatch. Now in the left menu, click “Log groups”:
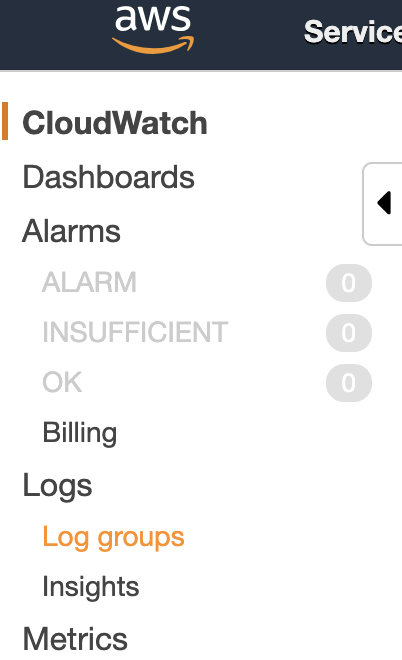
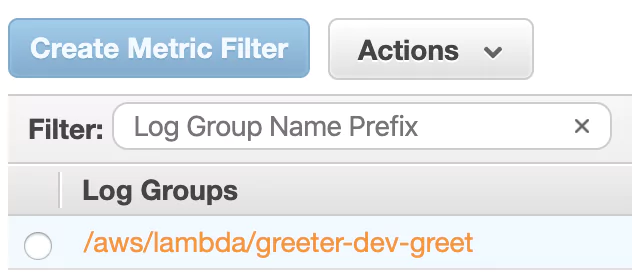
You should see one group for your greeter function (called, for example, /aws/lambda/greeter-dev-greet). A log group is a collection of log streams. The log streams in a log group share some common properties, amongst others: access control and data retention settings.
Click that log group.
You’ll now see a list of log streams. Each stream contains log messages from one source. Notice that re-deploying a Lambda function can lead to a new log stream being created. Right now, you should see at least one log stream:
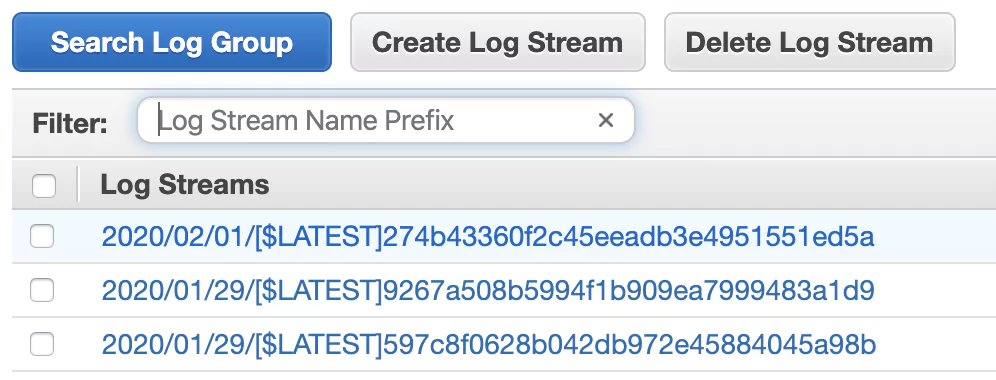
Click it and check out the log entries. You’ll see the same messages returned when you pulled the logs using the Serverless CLI earlier.
Send Logs to a Lambda Logging Platform
While you now have a way of collecting and seeing logs using CloudWatch, it’d surely be great to have your logs available in an ELK stack. While it’s easily possible to set up your own ELK stack, it can be cumbersome to get started, to operate it, and to secure it properly. That’s why, for this article, we’ll use Coralogix, a cloud-based observability platform.
So let’s go ahead and send our AWS logs to Coralogix.
Register with Coralogix
First, register for a free Coralogix account. After registration, you’ll receive an email with the subject “Start sending your logs”. It contains a private key, which we’ll need to send logs from AWS to Coralogix. So, be sure to note down that private key.
Set up Lambda Log Transporter
Next, we’ll set up AWS to send its logs to Coralogix. While it is possible to use Logstash for that, Coralogix provides a simple log transporter out of the box.
To get started with it, we’ll set up another Lambda function that simply takes all logs of our test application and forwards them to Coralogix.
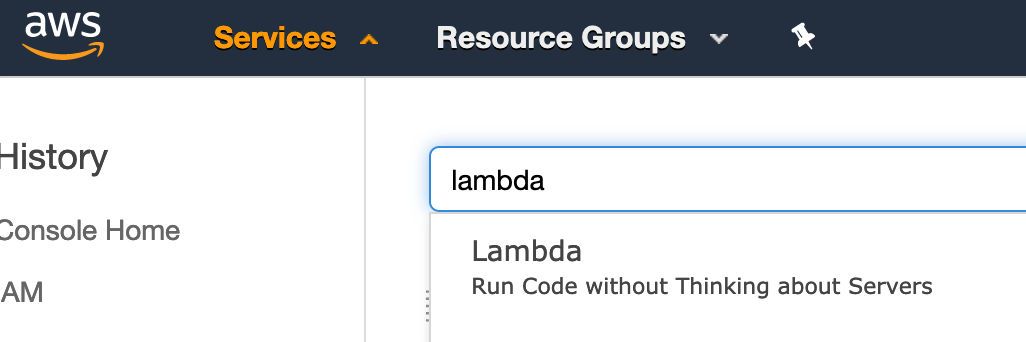
Open the AWS Console, log in and type “Lambda” in the Service menu search field. Then click the “Lambda” entry:
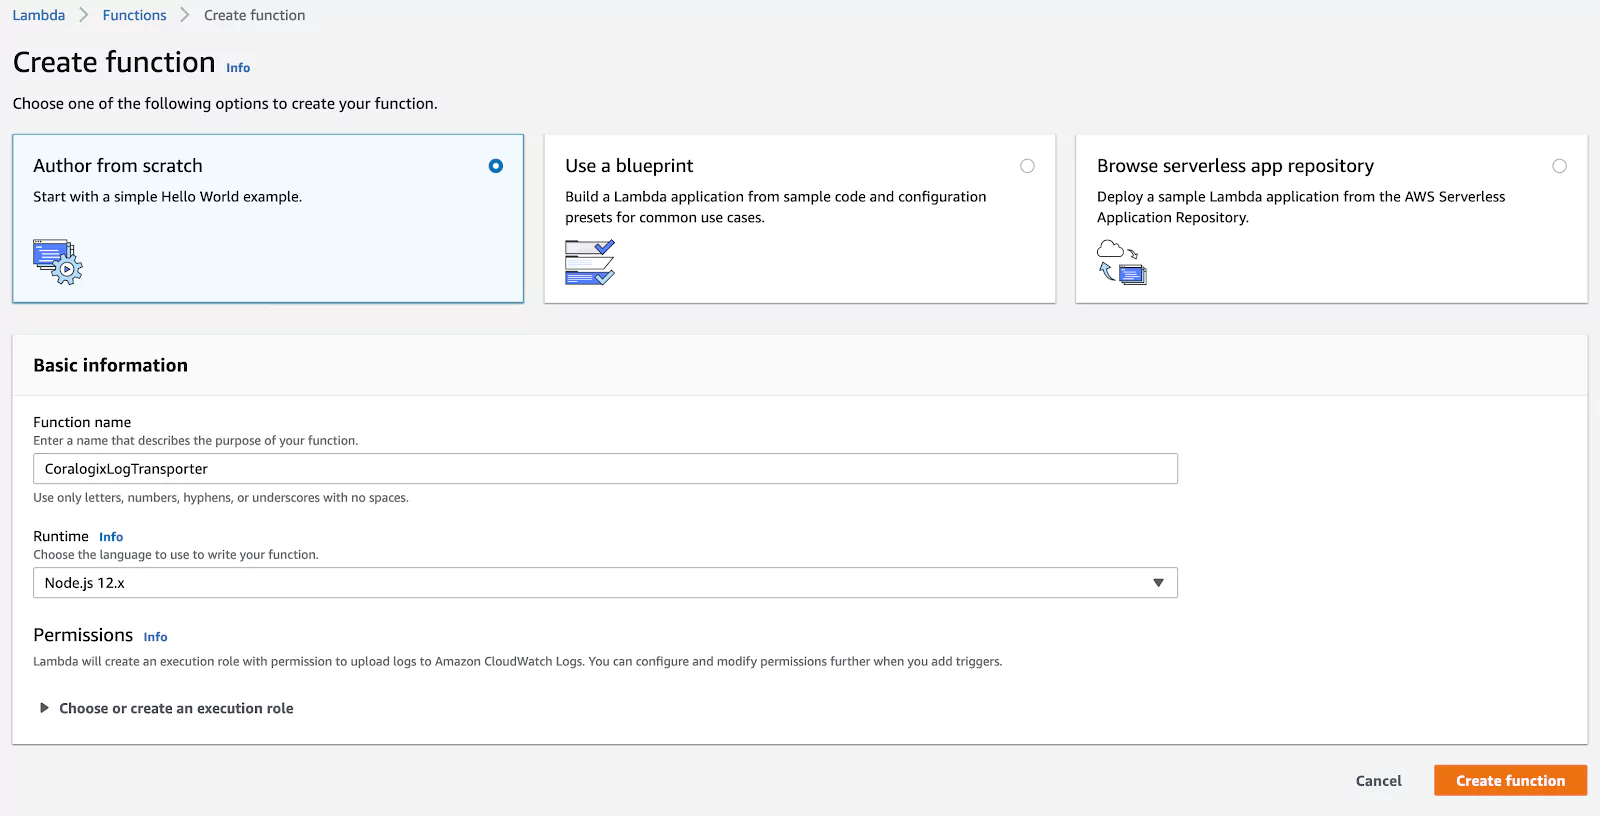
Now click “Author from scratch” to create a new Lambda function. Give it a name (e.g. “CoralogixLogTransporter”) and choose “Node.js 12.x” as the runtime. Then click “Create Function”:
Under “Function code”, paste the following code. This will forward logs from your Lambda applications to Coralogix:
"use strict";

// Import required libraries
const https = require("https");
const zlib = require("zlib");
const assert = require("assert");

// Check Lambda function parameters
assert(process.env.private_key, "No private key!");
const newlinePattern = process.env.newline_pattern ? RegExp(process.env.newline_pattern) : /(?:rn|r|n)/g;
const sampling = process.env.sampling ? parseInt(process.env.sampling) : 1;
const coralogixUrl = process.env.CORALOGIX_URL || "api.coralogixstg.wpengine.com";

/**
* @description Send logs to Coralogix via API
* @param {Buffer} logs - GZip compressed logs messages payload
* @param {function} callback - Function callback
* @param {number} retryNumber - Retry attempt
* @param {number} retryLimit - Retry attempts limit
*/
function postToCoralogix(logs, callback, retryNumber = 0, retryLimit = 3) {
    let responseBody = "";

    try {
        const request = https.request({
            hostname: coralogixUrl,
            port: 443,
            path: "/logs/rest/singles",
            method: "POST",
            headers: {
                "Content-Type": "application/json",
                "Content-Encoding": "gzip",
                "Content-Length": logs.length,
                "private_key": process.env.private_key
            },
            timeout: 10000
        });

        request.on("response", (response) => {
            console.log("Status: %d", response.statusCode);
            console.log("Headers: %s", JSON.stringify(response.headers));
            response.setEncoding("utf8");
            response.on("data", (chunk) => responseBody += chunk);
            response.on("end", () => {
                if (response.statusCode != 200) throw new Error(responseBody);
                console.log("Body: %s", responseBody);
            });
        });

        request.on("timeout", () => {
            request.destroy();
            if (retryNumber++ < retryLimit) {
                console.log("Problem with request: timeout reached. retrying %d/%d", retryNumber, retryLimit);
                postToCoralogix(logs, callback, retryNumber, retryLimit);
            } else {
                callback(new Error("Failed all retries"));
            }
        });

        request.on("error", callback);

        request.write(logs);
        request.end();
    } catch (error) {
        callback(error);
    }
}

/**
* @description Extract nested field from object
* @param {string} path - Path to field
* @param {*} object - JavaScript object
* @returns {*} Field value
*/
function dig(path, object) {
    if (path.startsWith("$.")) {
        return path.split(".").slice(1).reduce((xs, x) => (xs && xs[x]) ? xs[x] : path, object);
    }
    return path;
}

/**
* @description Extract serverity from log record
* @param {string} message - Log message
* @returns {number} Severity level
*/
function getSeverityLevel(message) {
    let severity = 3;
    if (message.includes("debug"))
        severity = 1;
    if (message.includes("verbose"))
        severity = 2;
    if (message.includes("info"))
        severity = 3;
    if (message.includes("warn") || message.includes("warning"))
        severity = 4;
    if (message.includes("error"))
        severity = 5;
    if (message.includes("critical") || message.includes("panic"))
        severity = 6;
    return severity;
}

/**
* @description Lambda function handler
* @param {object} event - Event data
* @param {object} context - Function context
* @param {function} callback - Function callback
*/
function handler(event, context, callback) {
    const payload = Buffer.from(event.awslogs.data, "base64");

    zlib.gunzip(payload, (error, result) => {
        if (error) {
            callback(error);
        } else {
            const resultParsed = JSON.parse(result.toString("ascii"));
            const parsedEvents = resultParsed.logEvents.map(logEvent => logEvent.message).join("rn").split(newlinePattern);

            zlib.gzip(JSON.stringify(
                parsedEvents.filter((logEvent) => logEvent.length > 0).filter((logEvent, index) => index % sampling == 0).map((logEvent) => {
                    let appName = process.env.app_name || "NO_APPLICATION";
                    let subName = process.env.sub_name || resultParsed.logGroup;

                    try {
                        appName = appName.startsWith("$.") ? dig(appName, JSON.parse(logEvent)) : appName;
                        subName = subName.startsWith("$.") ? dig(subName, JSON.parse(logEvent)) : subName;
                    } catch {}

                    return {
                        "applicationName": appName,
                        "subsystemName": subName,
                        "timestamp": Date.now(),
                        "severity": getSeverityLevel(logEvent.toLowerCase()),
                        "text": logEvent,
                        "threadId": resultParsed.logStream
                    };
                })
            ), (error, compressedEvents) => {
                if (error) {
                    callback(error);
                } else {
                    postToCoralogix(compressedEvents, callback);
                }
            });
        }
    });
}

exports.handler = handler;
Configure the Lambda Log Transporter
Next, we’ll have to let the log forwarding Lambda function know how to authenticate against Coralogix, and which application and subsystem name to send to Coralogix. These application and subsystem names will be used in the Coralogix user interface to browse logs and set up alerts by application.
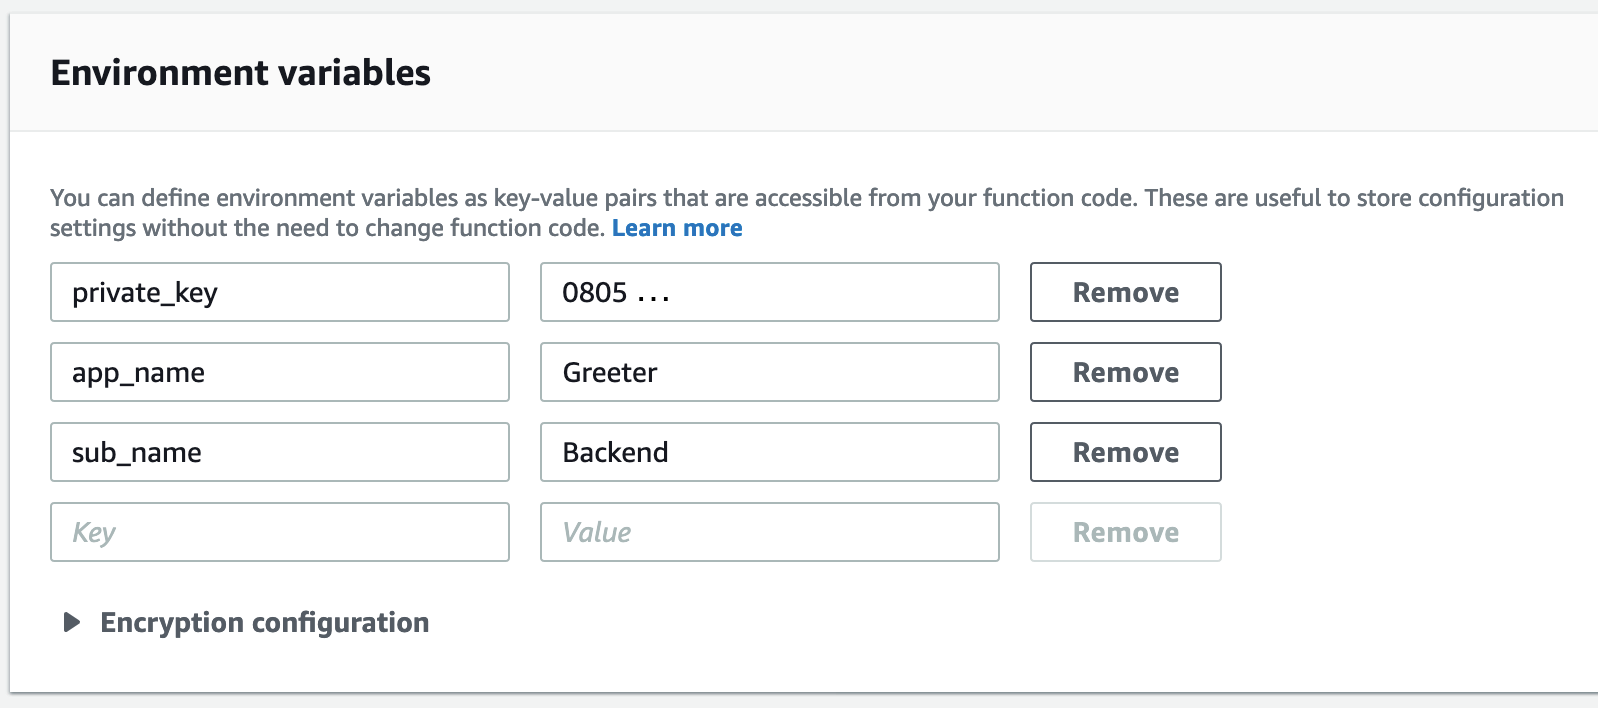
Enter the following environment variables:
- private_key: The Coralogix private key you noted down earlier.
- app_name: A name of your application; in our example: “Greeter”.
- sub_name: The name of the subsystem of your application, e.g., “frontend”, backend”, … As our test application is a greeter backend, let’s call it “Backend”.
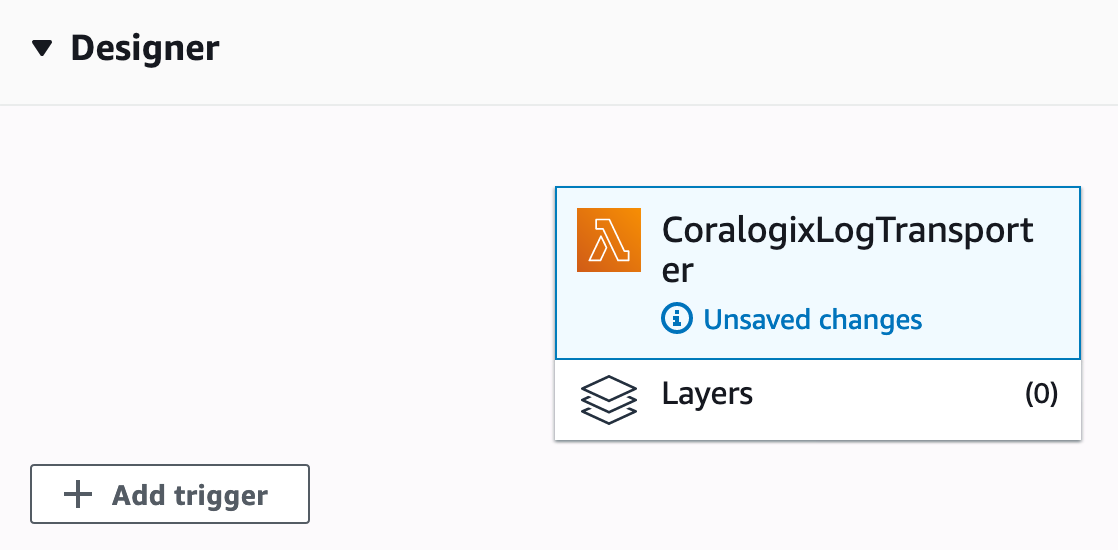
Add a Trigger to Forward Lambda Logs to Coralogix
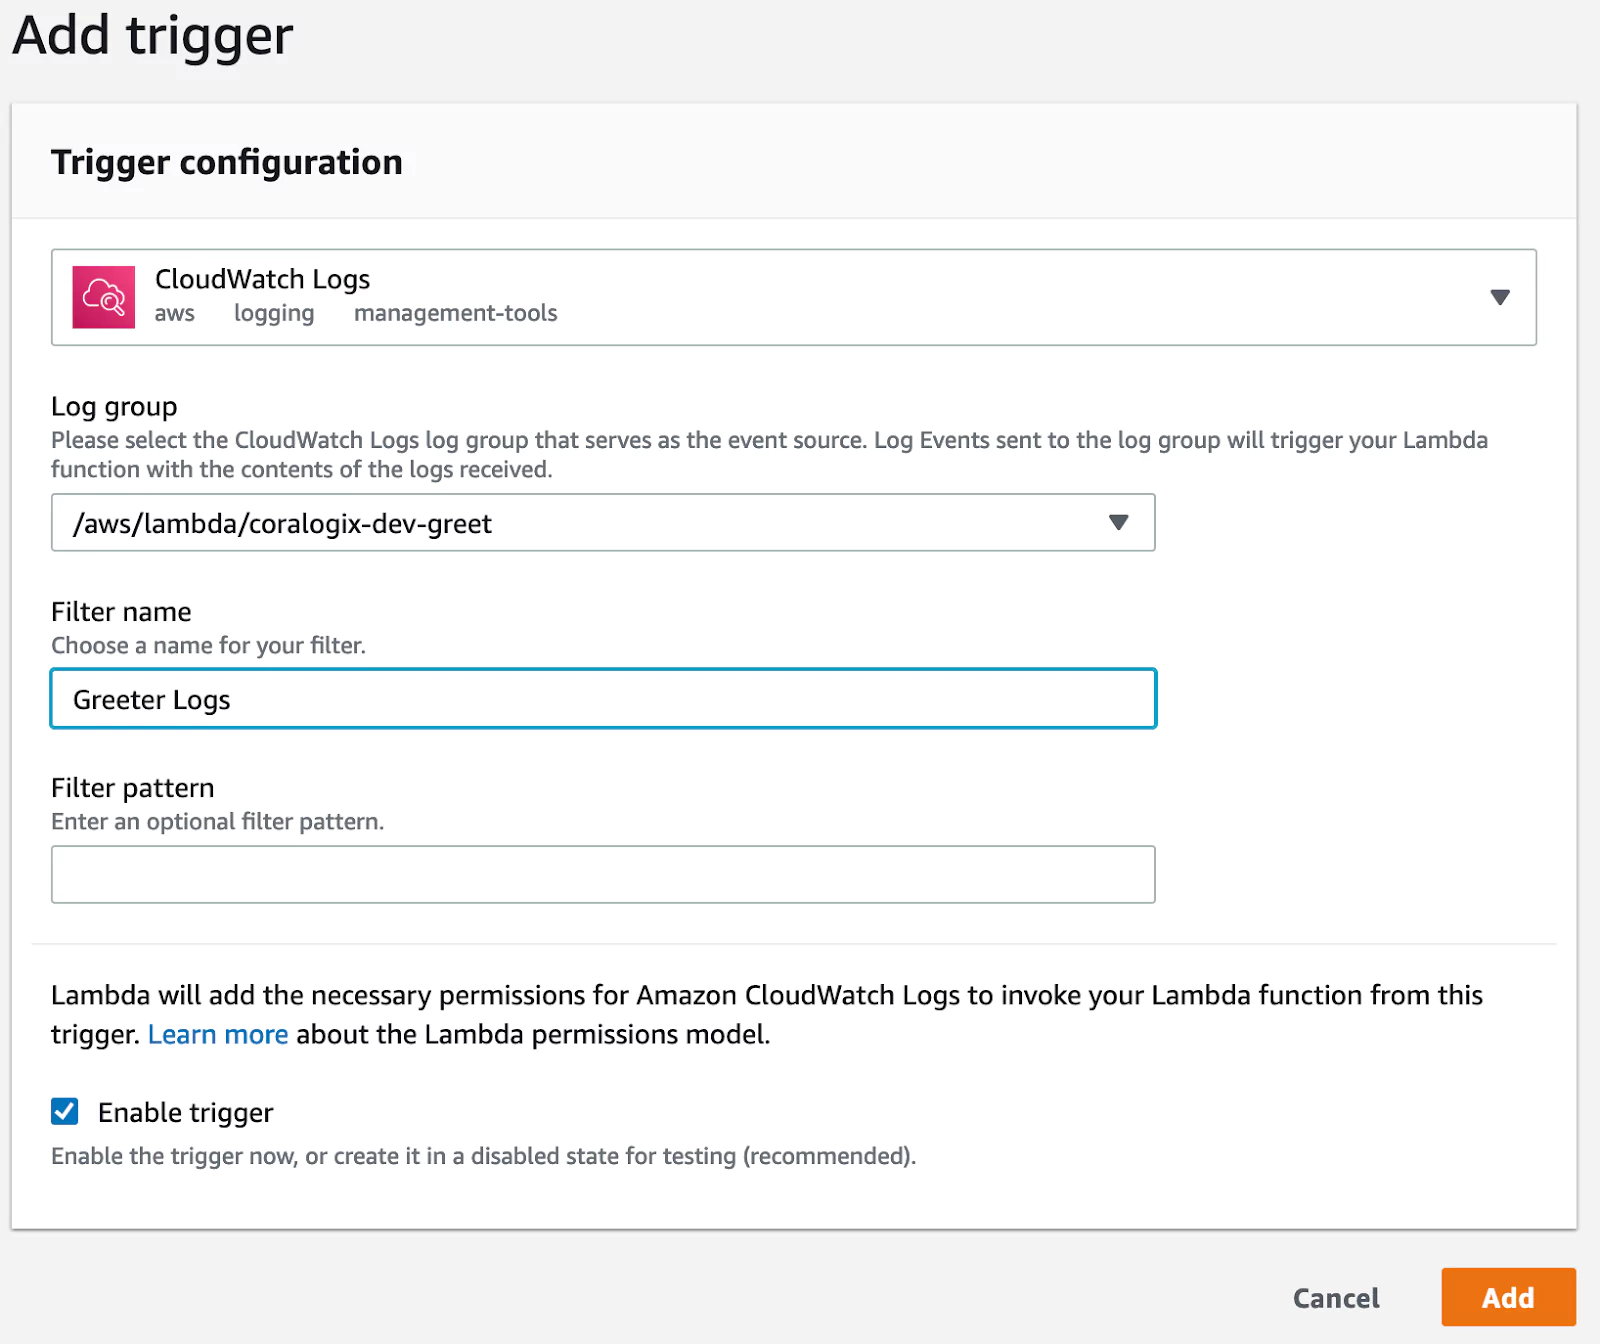
Now, we’ll need to let our log transporter function know to send logs to Coralogix whenever there are new logs available. We do that by clicking “Add trigger” in the Function Designer on the top of the screen:
Now let’s configure the trigger. First, choose “CloudWatch Logs” as the trigger type. Then, click the “Log group” dropdown and select your test application. Next, pick a name for this trigger configuration, e.g., “Greeter Logs”, and make sure you enable the trigger. Finally, click “Add”.
Read Lambda Logs
Congratulations, you have set up log forwarding from your test application into Coralogix. Now, you’ll surely want to see your logs stream into Coralogix.
To make sure we have some logs available to see, let’s send two more requests. Make sure you enter your unique Lambda endpoint:
$ curl --data '{"name":"Maria"}' https://xxxxxxxxxx.execute-api.us-east-1.amazonaws.com/dev/
$ curl --data '{"firstName":"Maria"}' https://xxxxxxxxxx.execute-api.us-east-1.amazonaws.com/dev/
To see the log entries for these requests: Log in to Coralogix, then click “Logs” in the menu. You’ll see at least two log entries: One for the correct request, and another for the faulty one. The correct request will have a severity of “INFO”, while the faulty one has a severity of “ERROR”.
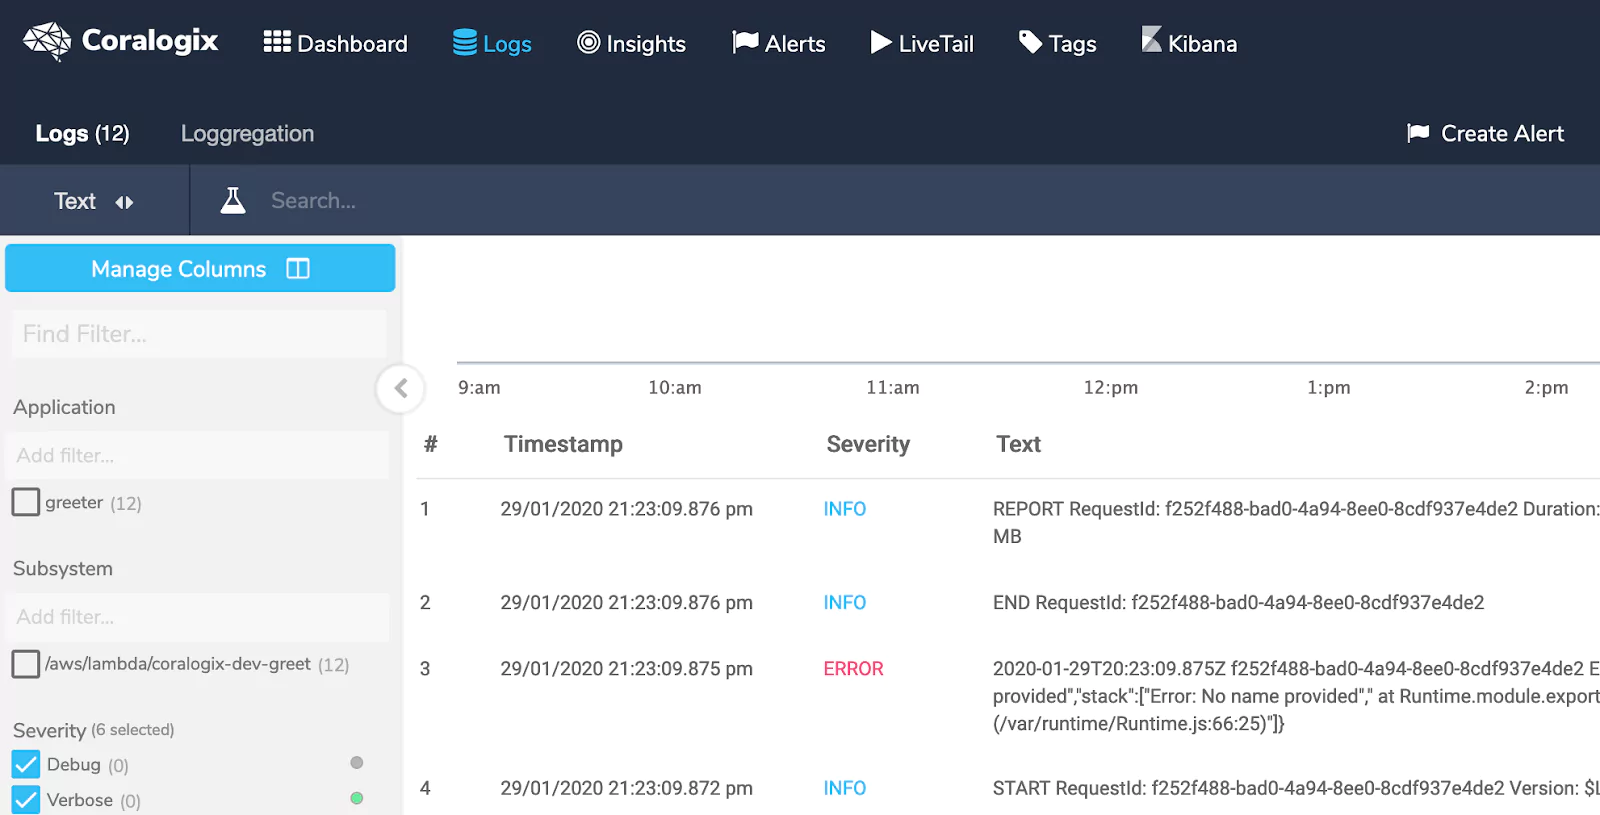
You can browse your logs and filter them using the controls in the sidebar. Additionally, you can filter your log messages by time on the top right.
Set up Alerts
Now that we can see the logs streaming from our application, it would be great to be alerted when there’s an error. So, let’s set up an email alert that will inform us whenever there’s a log message with the severity “ERROR”.
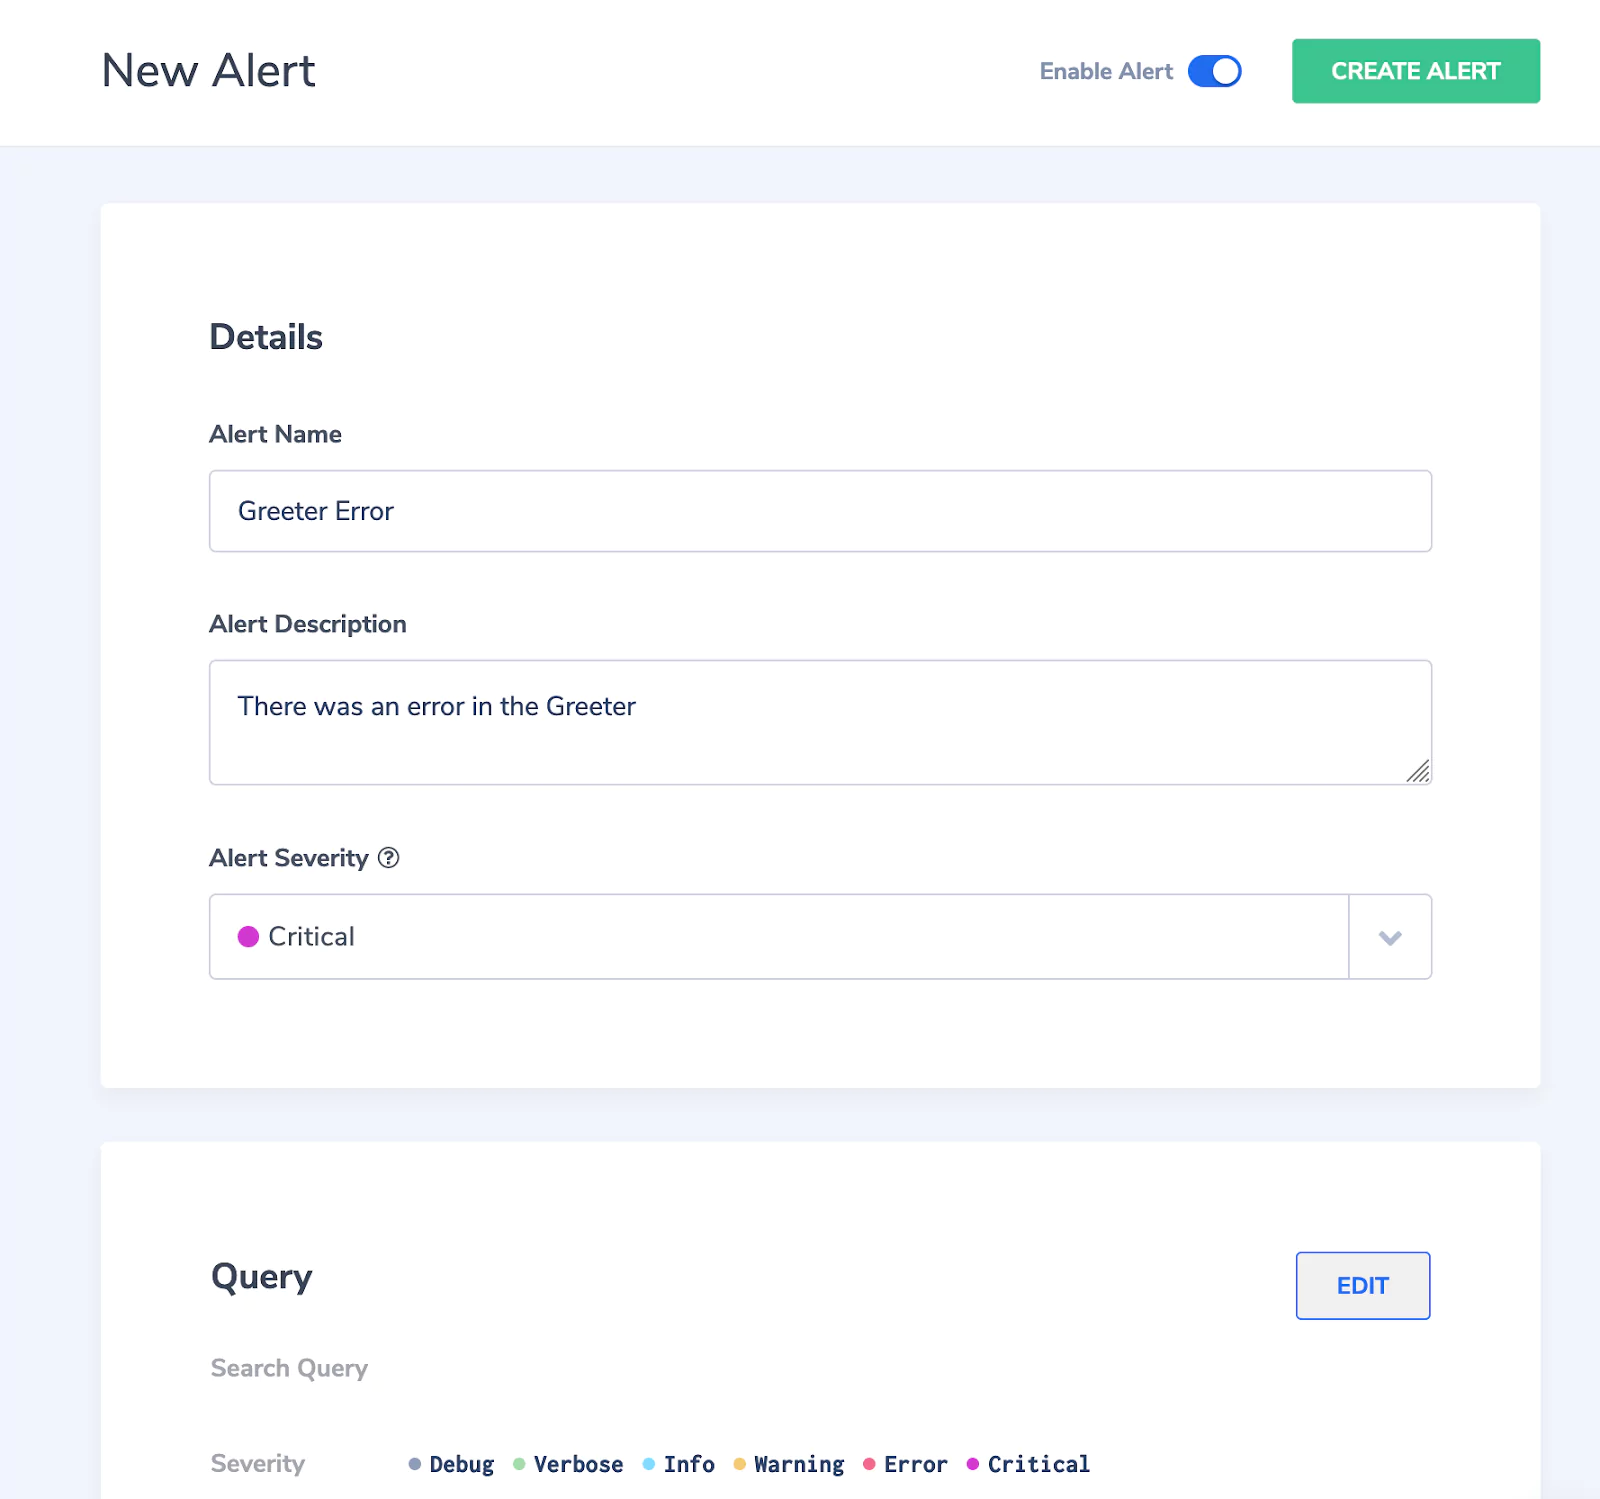
To do so, click “Create Alert” (on the right, just below the menu):

Next, give the alert a name (e.g., “GreeterError”), a description (e.g., “There was an error in the Greeter”), and a severity for the alert (let’s pick “Critical” here). You will receive this information as part of the alert email.
Now, we’ll define what kind of log message triggers an alert. Scroll down to “Query”. For this example, we simply want to be notified whenever there is a log message with severity “ERROR” or “CRITICAL”. So just leave the “Search Query” field empty, pick “greeter” as the application whose logs will be evaluated, and pick “Error” and “Critical” as severities.
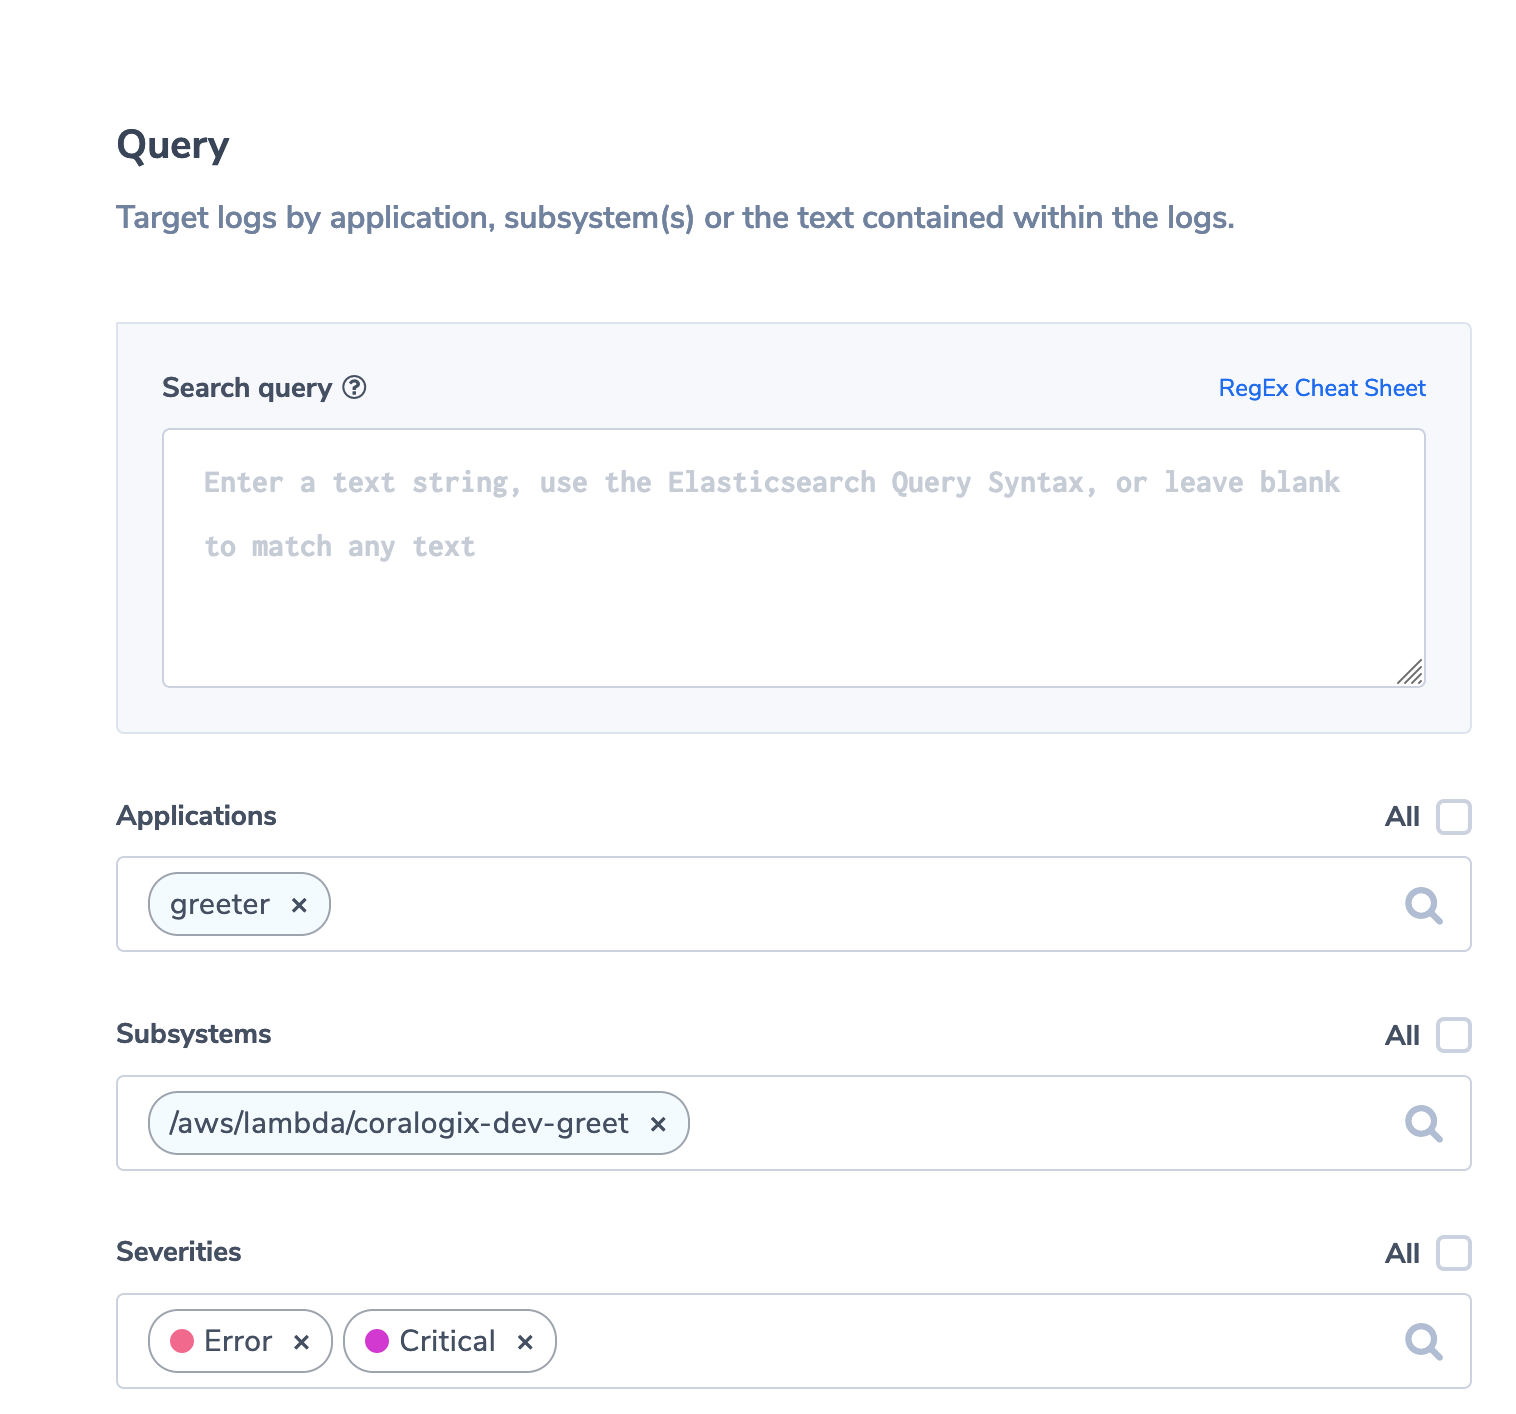
Finally, we’ll define who should receive the alert. So scroll down to “Recipients” and enter your email address:
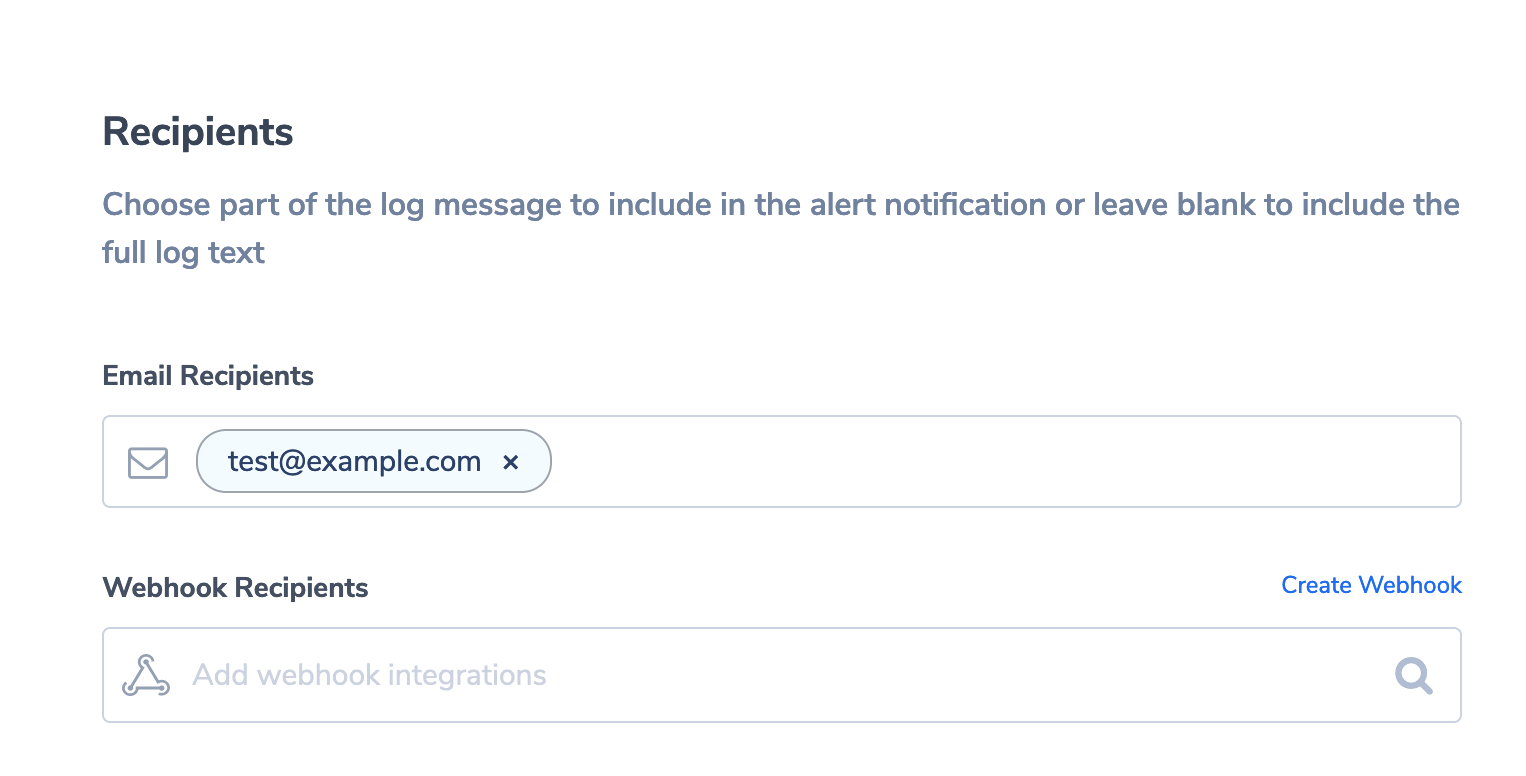
Make sure the alert is enabled using the toggle button on the top right and click “CREATE ALERT”.
Test the Alert
Wait a little time (15 minutes should be sufficient) until the alert engine loads your alert. Then, send another invalid request to our test application:
$ curl --data '{"firstName":"Maria"}' https://xxxxxxxxxx.execute-api.us-east-1.amazonaws.com/dev/
You’ll now receive an email to the address you’ve defined with information on your alert and the log message that triggered it.
Conclusion
In this article, we’ve examined what’s important in planning a monitoring and alerting solution for a serverless application, and we implemented a solution with a few simple steps using Coralogix.
You can now easily add further Lambda functions as triggers to your log transporter. This ensures that you are automatically alerted to any errors in your code. This will give you the critical advantage of being able to react immediately when there’s anything wrong with your applications. With access to all the log messages when analyzing the root cause, you are well placed to solve issues efficiently–hopefully, before your users even realize that something’s going on.
Interested in knowing the differences between AWS Lambda, Azure Functions, and Google Cloud Functions? Read more about going serverless in this blog post.