Best Practices for Logging in Kotlin

If you’re reading this, you have probably been convinced that taking on Kotlin for your mobile application is the most sensible choice. Now that you’ve come to this decision, it’s imperative to know what you need to do to stay on top of your monitoring and logging. Like with any application or system, they are essential, cornerstone qualities of any successful project. 

It is a common myth that mobile applications don’t require logging frameworks, or any logging for that matter – absolutely false! This unfounded myth is only the result of a lack of suitable frameworks and resources to do it effectively. Logging is absolutely an essential part of any stack, even when developing a mobile application.

For Android development, the android.util.log is the default mechanism to do your logging. It includes helpful features like severity levels and regex search capabilities. Further to this, if we recall that Kotlin and Java are interoperable, this would mean the classic Java logging frameworks can be suitable. You can read more of my thoughts on best practices logging in Java here.

The frameworks discussed in that article can also be used in any Kotlin project with some minor tweaking.

The standard Java logging frameworks prove to be limited in the context of Mobile App Development in Kotlin. This article will go over some of the main Kotlin logging libraries, and we will be delving into the reasons why a specialized Kotlin logger is advantageous of a simple Java implementation of a framework like SLF4J or LOG4J.

Introducing kotlin-logging framework for Kotlin

Kotlin-logging is a “lightweight logging framework for Kotlin, written 100% in Kotlin”. The github page has a more detailed reference. The kotlin-logging library was built by wrapping SLF4J with custom Kotlin extensions. Essentially, it is straight to the point and allows you to make highly replicable statements that are easy to define and use to make log method calls.

Simple kotlin-logging implementation

Without further ado, let’s jump into some practical examples of how kotlin-logging works. It is very straightforward and can easily be inserted into an existing Kotlin project.

If you are using Maven, keep your project structure and insert our kotlin-logging dependency to your pom.xml file:

<dependency>
  <groupId>io.github.microutils</groupId>
  <artifactId>kotlin-logging</artifactId>
  <version>2.0.3</version>
</dependency>

NOTE: You need to have SLF4J as a dependency as well.

Add it to the pom.xml file:

   <dependency>
        <groupId>org.slf4j</groupId>
        <artifactId>slf4j-api</artifactId>
        <version>1.7.29</version>
    </dependency>

So, as it stands we have two dependencies: The SLF4J API and the Kotlin-logging framework.

The logger is actually extremely simple to use. The safest way, according to the documentation, is to invoke the logger as follows:

private val logger = KotlinLogging.logger {}

After the logger is obtained, it can be used in multiple different ways.

Below are a few examples:

  • A simple informational log statement notifying of a successful API call:
logger.info("Successful call to the /get route")
  • A log statement that is set to only show if the “debug” severity is enabled, and evaluates the string $message if and only if that is the case:
logger.debug{"Only show if debug flag: $message"}
  • An effective way to log errors, with interpolated variables:
logger.error(exception) { "There was an error: $exception" }

As we can see for these few use cases, the kotlin-logger is concise and effective. For everything ranging from informational logs to interpolated error logs, things are kept simple and intuitive.

Mapped Diagnostic Context (or, MDC)

When dealing with a more complex mobile application, one containing user information for example or any with valuable meta information such as a sessionID, then simple logs are not enough to fulfill our needs. It is important to enrich our logs with useful information. Luckily, kotlin-logging also includes ways to set MDC properties that can be used later on by the Logger().

An example of this can be seen using the following:

withLoggingContext("userId" to userId) {
  doSomething()
}

This fragment taken from an example in the documentation shows exactly how MDC properties can be set and later utilized by the invoked logger. In the above, we would be populating the MDC meta information with a pair of variables of our choice. This is especially important if we are dealing with usernames and sessionIDs. In the above example, we would be setting the userId then using the lambda function to retrieve them.

Combining the simple logging calls we saw above with the MDC features allows you to fully enrich your logged output, which can save you a lot of time and headache if you are spending ages digging deep to find the root cause of a bug.

Pros and Cons of kotlin-logger

Kotlin-logger is simple to get started with, easily fitting into a new or existing Kotlin project. From simple use cases all the way to storing metadata like sessionID and usernames, kotlin-logger can get the job done.

Pro – Enriched logs 

Another benefit is having a logger without the class name itself in it. That would be a requirement if we were dealing with a Java logging framework like LOG4J. We are able to have a slightly cleaner codebase by going with the pure Kotlin approach.

Con – Small Community

The one drawback I would see to kotlin-logger is the lack of maintenance support it has on GitHub. This criticism might be a reflection on the fact that Kotlin is still not as popular as some of its counterparts, rather than the lack of popularity of the library itself. 

In fact, this seems to be the only well-structured, pure Kotlin logging library out there. It is easy to see why there are not many pure Kotlin logging libraries out there given its 100% interoperability with Java as previously mentioned. 

TIP: As of the writing of this article, kotlin-logger is safe for use with a Kotlin version dating up to the 20th of September 2020.

Common Pitfalls and Best Practices

So now that we have established how we can log in Kotlin, including logging of precious meta information, we can discuss some of the common pitfalls that happen when logging in Kotlin and how we can turn these into best practices.

Lack of Organization/Too Many Logs

If we are dealing with a big application, with hundreds of user requests happening a minute, not every log is important. If you find yourself with a very flooded logfile or console of logs, it might be time to either cut down the amount of log statements or split them into dedicated log files. Either way, organizing where your logs get sent to is very important for troubleshooting or optimization scenarios.

Also, not everything is important. Some things simply do not need to be logged. Overusing log statements is not only bad practice, but can also be potentially harmful to the running of your application, given the response time adding up.

Lack of Configurable Logging Levels

The use of severity levels, as featured in kotlin-logging for example, can be a very powerful tool. Flagging certain things as debug only, or some errors as fatal is much more useful than a huge mass of logs that are all labelled with the same level. If you have everything labelled as an error, the log file/stream can quickly get flooded with false positives.

The conditional approach to these severity levels can save time, and not to mention storage space on the lack of irrelevant logs.

Consistent Formatting

When logging in Kotlin, or any language for that matter, consistency is key within your logs. You want the format to be generally identical apart from key fields. This allows for easy categorization of your data, which will make analysis much easier in the long run as the data is collected.

An example of a logger with a custom formatted output could be:

TIMESTAMP | Severity Level | Function Name | Occurrence

If all of your logged outputs were of the form above, it would make it very easy to sort and filter the data.

Conclusion

The article has broken down why Kotlin is an increasingly popular choice for developers, as well as some of the best practices when it comes down to logging in the context of a Mobile Application. It should be clear as to how kotlin-logging works, how it can be added to a new or existing Kotlin project, and how we can extract valuable meta information into our logs through MDC.

We also looked at why severity levels and organized logs are important for a successful application, and how consistent formatting can be advantageous when it comes down to analysing logs, as it allows you to easily sort and search your logs.

Are Your Log Insights as Powerful as They Could Be?

Surveys show that developers spend roughly 25% of their time troubleshooting issues, amounting to over one working day per week! Let’s examine the solutions that will guide your developers to the log insights they need to efficiently troubleshoot issues.

Log Clustering

A noisy application or system can spew out tens of thousands of logs per day. Sifting through these for troubleshooting is both time-consuming and unlikely to elicit a clear solution. Log clustering groups logs together based on “templates”. This enables you to easily identify error or critical logs.

Identifying the Norm

Sounds great, right? Reviewing hundreds of clustered logs is faster and more insightful than reviewing millions of individual logs. However, it’s not that simple. Identifying the patterns for building these templates is not an easy task. A “baseline” of normal log activity can vary depending on time, stage in the release cycle, proximity to holiday periods, or myriad other factors.

Machine Learning for Log Clusters

Bringing a machine learning solution in to assist your log clustering is the answer. Machine learning algorithms use deep learning to analyze vast trends in tens of millions of logs. By summarizing rows of different log data into insights, a machine learning solution allows your developers to quickly identify abnormalities.

Support Releases

When your system is changed or updated, this will alter your overall build quality and performance. This in turn can affect the accessibility of insights from your logs, given the changing nature of their context. With the increase in releases using CI/CD, this becomes a compounded problem.

Automated Reporting

By generating benchmark reports which are tied to your deployment pipeline, you can give your developers the direct insights they need. They’ll see changes in software and system quality, without having to sift through a mountain of log outputs. These reports enable your team to fix failed releases and improve on successful deployments.

Known Errors

In the millions of logs your system produces every day, there will undoubtedly be several critical errors that you don’t need to immediately deal with. These may already be flagged for a future fix, may not actually be as critical as the alert purports, or simply may not relate to the area of the system you are responsible for. We group these together as known errors, and they create two problems.

Known Errors and Human Error

Known errors create a problem when they aren’t universally recorded, managed or acknowledged. If an outgoing developer forgets to tell his replacement about a known error, this will have severe consequences. Worse still, is that if a known error is believed to be assigned to a release for a fix, but isn’t, then it can end up being continuously ignored, potentially leading to a more critical situation. Automation is the answer to making sure that these don’t slip through the cracks.

Known Errors and Noise

In a complicated system or application, there’s likely to be a higher number of known errors, which may peak at points of high demand or mid-release. Having a large number of known errors complicates the diagnostic and troubleshooting process, and can obscure “true” issues which need to be identified and dealt with. Machine learning solutions can provide insights that differentiate between new anomalous and known errors, cutting down the time needed to identify new errors.

Fast Searches

Searching your logs requires a well indexed ELK stack to return all relevant results in a timely manner. Your queries need to be precise and properly structured, otherwise you won’t surface the relevant insights. You might end up wasting time structuring the correct query, or missing the relevant log altogether.

Simple Universal Queries to Find new Log Insights

The easiest way to search your logs is by having a unified interface that searches all of your log data. Making searches should be as simple as possible. No hoops to jump through. This enables you to surface the right insights quickly and accurately.

Better Insights, the Coralogix Way

As processors, analyzers, and optimizers of billions of logs every day, Coralogix has the solution to gleaning the most from your log outputs.

With Loggregation, we use machine learning to analyze your system’s baseline, enabling faster and more precise insight into errors. Our algorithm will simplify your jumbled logs down into standardized templates, allowing your developers to quickly identify anomalies. Loggregation, when combined with Coralogix’s automated manuals on known errors help you and your team better differentiate the noise of known errors from the real critical and error logs that you need to be aware of.

Benchmark Reports allow our customers to tag every aspect of their system so that, when an upgrade happens, the overall system performance can be visualized instantly. This eliminates the need to wait for a release-related error or performance issue, giving developers the gift of time and foresight. (https://coralogixstg.wpengine.com/docs/software-builds-display/)

Lastly, Coralogix’s advanced unified UI gives our customers the ability to carry out unstructured searches without parameters across their entire monitoring system, without needing any backend rearchitecting. This makes troubleshooting easier, helping developers resolve issues faster and opens up a world of new log insights to your organisation.

Elasticsearch Autocomplete with Search-As-You-Type

You may have noticed how on sites like Google you get suggestions as you type. With every letter you add, the suggestions are improved, predicting the query that you want to search for. Achieving Elasticsearch autocomplete functionality is facilitated by the search_as_you_type field datatype.

This datatype makes what was previously a very challenging effort remarkably easy. Building an autocomplete functionality that runs frequent text queries with the speed required for an autocomplete search-as-you-type experience would place too much strain on a system at scale. Let’s see how search_as_you_type works in Elasticsearch.

Theory

When data is indexed and mapped as a search_as_you_type datatype, Elasticsearch automatically generates several subfields

to split the original text into n-grams to make it possible to quickly find partial matches.

You can think of an n-gram as a sliding window that moves across a sentence or word to extract partial sequences of words or letters that are then indexed to rapidly match partial text every time a user types a query.

The n-grams are created during the text analysis phase if a field is mapped as a search_as_you_type datatype.

Let’s understand the analyzer process using an example. If we were to feed this sentence into Elasticsearch using the search_as_you_type datatype

"Star Wars: Episode VII - The Force Awakens"

The analysis process on this sentence would result in the following subfields being created in addition to the original field:

Field Example Output
movie_title The “root” field is analyzed as configured in the mapping ["star","wars","episode","vii","the","force","awakens"]
movie_title._2gram Splits sentence up by two words ["Star Wars","Wars Episode","Episode VII","VII The","The Force","Force Awakens"]
movie_title._3gram Splits the sentence up by three words ["Star Wars","Star Wars Episode","Wars Episode","Wars Episode VII","Episode VII", ... ]
movie_title._index_prefix This uses an edge n-gram token filter to split up each word into substrings, starting from the edge of the word ["S","St","Sta","Star"]

The subfield of movie_title._index_prefix in our example mimics how a user would type the search query one letter at a time. We can imagine how with every letter the user types, a new query is sent to Elasticsearch. While typing “star” the first query would be “s”, the second would be “st” and the third would be “sta”.

In the upcoming hands-on exercises, we’ll use an analyzer with an edge n-gram filter at the point of indexing our document. At search time, we’ll use a standard analyzer to prevent the query from being split up too much resulting in unrelated results.

Hands-on Exercises

For our hands-on exercises, we’ll use the same data from the MovieLens dataset that we used in earlier. If you need to index it again, simply download the provided JSON file and use the _bulk API to index the data.

wget https://media.sundog-soft.com/es7/movies.json
curl --request PUT localhost:9200/_bulk -H "Content-Type: application/json" --data-binary @movies.json

Analysis

First, let’s see how the analysis process works using the _analyze API. The  _analyze API enables us to combine various analyzers, tokenizers, token filters and other components of the analysis process together to test various query combinations and get immediate results.

Let’s explore edge ngrams, with the term “Star”, starting from min_ngram which produces tokens of 1 character to max_ngram 4 which produces tokens of 4 characters.

curl --silent --request POST 'https://localhost:9200/movies/_analyze?pretty' 
--header 'Content-Type: application/json' 
--data-raw '{
   "tokenizer" : "standard",
   "filter": [{"type":"edge_ngram", "min_gram": 1, "max_gram": 4}],
   "text" : "Star"
}'

This yields the following response and we can see the first couple of resulting tokens in the array:

Pretty easy, wasn’t it? Now let’s further explore the search_as_you_type datatype.

Search_as_you_type Basics

We’ll create a new index called autocomplete. In the PUT request to the create index API, we will apply the search_as_you_type datatype to two fields: title and genre.

To do all of that, let’s issue the following PUT request.

curl --request PUT 'https://localhost:9200/autocomplete' 
--header 'Content-Type: application/json' 
-d '{
   "mappings": {
       "properties": {
           "title": {
               "type": "search_as_you_type"
           },
           "genre": {
               "type": "search_as_you_type"
           }
       }
   }
}'
 
>>>
{"acknowledged":true,"shards_acknowledged":true,"index":"autocomplete"}

We now have an empty index with a predefined data structure. Now we need to feed it some information.

To do this we will just reindex the data from the movies index to our new autocomplete index. This will generate our search_as_you_type fields, while the other fields will be dynamically mapped.

curl --silent --request POST 'https://localhost:9200/_reindex?pretty' --header 'Content-Type: application/json' --data-raw '{
 "source": {
   "index": "movies"
 },
 "dest": {
   "index": "autocomplete"
 }
}' | grep "total|created|failures"

The response should return a confirmation of five successfully reindexed documents:

We can check the resulting mapping of our autocomplete index with the following command:

curl localhost:9200/autocomplete/_mapping?pretty

You should see the mapping with the two search_as_you_type fields:

Search_as_you_type Advanced

Now, before moving further, let’s make our life easier when working with JSON and Elasticsarch by installing the popular jq command-line tool using the following command:

sudo apt-get install jq

And now we can start searching!

We will send a search request to the _search API of our index. We’ll use a multi-match query to be able to search over multiple fields at the same time. Why multi-match? Remember that for each declared search_as_you_type field, another three subfields are created, so we need to search in more than one field.

Also, we’ll use the bool_prefix type because it can match the searched words in any order, but also assigns a higher score to words in the same order as the query. This is exactly what we need in an autocomplete scenario.

Let’s search in our title field for the incomplete search query, “Sta”.

curl -s --request GET 'https://localhost:9200/autocomplete/_search?pretty' --header 'Content-Type: application/json' --data-raw '{
   "size": 5,
   "query": {
       "multi_match": {
           "query": "Sta",
           "type": "bool_prefix",
           "fields": [
               "title",
               "title._2gram",
               "title._3gram"
           ]
       }
   }
}'

You can see that indeed the autocomplete suggestion would hit both films with the Star term in their title.

Now let’s do something fun to see all of this in action. We’ll make our command interpreter fire off a search request for every letter we type in.

Let’s go through this step by step.

  1. First, we’ll define an empty variable. Every character we type will be appended to this variable.
INPUT=''
    1. Next, we will define an infinite loop (instructions that will repeat forever, until you want to exit and press CTRL+C or Cmd+C). The instructions will do the following:

a) Read a single character we type in.
b) Append this character to the previously defined variable and print it so that we can see what will be searched for.
c) Fire off this query request, with what characters the variable contains so far.
d) Deserialize the response (the search results), with the jq command line tool we installed earlier, and grab only the field we have been searching in, which in this case is the title
e) Print the top 5 results we have received after each request.

while true
do
 IFS= read -rsn1 char
 INPUT=$INPUT$char
 echo $INPUT
 curl --silent --request GET 'https://localhost:9200/autocomplete/_search' 
 --header 'Content-Type: application/json' 
 --data-raw '{
     "size": 5,
     "query": {
         "multi_match": {
             "query": "'"$INPUT"'",
             "type": "bool_prefix",
             "fields": [
                 "title",
                 "title._2gram",
                 "title._3gram"
             ]
         }
     }
 }' | jq .hits.hits[]._source.title | grep -i "$INPUT"
done

If we would be typing “S” and then “t”→”a”→”r”→” “→”W”, we would get result like this:

Notice how with each letter that you add, it narrows down the choices to “Star” related movies. And with the final “W” character we get the final Star Wars suggestion.

Congratulations on going through the steps of this lesson. Now you can experiment on much bigger datasets and you are well prepared to reap the benefits that the Search_as_you_type datatype has to offer.

Learn More

If, later on, you want to dig deeper on how to get such data, from the Wikipedia API, you can find a link to a useful article at the end of this lesson

Monitoring Jenkins: Essential Jenkins Logs to Watch Out For

Monitoring Jenkins is a serious challenge. Continuous auditing and logging are often overlooked, but it provides a wealth of information about the health of your Jenkins instance. The following are some approaches to generating informative logging to these issues, that can help to monitor and provide suitable explanations of where the problems lie; even identifying what the possible solutions are.

RAM usage on your Jenkins Instance

When Jenkins is running or has run out of RAM, it normally has a few root causes:

  • growth in data size requiring a bigger heap space
  • a memory leak
  • The operating system kernel running out of virtual memory
  • multiple threads need the same locks but obtain them in a different order

To identify the root cause of memory leaks, it normally requires access to one of three log sources. Those being the garbage collection logs, a heap dump, or a thread dump. These three sources are hugely important when monitoring Jenkins.

To demonstrate an OOM (OutofMemory) issue, a snippet from stdout log shows a Jenkins instance on a Master node, throwing such an error. Usually, when you see an OutOfMemory error and it references threads, this is commonly a native (system) out of memory because each additional thread that the JVM (Java Virtual Machine) spawns uses native memory (as opposed to Java Heap memory). The advice, in this case, would be to lower the Java heap size – since a large Java heap is crowding out the address space that needs to be used for keeping track of new threads

Monitoring Jenkins: Java Stack

When Jenkins does perform a rebuild though, it will keep the jobs and build data on the filesystem and load the new format to the memory. This can also lead to high memory consumption and result in slow UI responsiveness and OOM errors. To avoid such cases as the one demonstrated, it is best to open the old data management page (located at your-jenkins-url/administrativeMonitor/OldData/manage), verify that the data is not needed, and clear it.

A key tip to managing the RAM or heap usage is to define the right heap size or ensure it is throttled. When defining the heap size, there is a very important JVM feature you should consider implementing on the JVM for Jenkins. This feature is called UseCompressedOops, and it works on 64 bit platforms, which are now most often used. What it does, is to shrink the object’s pointer from 64bit to 32bit, thus saving a lot of memory. Enabling the configuration of Memory usage thresholds (throttle usage), can enable job builds to fail or be unstable, but notify users if memory usage goes beyond the maximum available.

You need to constantly check and analyze Jenkins performance by implementing configurations for:

  • Monitoring memory usage. This checking and monitoring RAM memory usage continuously for Jenkins master / slave node
  • Checking java memory leak
  • Adding correct java option arguments/parameters which are suggested by Jenkins official documents
  • Monitoring with the correct plugin. The monitoring plugin will help you to monitor running setup with live scaled data. This will involve, install the monitoring plugin and monitor Jenkins memory usage
  • With the plugin, add monitoring alerts for deadlock, threads, memory, and active sessions. You can add monitoring alerts to capture threshold baseline details and present it in tooling such as the ELK ‘stack’ – ElasticSearch, LogStash, Kibana, to perform a search, analysis, and visualization operations in real-time

CPU consumption

Jenkins doesn’t normally need a lot of processing power to work, but memory and storage performance issues can make the CPU load spike exponentially. When Jenkins is performing tasks, CPU usage will rise and/or spike temporarily. Once the CPU intensive process completes, the CPU usage should drop down to a lower level. When you’re monitoring Jenkins, the CPU usage is of paramount importance.

However, if you are receiving high CPU alerts or are experiencing application performance degradation, this may be due to a Jenkins process being stuck in an infinite loop (normally deadlock threads), repeated full Garbage collections, or that the application has encountered an unexpected error. If the JVM for Jenkins is using close to 100% of the CPU consumption, it will constantly have to free up processing power for different processes, which will slow it down and may render the application unreachable. When you’re monitoring Jenkins, you need to be able to catch these issues quickly.

To demonstrate high CPU usage, a snippet from stdout log, indicates high usage with a deadlock when queueing up jobs from a Jenkins Master instance. Causing the issue is the OutOfMemoryError: PermGen space error. PermGen is one of the primary Java memory regions and has a limited amount of memory without customization. Application of the JVM parameters -Xmx and -XX:MaxPermSize will help rectify this problem. If you do not explicitly set the sizes, platform-specific defaults will be used, this potential issue can occur.

Monitoring Jenkins: jenkins stack error

In order to reduce the CPU usage, you do need to determine what processes are taxing your CPU. The best way of diagnosing this is by executing the jenkinshangWithJstack.sh script while the CPU usage is high, as it will deliver the outputs of top and top -H while the issue is occurring, so you can see which threads are consuming the most CPU.

The following heap stack example shows that the Jenkins UI has become unresponsive, after running the jenkinshangWithJstack.sh script to gather data. In the output it shows the JVM is consuming a high amount of CPU:

Excessive CPU usage can be reduced or tempered by the following actions:

  • Minimizing the number of builds on the master node. This meaning you want to make the Jenkins master as “free” from work as you can, leaving the CPU and memory to be used for scheduling and triggering builds on slaves only
  • Looking at the garbage collection logs to see if there’s a memory leak
  • From repeated build processes, not keeping too much of the build history. Trying to limit it
  • Making sure your Jenkins & installed plugins version, are installed with the most up to date stable releases
  • Constantly monitor CPU performance, by checking and monitoring the CPU usage for Jenkins slaves the master node. Resulting outputs can be analyzed in the ELK stack

Managing the Garbage Collector (GC)

The garbage collector is an automatic memory management process.

Its main goal is to identify unused objects in the heap and release the memory that they hold. Some of the GC actions can cause the Jenkins program to pause. This will mostly happen when it has a large heap (normally 4GB). In those cases, GC tuning is required to shorten the pause time. If Jenkins is processing a large heap but requires low pause times, then you should consider as a starting point, the use of the G1GC collector. It will help manage its memory usage more efficiently.

A typical case example is when the java.lang.OutOfMemoryError: GC overhead limit exceeded error happens within a Jenkins instance. This is the JVM’s way of signaling that Jenkins is spending too much time doing garbage collection with too little result. By default the JVM is configured to throw this error if it spends more than 98% of the total time doing GC and when after the GC only less than 2% of the heap is recovered. The Garbage collector is always running behind the scenes, and when you’re monitoring Jenkins, you need to make sure it is running efficiently.

So when trying to build jobs in Jenkins from the Master node, and the build log (or stdout file) presents this repeated output…

Exception in thread "main" Java.lang.OutOfMemoryError: GC overhead limit exceeded.

…it is suggesting to clear any old builds which have been deployed way back in time (weeks or possibly months) and to consider increasing the build counter in Jenkins.

Through the use of a heap histogram as demonstrated, this can identify where the GC shows a large heap area (of 4GB) and its current usage from the Jenkins instance.

To manage the Garbage Collector more effectively and allow it to compact the heap on-the-go, it is suggested to apply the following configurations.

  • Enable GC logging
  • Enable G1GC – this is the most modern GC implementation (depending on JDK version)
  • Monitor GC behavior with plugins, services or toolings
  • Tune GC with additional flags as needed
  • Utilise the ELK stack to analyze the logging source
  • Keep monitoring and attach any key metric alerting to the logging process

This will involve tuning the garbage collection and setting arguments on the JVM for Jenkins.

Resulting in a more detailed, explanatory and transparent approach to log management and the monitoring of the garbage collector. Key is to parse effective logging, through primarily CUI/GUI GC monitoring tools, so as to provide better visualization of the issue and to identify and isolate, where any slow unresponsive behaviour Jenkins is showing.

Pipeline Build Failures

It is pretty common when starting with Jenkins to have a single server which runs the master and all builds, however Jenkins architecture is fundamentally ‘Master and Agent (slave)’. The master is designed to do coordination and provide the GUI and API endpoints, and the agents are designed to perform the work. The reason being that workloads are often best ‘farmed out’ to distributed servers.

When Jenkins is used in cloud environments, it has many integrations with agents, plugins and extensions, to support those various environmental elements. This may involve Virtual Machines, Docker Containers, Kubernetes, AWS (EC2), Azure, Google Cloud, VMWare and other external components. Where problems can arise in those build jobs, is if you use Jenkins as just a master instance, and finding that you start to run out of resources such as memory, CPU, etc. At that point you need to consider either upgrading your master or setting up agents to pick up the load. You might also need to factor having several different environments to test your builds.

When Jenkins Jenkins spins up an agent, you are likely dealing with a plugin that manages that agent. The fact that you need plugins in Jenkins to do just about anything can be problematic — and not only because it means software delivery teams have to spend time installing and configuring them before they can start working. A bigger issue will come into play here, in that most of Jenkins’ plugins are written by third parties, vary in quality, and may lose support without notice.

If the plugin version is out of sync, such as one to create Jenkins agents in Azure Virtual Machines, then the following error can occur is displayed in a stdout or build log:

This provisioning agent error shown, was specific to a bug not identified before release and applied outside of a repository used for approved build dependencies.

To ensure you follow some best practice for you build pipeline:

  • Avoid where possible, running jobs on the Master. User a master/slave (node) configuration. Ideally each jobs should run on slave and make sure you are executing jobs on slave to have minimum load on master node
  • Add correct cleanup configuration to delete old jobs from the master node
  • Add the correct memory configurations and limits for the Jenkins deployment
  • Use a central, shared and supported repository for build dependencies, so ensuring a cleaner, more reliable and safer build job workspace
  • Install only supported plugins and avoid those that have memory leak issues. Make sure you are installing correct plugins that you can test on a staging (testing) server first, before consideration of installing them in production
  • Avoid installing unwanted plugins, and checking before installing them, that they are security compliant and do not having security vulnerabilities
  • Export build logs to the ELK stack. In case of a large amount of running jobs, it can become difficult to keep track of all the activity. So collecting all this data and shipping it into the ELK Stack, can help to give you more visibility and identify any issues

Permission / Security related Issues

Jenkins is a tool that needs to interface with a myriad of systems and applications throughout DevOps environments. It needs unabridged access to code and artifacts, and to accomplish its role as the ‘steward,’ Jenkins must have access to a considerable breadth of credentials – or secrets – from usernames and passwords to source control and artifact deployment. When monitoring Jenkins, it’s tempting to only think about operational issues, but security issues come up regularly.

All too often, users who use Jenkins do have a propensity to treat security as secondary. The business risk of not securing your Jenkins servers is high. You need to ensure that user authentication is established and enforce access control policies to your Jenkins servers. Due to the centrality of its role, a breach of your Jenkins servers can end up exposing access credentials to your most valuable resources. Key to securing Jenkins, is ensuring there is an elimination of weaknesses related to misconfigured environments and poorly constructed security controls. This mainly related to authentication and authorization policies.

Understanding how to apply security controls can be seen in this log output, when encountering a problem trying to launch a pipeline Job with access to a Git repository.

The permission denied error meant there was something wrong with the credential(s) in the job definition, provided by Jenkins to access the Git server. It was corrected with an ‘id_rsa’ credential (permission).

To ensure you follow some best practice for securing your Jenkins instance and jobs:

  • Enable Jenkins’ security. Jenkins global security is the first line of defense in protecting the asset it controls. Core Jenkins supports four security realms: delegate to servlet container, Jenkins’s own user database, LDAP, and Unix user/group database
  • Consider the use of the Jenkins credentials plugin, that can provide a default internal credentials store. This can be used to store high value or privileged credentials, such as GitHub tokens
  • Configuring access control in Jenkins using a Security Realm and Authorization configuration. A Security Realm, informs the Jenkins environment, how and where to pull user (or identity) information from. Authorization configuration which informs the Jenkins environment as to which users and/or groups can access which aspects of Jenkins

Jenkins can provide various ways of keeping track of an instance, with two main categories of logs represented: system logs and build logs. Jenkins will provide some pretty useful in-console capabilities, for keeping track of your builds using these logs. As Jenkins takes constant effort to monitor, getting the context right in the form of the most informative logging, is critical to managing the most common and valid issues.

Is your logging ready for the future?

Log scaling is something that should be top of mind for organizations seeking to future-proof their log monitoring solutions. Logging requirements will grow through use, particularly if not maintained or utilized effectively. There are barriers to successful log scaling, and in this post we’ll be discussing storage volume problems; increased load on the ELK stack, the amount of ‘noise’ generated by a growing ELK stack, and the pains of managing burgeoning clusters of nodes.

Growing Storage Requirements

Capacity is one of the biggest considerations when looking at scaling your ELK stack. Regardless of whether you are looking at expanding your logging solution, or just seeking to get more out of your existing solution, storage requirements are something to keep in mind.

If you want to scale your logging solution, you will increasingly lean on your infrastructure engineers to grow your storage, better availability and provisioning backups – all of which are vital to support your ambitions for growth. This is only going to draw attention away from their primary functions, which include supporting the systems and products which are generating these logs! You may find yourself needing to hire or train staff specifically to support your logging aspirations – this is something to avoid. Log output volumes can be unpredictable, and your storage solution should be elastic enough to support ELK stack scaling.

If you’re reading this then it is likely you are looking at log scaling to support some advanced analytics, potentially using machine learning (ML). For this to be effective, you need the log files to be in a highly available storage class. To optimize your storage provisioning for future ELK stack requirements, look at Coralogix’s ELK stack SaaS offering. Coralogix’s expertise when it comes to logging means that you can focus on what you want to do with your advanced logging, and we will take care of the future proofing.

Increased noise in the logs

So you want to scale your log solution? Well you need to prepare for the vast volume of logs that a scaled ELK stack is going to bring with it. If you aren’t sure exactly how you plan to glean additional insights from your bigger and better ELK stack deployment, then it most certainly isn’t of much use. 

In order to run effective machine learning algorithms over your log outputs, you need to be able to define what is useful and what is not. This becomes more problematic if you have yet to define what is a “useful” log output, and what is not. The costs associated with getting your unwieldy mass of logs into a workable database will quickly escalate. Coralogix’s TCO calculator (https://coralogixstg.wpengine.com/tutorials/optimize-log-management-costs/) will give you the ability to take stock over what is useful now, and help you to understand what outputs will be useful in the future, making sure that your scaled log solution gives you the insights you need.

Load on the ELK Stack

Optimizing the performance of each of the constituent parts of the ELK stack is a great way of fulfilling future logging-related goals. It isn’t quite as easy as just “turning up” these functions – you need to make sure your ELK stack can handle the load first.

The Load on Logstash

You can adjust Logstash to increase parsing, but this increases the ingestion load. You need to ensure that you have allocated sufficient CPU capacity for the ingestion boxes, but a common Logstash problem is that it will hoover up most of your processing capacity unless properly configured. Factor in your ingestion queue and any back pressure caused by persistent queues. Both of these issues are not only complex in resolution, but will hamper your log scaling endeavours. 

The Load on Elasticsearch

The load on Elasticsearch when scaled can vary greatly depending on how you choose to host it. With Elasticsearch scaling on-prem, failure to properly address and configure the I/O queue depth will grind your cluster to a total standstill. Of bigger importance is the compressed object pointer – if you approach its 32GB heap limit (although Elastic still isn’t certain that the limit isn’t even lower, elastic.co/blog/a-heap-of-trouble) then performance will deteriorate. Both of these Elasticsearch concerns compound with the volume or extent of ELK stack scaling you are attempting, so perhaps you should delegate this out to Coralogix’s fully managed ELK stack solution.

The Configurational Nuances of Log Scaling

Whilst forewarned is forearmed when it comes to these log scaling problems, you’re only well prepared if you have fully defined how you plan to scale your ELK stack solution. The differences and considerations for a small architecture logging solution scaling upward are numerous and nuanced: discrete parsing tier or multiple parsing tier; queue mediated ingestion or multiple event stores represent just a few of the decisions you have to make when deciding to scale. Coralogix have experience in bringing logging scalability to some of the industry’s biggest and most complex architectures. This means that whatever future proofing issues may present themselves, Coralogix will have seen them before.

Increased cluster size

The last tenet of log scaling to be mindful of is the implication of having larger clusters with bigger or more nodes. This brings with it a litany of issues guaranteed to cause you headaches galore if you lack some serious expertise.

Every time you add a node to a cluster, you need to ensure that your network settings are (and remain) correct, particularly when running Logstash, Beats or Filebeats on separate ELK and client servers.. You need to ensure that both firewalls are correctly configured, and this becomes an enterprise-sized headache with significant log scaling and cluster augmentation. An additional networking trap is the maintenance of Elasticsearch’s central configuration file. The larger the ELK stack deployment, the greater the potential for mishap in the config of this file, where the untrained or unaware will get lost in a mess of ports and hosts. At best, you have the possibility of networking errors and a malfunctioning cluster, but at worst, you will have an unprotected entrypoint into your network. 

Scaling isn’t as easy as it sounds

Adding more nodes, if done correctly, will fundamentally make your ELK stack more powerful. This isn’t as simple as it sounds as every node needs to be balanced to run at peak performance. Whilst Elasticsearch will try and balance shard allocation for you, this is a “one size fits all” configuration, and may not get the most out of your cluster. Shard allocation can be manually defined, but this is an ongoing process that changes with new indices, new clusters and any network changes. 

Where does Coralogix come in?

Coralogix are experts when it comes to log scaling and future proofing ELK stack deployments, dealing with shards, nodes, clusters and all of the associated headaches on a daily basis. The entire Coralogix product suite is designed to make log scaling, both up and down, headache free and fully managed. 

AWS Elasticsearch Pricing: Getting Cost Effective Logging as You Scale

AWS Elasticsearch is a common provider of managed ELK clusters., but does the AWS Elasticsearch pricing really scale? It offers a halfway solution for building it yourself and SaaS. For this, you would expect to see lower costs than a full-blown SaaS solution, however, the story is more complex than that.

We will be discussing the nature of scaling and storing an ELK stack of varying sizes, scaling techniques, and run a side by side comparison of AWS Elasticsearch and the full ELK Coralogix SaaS stack. It will become clear that there are lots of costs to be cut – in the short and long term, using IT cost optimizations.

Scaling your ELK Stack

ELK Clusters may be scaled either horizontally or vertically. There are fundamental differences between the two, and the price and complexity differentials are noteworthy.

Your two scaling options

Horizontal scaling is adding more machines to your pool of resources. In relation to an ELK stack, horizontally scaling could be reindexing your data and allocating more primary shards to your cluster, for example.

Vertical scaling is supplying additional computing power, whether it be more CPU, memory, or even a more powerful server altogether. In this instance, your cluster is not becoming more complex, just simply more powerful. It would seem that vertically scaling is the intuitive option, right? There are some cost implications, however…

Why are they so different in cost?

As we scale horizontally, we have a linear price increase as we add more resources. However, when it comes to vertically scaling, the cost doubles each time! We are not adding more physical resources. We are improving our current resources. This causes costs to increase at a sharp rate.

AWS Elasticsearch Pricing vs Coralogix ELK Stack

In order to compare deploying an AWS ELK stack versus using Coralogix SaaS ELK Stack, we will use some typical dummy data on an example company:

  • $430 per day going rate for Software Engineer based on San Francisco
  • High availability of data
  • Retention of data: 14 Days

We will be comparing different storage amounts (100GB, 200GB, and 300GB / month). We have opted for a c4.large and r4.2xlarge instances, based on the recommendations from the AWS pricing calculator.

Compute Costs

With the chosen configuration, and 730 hours in a month, we have: ($0.192 * 730) + ($0.532 * 730) = $528 or $6,342 a year

Storage Costs with AWS Elasticsearch Pricing

The storage costs are calculated as follows, and included in the total cost in the table below: $0.10 * GB/Day * 14 Days * 1.2 (20% extra space recommended). This figure increases as we increase the volume, from $67 annually to $201.

Setup and Maintenance Costs

It takes around 7 days to fully implement an ELK stack if you are well versed in the subject. At the going rate of $430/day, it costs $3,010 to pay an engineer to implement the AWS ELK stack. The full figures, with the storage volume costs, are seen below. Note that this is the cost for a whole year of storage, with our 14-day retention period included.

In relation to maintenance, a SaaS provider like Coralogix takes care of this for you, but with a provider like AWS, extra costs must be accounted for in relation to maintaining the ELK stack. If we say an engineer has to spend 2 days a month performing maintenance, that is another $860 dollars a month, or $10,320 a year.

The total cost below is $6,342 (Compute costs) + $3,010 (Upfront setup costs) + Storage costs (vary year on year) + $10,320 (annual maintenance costs)

Storage Size Yearly Cost
1200 GB (100 GB / month) $19,739
2400 GB (200 GB / month) $19,806
3600 GB (300 GB / month) $19,873

Overall, deploying your own ELK stack on AWS will cost you approximately $20,000 dollars a year with the above specifications. This once again includes labor hours and storage costs over an entire year. The question is, can it get better than that?

Coralogix Streama

There is still another way we can save money and make our logging solution even more modern and efficient. The Streama Optimizer is a tool that allows you to organize logging pipelines based on your application’s subsystems by allowing you to structure how your log information is processed. Important logs are processed, analyzed and indexed. Less important logs can go straight into storage but most important, you can keep getting ML-powered alerts and insights even on data you don’t index.

Let’s assume that 50% of your logs are regularly queried, 25% are for compliance and 25% are for monitoring. What kind of cost savings could Coralogix Streama bring?

Storage Size  AWS Elasticsearch (yearly) Coralogix w/ Streama (yearly)
1200 GB (100 GB / month) $19,739 $1,440
2400 GB (200 GB / month) $19,806 $2,892
3600 GB (300 GB / month) $19,873 $4,344

AWS Elasticsearch Pricing is a tricky sum to calculate. Coralogix makes it simple and handles your logs for you, so you can focus on what matters.

.NET Logging: Best Practices for your .NET Application

Web application logging best practices

Logging monitoring is a key requirement of any production application. .NET Core offers support for outputting logs from your application. It delivers this capability through a middleware approach that makes use of the modular library design. Some of these libraries are already built and supported by Microsoft and can be installed via the NuGet package manager, but a third party or even custom extensions can also be used for your .NET logging.

This article aims to give an introduction into how logging works in .NET Core 3.1 and offer some best practices to consider when building out your logging approach.

Prerequisites

Before we can get started, there are a few things you will need to follow along. First, you will want the following installed on your local machine.

While this article assumes only a basic awareness of the C# language and .NET Core framework, it is worth spending some time reading up on some of the concepts that we will cover.

Let’s get started

This article will be going through some logging techniques that can be applied to a .NET Core 3.1 application. But before we can get started with .NET logging, we need an application we can change. I have prepared such an application, which is hosted on GitHub. So, let us go ahead and clone the repository so we can begin. Run the following command from the terminal to clone the repository to a local folder.

$ git clone https://github.com/sladesoftware/dotnet-core-3-1
$ cd dotnet-core-3-1

To test that this application works properly, run the following command in the terminal from the root project folder.

  $ dotnet run

  [Output]
  info: Microsoft.Hosting.Lifetime[0]
        Now listening on: https://localhost:5001
  info: Microsoft.Hosting.Lifetime[0]
        Now listening on: https://localhost:5000
  info: Microsoft.Hosting.Lifetime[0]
        Application started. Press Ctrl+C to shut down.

You can use the cURL tool at this point to test the different endpoints. There are some simple scripts under the scripts/ folder, which will help here. For more information on how to work with this application, refer to the README file.

Where do we log to?

We do not. Not currently, at least. The default configuration allows basic console logging, but we have not made use of the .NET logging pipeline at all. So, all exceptions that occur, HTTP requests and any internal actions; are not logged anywhere. In this simple case, that is not really a problem. But if this were a production application and something went wrong, we would find it difficult to diagnose the cause of the issue.

The logging pipeline

.NET Core 3.1 applications are built using a middleware approach. An application host is configured to use a collection of different middleware components. When the application is running, these components set up the services and configuration available. Logging is achieved out of the box with this same approach.

With other frameworks (including the earlier version of .NET) you would have to install a third-party logging library and configure that manually to be incorporated within your application. For .NET Core 3.1, Microsoft has developed their own logging libraries, which are installed by default in our application. As detailed in the Logging in .NET Core article listed in the Prerequisites section, you will notice that our application makes use of the CreateDefaultBuilder method in the Program.cs file, which configures the logging middleware part to use Console, Debug and EventSource logging providers.

Before we look at how we configure this further, we will look at how to make use of it. We will specifically be focusing on the output from the Console logging provider. Open the TodoController.cs file and inject a logger for the class to use.

  using System.Collections.Generic;
  using System.Linq;
  using Microsoft.AspNetCore.Mvc;
  using Microsoft.Extensions.Logging;
 
  namespace DotnetApplication.Api.Controllers
  {
      [ApiController]
      [Route("api/[controller]")]
      public class TodoController : ControllerBase
      {
          private readonly ILogger logger;
          private readonly TodoItemStore store;
 
          public TodoController(ILogger<TodoController> logger, TodoItemStore store)
          {
              this.logger = logger;
              this.store = store;
          }

       ... 
   }

You can see here that we are able to inject a logger dependency into our class constructor. This is because the default configuration registers a logging provider factory with the built-in dependency injection system within .NET Core 3.1. You will notice that the parameter into the constructor is a generic type referencing the class itself. This is a requirement when using the .NET logging framework as it allows the factory to create a logger instance specific to that class. This approach adds a little extra context into log messages and allows class and namespace specific log level configuration (more on that later).

Now that we have a logger in our class, let us call it from one of our methods. Add the following code to the Get method.

  [HttpGet("{fail:bool?}")]
  public IActionResult Get(bool fail = false)
  {
      logger.LogInformation("Hello from the Get() method!");
 
      if (fail) throw new System.Exception("Simulated failure");
 
      return Ok(store.GetItems());
  }

Restart the application and send a GET request to the /api/todo endpoint.

$ curl –kL localhost:5000/api/todo

If you look at the output of the application itself (not the response returned by cURL) you should see our information message logged to the console.

  info: DotnetApplication.Api.Controllers.TodoController[0]
        Hello from the Get() method!

Go ahead and add a few more calls to the logger. Be sure to try logging distinct levels of information, such as errors and warnings as well.

Coralogix and Logging Levels

Coralogix offers support for quota optimisation. With our Quota optimizer, you’ll be able to visualize your noisiest applications, broken down by your .NET logging level.

Logging in JSON

While logging to the console is great when you are developing the application and running it locally, it is not very helpful for production applications as the output is often transient and therefore lost as soon as it is output (unless you happen to be watching the output at the time). Under a production environment, it is often more useful to store the log messages somewhere else. A simple alternative to the console here is to write the log messages to a JSON file, stored somewhere on the hard drive.

Microsoft has not yet developed a .NET logging extension library to handle writing log entries to a JSON file. So, for this part, we will look to a third-party library to serve this purpose: Serilog. This is an open-source library that builds upon the logging middleware built into .NET Core 3.1 and provides the ability to write our entries to a JSON file with little other configuration.

To get started, let us add the Serilog package to our project.

  $ dotnet add package Serilog.Extensions.Logging.File

This will install the required package to our project and pull down all dependencies to allow us to build the project with this added library. Now we need to configure our logging middleware part to write to a JSON file using this new provider. Add the following to the Program.cs class.

  public static IHostBuilder CreateHostBuilder(string[] args) =>
      Host.CreateDefaultBuilder(args)
          .ConfigureLogging((_, builder) =>
          {
                builder.AddFile("logs/app-{Date}.json", isJson: true);
          })
        .ConfigureWebHostDefaults(webBuilder =>
          {
                webBuilder.UseStartup<Startup>();
          });
   }

That’s it! If you run the application again and hit your endpoints, you should see a JSON file appear under the logs/ folder. That file will hold a lot of information about the HTTP requests, custom log messages, and more, all in JSON format.

Does Coralogix Process JSON?

Coralogix is at home with JSON logs. With structured input, you’ll be able to take advantage of the full range of Coralogix products – from live tail to machine learning.

How to manage codebases for .NET Logging

If you have started adding some extra calls to the logger in your methods, you will start to see how littered code can become with calls to a logger. To give some context to this, let us add some more calls to the logger to the Update method.

  [HttpPatch("{id:int}/{fail:bool?}")]
  public IActionResult Update([FromBody] TodoItem item, int id, bool fail = false)
  {
      logger.LogInformation($"Enter /api/todo/{id}/{fail}");
 
      if (fail)
      {
          logger.LogError("Fail is set to true, so simulating failure");
 
          throw new System.Exception("Simulated failure");
      }
 
      if (item == null)
      {
          logger.LogWarning("No JSON body, returning HTTP 400 - Bad Request");
 
          return BadRequest();
      }
 
      if (!store.ReplaceItem(id, item))
      {
          logger.LogWarning($"No items exist with Id {id}, returning HTTP 404 - Not Found");
 
          return NotFound();
      }
 
      logger.LogInformation($"Item {id} updated, returning HTTP 200 - OK");
 
      return Ok("OK - Updated");
  }

You can see from this example that the code is now definitely littered. It has the effect of obscuring what the method is doing, as there is a lot of “noise” in the form of calls to the logger. This is quite a common approach to logging. This section will offer some tips to help reduce this noise, while still getting value from your logs.

Changing the log level

The first part I wanted to mention is around configuring the application to change what is logged. This is not related to reducing noise in the code but will help when reducing noise in the logs that are output. Often, this simple approach will help with small production systems, but when you start scaling out to larger systems, you will want to investigate external log collection and analysis systems that can handle large volumes of logs, such as the Elastic Stack.

In our example above, we have output 3 distinct levels of log messages: Information, Warning and Error. If you look at the appsettings.json and appsettings.Development.json files, you will see some configuration around log levels.

  {
    "Logging": {
      "LogLevel": {
        "Default": "Information",
        "Microsoft": "Warning",
        "Microsoft.Hosting.Lifetime": "Information"
      }
    },
    "AllowedHosts": "*"
  }

We will not go into too much detail here, but there are a few points worth mentioning. Firstly, you can define different log levels per namespace or class, or even just something to fall back on (the default). You can also include more files that correspond to the environment and then configure the log levels differently there. For example, in this application, we have an appsettings.Development.json file. This could set all log levels to Information so that we see everything that is logged during development. We could then define more restrictive log levels (I.e. just warning and errors) in the main appsettings.json file (or you can include an appsettings.Production.json file for Production-specific configuration). Using this approach, we would have verbose logging when we are running the application locally during development, but more restrictive logging when the application is running in production. You can read more about this here.

Logging exceptions through the middleware

Let us try to reduce some of the noise now in our method. We are going to log exception information using a middleware approach. By default, the pipeline we are using already has some middleware set up to include this, as well as more to log the HTTP requests and responses in terms of endpoints and status codes. But we will add something custom to gain an understanding as to how it will work.

To add middleware, we have two options. We can either create a new class and register that class with the pipeline, or we can simply add a lambda expression. We will take this former approach here as we want to be able to inject a logger instance into our middleware component. With that in mind, create a new file at the project root called UnhandledExceptionMiddleware.cs and enter the following code.

  using Microsoft.AspNetCore.Http;
  using Microsoft.Extensions.Logging;
  using System;
  using System.Threading.Tasks;
 
  namespace DotnetApplication.Api
  {
      public class UnhandledExceptionMiddleware
      {
          private readonly ILogger logger;
          private readonly RequestDelegate next;
 
          public UnhandledExceptionMiddleware(ILogger<UnhandledExceptionMiddleware> logger, RequestDelegate next)
          {
              this.logger = logger;
              this.next = next;
          }
 
          public async Task Invoke(HttpContext context)
          {
              try
              {
                  await next(context);
              }
              catch (Exception exception)
              {
                  logger.LogError(exception,
                      $"Request {context.Request?.Method}: {context.Request?.Path.Value} failed");
              }
          }
      }
  }

This is a quite simple component – it invokes the next step in the pipeline but wraps it in a try-catch. If an exception is thrown further down the chain, this component will catch it and then output an error log message with the content of the exception and a brief message detailing the request that failed.

We now need to hook this up, so add the following one line to our Startup.cs class.

  public void Configure(IApplicationBuilder app, IWebHostEnvironment env)
  {
      if (env.IsDevelopment())
      {
          app.UseDeveloperExceptionPage();
      }
 
      app.UseMiddleware<UnhandledExceptionMiddleware>();

      app.UseHttpsRedirection();
      app.UseRouting();
      app.UseAuthorization();
 
      app.UseEndpoints(endpoints =>
      {
          endpoints.MapControllers();
      });
  }

Note: This needs to be added after the app.UseDeveloperExceptionPage() call, as that adds another piece of middleware that will swallow the exception.

Now that we have set up our custom middleware component, run the application again. If you trigger one of the exception endpoints (by specifying true for the fail route parameter) then you should see our new log message appear in the console (and JSON log file).

  ...
  fail: DotnetApplication.Api.UnhandledExceptionMiddleware[0]
        Request GET: /api/todo/true failed
  System.Exception: Simulated failure
     at DotnetApplication.Api.Controllers.TodoController.Get(Boolean fail) in ...
  ...

Logging requests and responses

Let us now create another middleware component. This time, we want to log the full body of our HTTP requests and responses. This is partly already covered by the built-in middleware class Microsoft.AspNetCore.Routing.EndpointMiddleware. Looking at a sample of this from the Serilog output in our JSON file, we can see there are several entries around an HTTP request being handled.
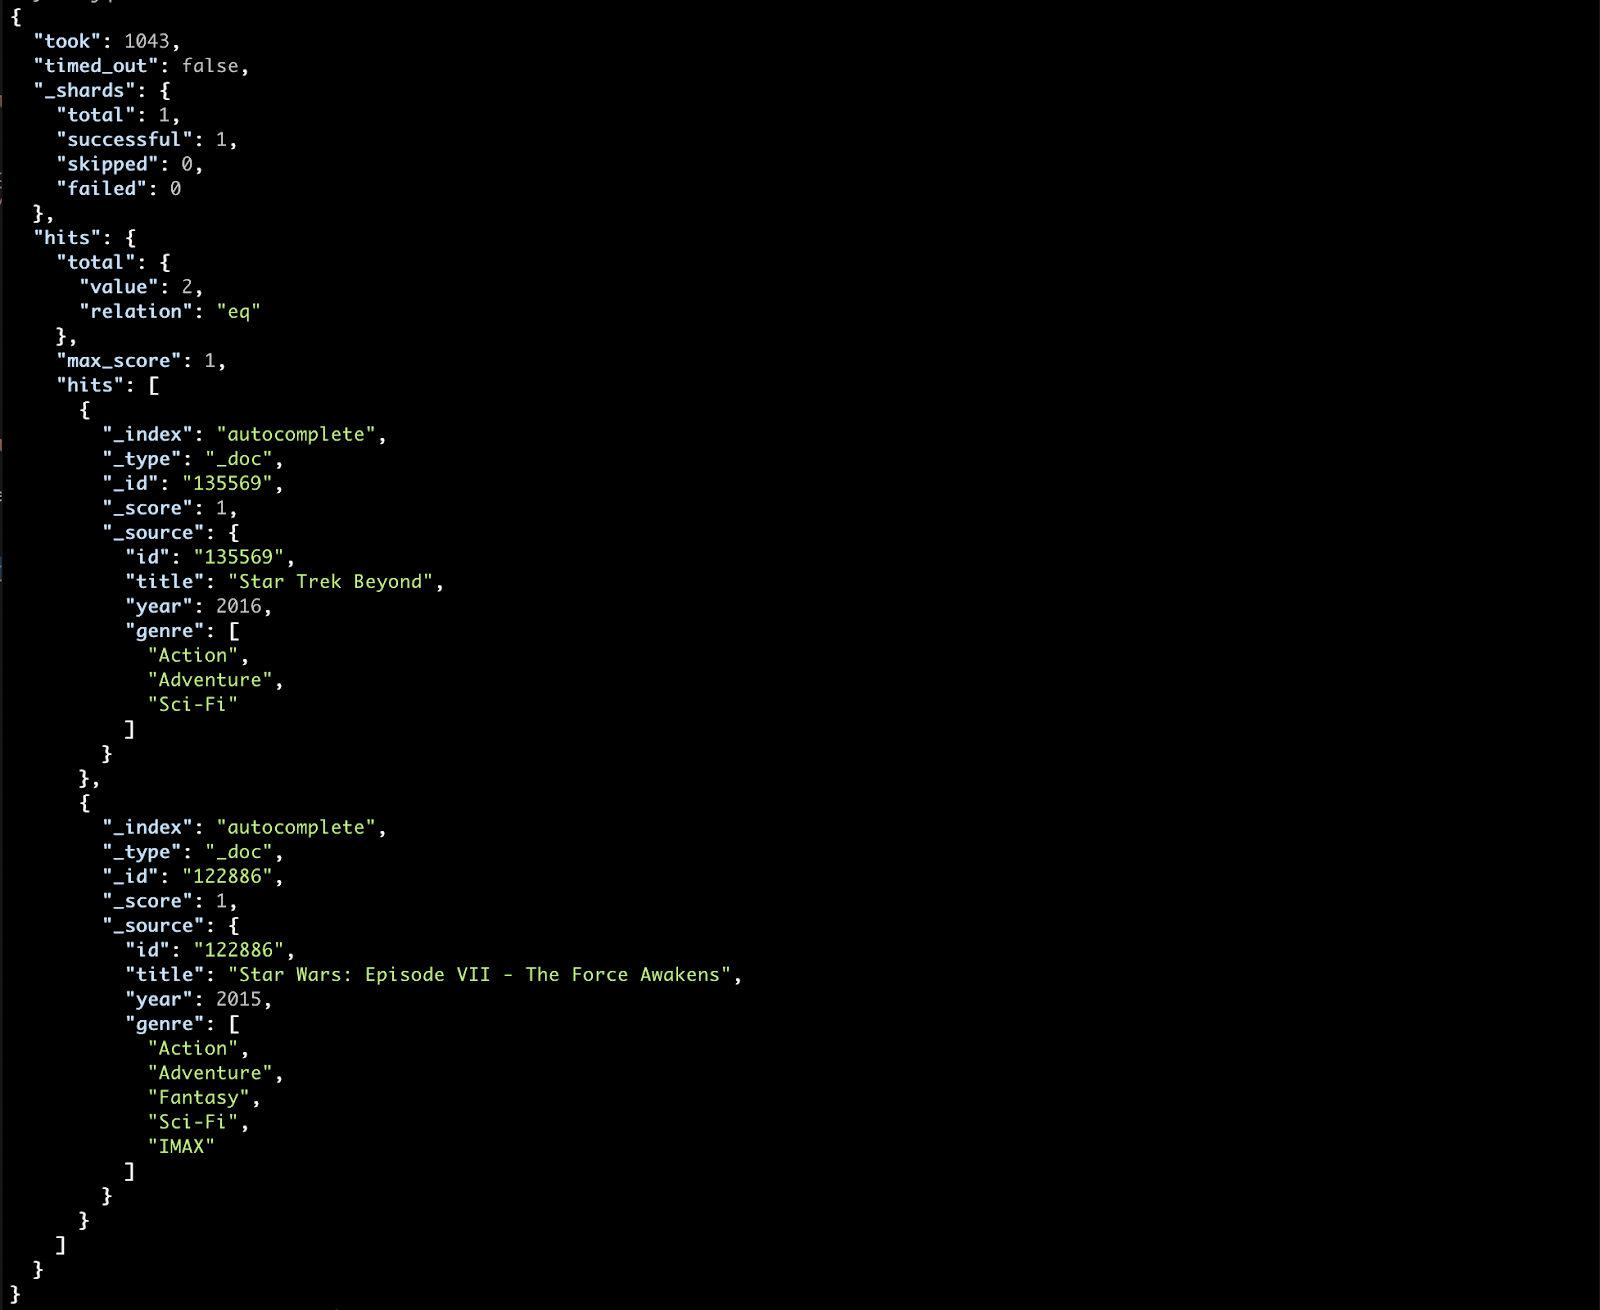
  {
    "@t": "2020-08-05T11:26:14.1913840Z",
    "@m": "Executed endpoint '"DotnetApplication.Api.Controllers.TodoController.Create (DotnetApplication.Api)"'",
    "@i": "99874f2b",
    "EndpointName": "DotnetApplication.Api.Controllers.TodoController.Create (DotnetApplication.Api)",
    "EventId": {
      "Id": 1,
      "Name": "ExecutedEndpoint"
    },
    "SourceContext": "Microsoft.AspNetCore.Routing.EndpointMiddleware",
    "RequestId": "0HM1P5NB98QKE:00000001",
    "RequestPath": "/api/todo",
    "SpanId": "|409deee3-42069a9a6ad1857f.",
    "TraceId": "409deee3-42069a9a6ad1857f",
    "ParentId": ""
  }

This is an example of the information logged when the endpoint to create a new To-Do item is hit. You will be able to see from each log entry that it is only metadata that is logged. While this may be useful, there may be scenarios where we want to log the actual body of the request. So, let us create a middleware component to do this.

Create a new file called HttpRequestBodyMiddleware.cs at the root of the project and enter the following code.

  using Microsoft.AspNetCore.Http;
  using Microsoft.Extensions.Logging;
  using System.IO;
  using System.Text;
  using System.Threading.Tasks;
 
  namespace DotnetApplication.Api
  {
      public class HttpRequestBodyMiddleware
      {
          private readonly ILogger logger;
          private readonly RequestDelegate next;
 
          public HttpRequestBodyMiddleware(ILogger<HttpRequestBodyMiddleware> logger,
              RequestDelegate next)
          {
              this.logger = logger;
              this.next = next;
          }
 
          public async Task Invoke(HttpContext context)
          {
              context.Request.EnableBuffering();
 
              var reader = new StreamReader(context.Request.Body);
 
              string body = await reader.ReadToEndAsync();
              logger.LogInformation(
                  $"Request {context.Request?.Method}: {context.Request?.Path.Value}n{body}");
 
              context.Request.Body.Position = 0L;
            
              await next(context);
          }
      }
  }

Register the middleware component as you did before: in the Startup.cs class. It does not matter where in the chain it is registered, but I have added it at the start of the chain here.

  public void Configure(IApplicationBuilder app, IWebHostEnvironment env)
  {
      app.UseMiddleware<HttpRequestBodyMiddleware>();
 
      if (env.IsDevelopment())
      {
          app.UseDeveloperExceptionPage();
      }
 
      app.UseMiddleware<UnhandledExceptionMiddleware>();
 
      app.UseHttpsRedirection();
      app.UseRouting();
      app.UseAuthorization();
 
      app.UseEndpoints(endpoints =>
      {
          endpoints.MapControllers();
      });
  }

Restart the application and hit the Create endpoint and check that the request body has been logged to the console and the Serilog JSON file.

  info: DotnetApplication.Api.HttpRequestBodyMiddleware[0]
        Request PUT: /api/todo
        { "name": "TODO1", "description": "Something 1" }

Now that we are logging HTTP requests and exceptions, we can remove some of the log messages from the controller actions. You may find that you still require some, but that will normally be for specific purposes and should be used sparingly and only where the information cannot be logged elsewhere.

More advanced concepts

Beyond what we have already discussed, there are other, more advanced techniques that could be used to further reduce noise in your code. Both techniques that I am going to mention are large enough to call for full articles themselves, so I am only going to give a high-level overview of what they are and how they can help to reduce noise.

Going further with Coralogix

Coralogix offers some of the most sophisticated log analytics on the market. We use machine-learning powered techniques to identify previously unknown anomalies in logging data. This allows you to zoom in on your problems efficiently, and get back to your product, knowing that your .NET logging is in safe hands.

Aspect-Oriented Programming

One more advanced concept that is worth mentioning is that of Aspect-Oriented Programming or AOP. This is a concept that aims to apply more behavior to units of software without changing the code itself. It achieves this sometimes by wrapping calls to code in proxy implementations, or other times by adding attributes to methods and classes for use in intercepting calls to them. This is a perfect candidate for abstracting non-business logic code, such as logging, from your methods; allowing the code to hold just the business logic whilst not losing the benefits of logging.

To give a brief example of using an AOP in C#, here is a method with a logging attribute applied that captures the call to the method.

  [LogMethod]
  public int Add(int x, int y)
  {
      int result = x + y;
      return result;
  }

In this case, the LogMethod attribute could capture any or all the following details:

  • When the method was called and by what code
  • When the method returned
  • The value of any parameters passed to the method
  • Any value returned by the method
  • How long it took for the method to complete

This supplies valuable information without adding more noise to the code. One such example library that delivers this approach is the AspectCore library. You can read more about using it for creating a logging attribute here.

Sidecar process

A Sidecar is a different kind of pattern that is more attributed to architectural or infrastructure designs. The concept of a Sidecar is to have a separate process running alongside your application. In the case of a service that offers some form of request/response model, such as an HTTP web service, the Sidecar can act as a proxy for those requests. By this, I mean that any requests sent to the service would be sent to the Sidecar proxy. This would in turn forward the requests onto the actual service and redirect the response back to the caller.

The benefit of using this pattern is that it would allow you to add custom logging code inside the proxy; therefore, allowing you to capture valuable information about the requests and responses, without adding more code to the business logic. This is especially helpful in a system where the service already exists and potentially cannot be modified.

High-performance logging

Up until now, we have used the logging framework provided by .NET Core 3.1. You may have noticed that all the calls to the logger have been synchronous. This is by design by Microsoft – they deliberately do not support asynchronous logging as they recommend logging to be quick. However, just because asynchronous logging is not supported, this does not mean there are not any performance gains that can be achieved. The following tips hope to give some information about potential tweaks that can be applied to support a high volume of logs being output.

Log Level

It is not always necessary to log every Debug and Information log message in every environment. As such, consider lowering the log level in more performance-critical environments, such as Production. Reducing the log level as far as Warning or Error will help to reduce the number of messages that are output to the log locations configured for the application.

Debug and Console Logging

Again, it is not always necessary to use all log providers configured for use by the application under all environments. Specifically, the Debug and Console log providers may not be needed in environments beyond local development. Removing these log providers (that are automatically included in all environments by the default ASP.NET Core configuration) may help to reduce the number of messages being output and therefore help to boost performance.

A performance degradation was investigated and written about by Rick Strahl, though this was specifically running on a Windows platform using ASP.NET Core 2.2. Be careful though, as you do not want to remove a log provider that you do need. For example, under containerized environments, the console output is often collected by the host for use elsewhere (I.e. Docker, AWS CloudWatch, etc).

High Performance .NET Logging

It is understood that logging to external sources such as a database, a web service, or even a file, can increase the overhead of writing out messages due to network latency and I/O bottlenecks. Since logging should be a quick process, it is recommended to try to avoid logging to these sources where possible.

However, there are some acceptable approaches to using these sources where they are needed.

Use an In-Memory Buffer/Queue

When you do need to write log messages to slower sources, consider using a fast-access intermediary to cache the messages before a background process handles the actual load of writing these messages to the required sources. This could be as simple as writing the log messages to a ConcurrentQueue, which is thread-safe, and running a background worker process, which will read from the queue.

However, this approach comes with its own potential issues. Where you may benefit from better performance under high load, you face the possibility of losing some of your log messages if the application were to crash or be stopped/restarted. Any messages still stored in memory at the time the application stops will be lost.

There are other providers that handle this type of background logging. We have already looked at Serilog for our JSON file log provider. Serilog also supplies an asynchronous sink, which extends its usage to make use of a background process to write logs asynchronously. This package does handle the instance where the application is stopped, but cannot guarantee that 100% of the messages will be logged in the case that the application crashes.

Sidecar Process

Another potential way to handle writing to less performant sources would be a Sidecar process. In this scenario, the application could write log messages to a file, and a sidecar process would then be tailing this file and writing all new messages to the desired location. This adds some added complexity with having a separate process running alongside your application, but maybe a sufficient approach under certain systems.

As we can see, there are several approaches or techniques that could be applied to improve the performance of your application while writing logs. There is no one-size-fits-all solution here as it will depend on your exact setup and requirements.

LoggerMessage

If your application has a lot of log messages being written and becomes under high load, then you may experience performance issues still, even after applying the above techniques. One other area to consider is the LoggerMessage pattern recommended in the Microsoft documentation for these scenarios.

You can read more about this concept and explore some examples here. At a high level, the default logging approach that we have looked at boxes values and evaluates log message format strings on every output. These approaches, when under high load, can seriously impact performance. The LoggerMessage pattern aims to solve these issues by configuring a strongly-typed, static message that can be used instead of the default logging approach.

Coralogix and Performance

Coralogix is designed to process huge volumes of logs. Performance is a concern that can distract you from the real goal – your product. Allow us to make logging an easy, scalable part of your infrastructure.

Valuable logs

The whole purpose of creating logs from our applications is to supply value when we need to analyze problems. We have already seen how we can add value just by logging messages that describe what the code is doing or capturing exceptions or HTTP requests and responses through the middleware. But what if we want to log some information specific to our business logic, but include the context of the HTTP request that triggered the call to that business logic.

One approach would be to pass down the current HttpContext instance from the controller action that has been called, right through to the business logic in question. However, this would mean coupling the business logic to the concept of the HTTP Context, when that logic could live in a separate library that might be consumed by other non-HTTP-related code. When used by code in the other areas, there may be something else that triggers that call that we should log instead.

We can achieve this in .NET Core 3.1 by extending the logging framework to supply our own provider that we will inject into our business logic (or any other) code as part of the HTTP request. This custom log provider will have a dependency on the IHttpContextAccessor provided by the framework, which will allow us to access the current HttpContext to extract the information we want for our log message.

Let us look at how we would set this up. First, we need to find some code that is outside of our controller methods – the TodoItemStore is a perfect example! Make use of the logger in this method so that we have it setup. Add the following code.

  private readonly List<TodoItem> todoList = new List<TodoItem>();
  private readonly ILogger logger;

  public TodoItemStore(ILogger<TodoItemStore> logger)
  {
      this.logger = logger;
  }

// …

  public void AddItem(TodoItem item)
  {
      item.Id = GetNextId();

      logger.LogInformation($"Item {item.Id}: {item.Name} added to store");

      todoList.Add(item);
  }

// …


When our application is run and we add a new item, we will now see the following log message.

  ...
  info: DotnetApplication.Api.TodoItemStore[0]
        Item 1: TODO1 added to store
  ...

Now we need to create our own logger and provider. Create two files in the root of the project directory called MyLogger.cs and MyLoggerProvider.cs, and enter the following code.

MyLogger.cs

  using System;
  using Microsoft.Extensions.Logging;
 
  namespace DotnetApplication
  {
      public class MyLogger : ILogger
      {
          public IDisposable BeginScope<TState>(TState state) => null;
          public bool IsEnabled(LogLevel logLevel) => true;

          public void Log<TState>(LogLevel logLevel, EventId eventId, TState state, Exception exception, Func<TState, Exception, string> formatter)
          {
              Console.ForegroundColor = ConsoleColor.Green;
              Console.Write($"{logLevel}: ");
              Console.ResetColor();

              Console.Write(formatter(state, exception));
              Console.WriteLine();
          }
      }
  }

MyLoggerProvider.cs

  using System.Collections.Generic;
  using Microsoft.Extensions.Logging;

  namespace DotnetApplication
  {
      public class MyLoggerProvider : ILoggerProvider
      {
          private readonly List<ILogger> loggers = new List<ILogger>();

          public ILogger CreateLogger(string categoryName)
          {
              var logger = new MyLogger();
              loggers.Add(logger);

              return logger;
          }

          public void Dispose() => loggers.Clear();
      }
  }

Now we have our custom logger and provider setup, we can change the logging configuration for our application to include this new provider. Change the Program.cs file to remove all existing providers and use only our custom provider. Removing the other providers will just make it easier to see our changes.

  ...
  .ConfigureLogging((_, builder) =>
  {
      builder.ClearProviders();
      builder.AddProvider(new MyLoggerProvider());
  })
  ...

Now run the application again, add a new to-do item and check the output in the console. You should see something like this:

  Information: Now listening on: https://localhost:5001
  Information: Now listening on: https://localhost:5000
  Information: Application started. Press Ctrl+C to shut down.
  Information: Hosting environment: Development
  ...
  Information: Item 1: TODO1 added to store

Great! We are now using a custom logger. But we are still missing something – information relating to the HTTP request that triggered this call. Let us update our logger to include an injected service: the IHttpContextAccessor.

  using System;
  using Microsoft.AspNetCore.Http;
  using Microsoft.Extensions.Logging;

  namespace DotnetApplication
  {
      public class MyLogger : ILogger
      {
          private readonly IHttpContextAccessor httpContextAccessor;

          public MyLogger(IHttpContextAccessor httpContextAccessor)
          {
              this.httpContextAccessor = httpContextAccessor;
          }

          // ...
      }
  }

Before we start changing our log output, we need to make sure this service can be injected. Update the provider to pass this dependency to our logger.

  using System;
  using System.Collections.Generic;
  using Microsoft.AspNetCore.Http;
  using Microsoft.Extensions.DependencyInjection;
  using Microsoft.Extensions.Logging;

  namespace DotnetApplication
  {
      public class MyLoggerProvider : ILoggerProvider
      {
          private readonly IServiceProvider serviceProvider;
          private readonly List<ILogger> loggers = new List<ILogger>();

          public MyLoggerProvider(IServiceProvider serviceProvider)
          {
              this.serviceProvider = serviceProvider;
          }

          public ILogger CreateLogger(string categoryName)
          {
              var accessor = serviceProvider.GetService<IHttpContextAccessor>();
              var logger = new MyLogger(accessor);

              loggers.Add(logger);

              return logger;
          }

          public void Dispose() => loggers.Clear();
      }
  }

We also need to make sure the accessor is available for injection, so update the Startup.cs file with the following change.

  public void ConfigureServices(IServiceCollection services)
  {
      services.AddHttpContextAccessor();

      services.AddSingleton<TodoItemStore>();

      services.AddControllers();
  }

Since we are now trying to access the services configured for injection within the application, we need to move our logger provider configuration to the Startup.cs file so that it can access the HTTP context accessor instance. So, move the following line from the Program.cs file and into the Startup.cs file.

Program.cs

builder.AddProvider(new MyLoggerProvider());

Startup.cs

public void Configure(IApplicationBuilder app, IWebHostEnvironment env, ILoggerFactory loggerFactory)
  {
      loggerFactory.AddProvider(new MyLoggerProvider(app.ApplicationServices));

      ...
  }

Note that we have also added a third parameter to our Configure method. This is automatically picked up by the framework.

You may also want to remove the custom middleware components that we added so that the console output only has the messages we are interested in now.

Finally, we can now replace our log method with a message that holds a little more value.

  public void Log<TState>(LogLevel logLevel, EventId eventId, TState state, Exception exception, Func<TState, Exception, string> formatter)
  {
      string message = formatter(state, exception);

      var context = httpContextAccessor.HttpContext;
      if (context == null)
      {
          Console.WriteLine($"{logLevel}: {message}");
      }
      else
      {
          Console.WriteLine(new
          {
              Message = message,
              LogLevel = logLevel,
              HttpMethod = context.Request?.Method,
              HttpPath = context.Request?.Path
          });
      }
  }

And that is it! Run the application and you should see something like this:

  Information: Now listening on: https://localhost:5001
  Information: Now listening on: https://localhost:5000
  Information: Application started. Press Ctrl+C to shut down.
  Information: Hosting environment: Development
  ...
  { Message = Item 1: TODO1 added to store, LogLevel = Information, HttpMethod = PUT, HttpPath = /api/todo/ }

This is just one example of the added value that you could add to your log messages to give them the context of what is happening in your application at the time. Instead of logging to the console, you could just as easily output this information to a JSON file to form structured log messages that could then be sent off to a log analysis tool such as the Elastic Stack.

Conclusion

In this article, we have seen that .NET Core 3.1 has been built in such a way to give us a lot of easily configured logging approaches out of the box. It is structured in a modular and extensible way to allow us to add in just the components we need, while also being able to take full advantage over the logging mechanism without being restricted to the log providers inside the new framework. We have also looked at a few concepts that will allow us to keep our logging valuable and performant, without polluting the business logic with too much “noise”.

Five Things to Log in Your CI Pipeline: Continuous Delivery

Logs in continuous delivery pipelines are often entirely ignored, right up until something goes wrong. We usually find ourselves wishing we’d put some thought into our logs, once we’re in the midst of trawling through thousands of lines. In order to try to prevent this, we can add DevOps metrics into our logs, which will provide us with greater CI/CD observability, and give insight into anything going wrong in our pipelines. To help you add in these metrics to improve your CI/CD logs, here are five helpful tips.

1. Application Info

Some simple, yet vital, information to output is basic application metadata. This might include the application name, current version number(s), and any other important app-specific information you think may help out during later debugging. This metadata is important for more than just adding observability, it also provides context to the logs in case you might need to remove them from their original platform.

2. Code Commit Time

It is best to know when any changes were committed to the repository. Git makes this easy for us. Simply fetch the date of the latest commit:

git --no-pager log -1 --format=%cd

We can also add a specific commit hash or tag name to this command. Below, we fetch the latest tag in the repository through a subcommand:

git --no-pager log -1 --format=%cd $(git describe --exact-match --abbrev=0)

This will give us something like Fri Jun 12 12:48:02 2020 +0100, allowing us to work out how long it’s been from code commit or release creation to either the current time or one of the other values we’ll output below.

3. Build Times

Tracking the time from build start to end might not seem like it would be something too useful, especially if your continuous delivery pipeline already tracks total durations; however, this information can be very helpful when you’re troubleshooting a spike in total duration as you can quickly identify which section of your pipeline caused the increase.

You may also choose to be a little more specific and not only log out total build durations, but also durations for each step – this will allow you to identify which steps are causing spikes or the largest delays in your process. The time command on UNIX systems makes this easy.

4. Deploy Times

Deployment can face delays from time to time, and we need to be able to quickly identify any such issue. On top of this, a delay in a CDN deployment may be out of our control. We need to understand when we should and shouldn’t act. Logging each step of a deployment can very quickly alleviate these troubles, and just as with build timings, this can be done trivially with the time command.

5. Inconsistencies

If anything “out of the ordinary” is to happen during build or deploy, we’re going to want to know about it when we scan through our deployment logs. To make sure of this, when planning our CI/CD steps, we want to be careful not to accidentally hide warnings or errors outputted by any of our commands, and we want to make sure these are all directly outputted or redirected somewhere so that we can output them later on.

One good example of inconsistency might be a build whose duration deviates too far from the average. This can be a clear sign of something going wrong. Otherwise, inconsistencies may be things such as warnings from a compiler or linter that won’t stop the build. We should observe them to make sure they’re resolved at some point. Coralogix supports this feature out of the box, using our error anomaly and flow anomaly detection.

Your Continuous Delivery Pipeline is Crucial

Your pipeline is a constant font of new and important information. Each new release is a potential market-changing innovation, or a reputation tarring outage. These insights will give you a far better understanding of which change is which.

The Top Elasticsearch Problems You Need to Know

The ELK stack is an industry-recognized solution for centralizing logging, analyzing logs, and monitoring your system use and output. However, the challenges of maintaining your own stack overcoming common Elasticsearch problems need to be considered. 

The popularity of the ELK Stack can be boiled down to two, key tenets. First, the management and analysis of logs is an incessant issue for developers, SMBs, and enterprises alike. With the addition of ever more distributed environments into modern IT infrastructure, businesses and developers turn to ELK to make sense of the chaos. 

Second, by using open source technology like ELK, organizations don’t need to worry about new technologists not being familiar with a niche tool or software. This makes onboarding and upskilling that much easier – there’s a level of presumed knowledge for developers to hold on various open source technologies. On top of that, the open-source community offers so much guidance, it’s a bit like having a dedicated support team just for your monitoring. ELK’s data visualization gives developers and organizations the ability to succinctly analyze outputs, empowering real infrastructure change. Since the addition of Beats into the Elastic Stack a couple of years ago, ELK’s ability to collect data outputs has been further amplified making it the ubiquitous tool that it is today.

Upgrades

As an ELK stack is made up of four, powerful constituent parts constantly under development and improvement, upgrades are one of the biggest issues you have to consider if choosing to deploy on your own. Upgrading Elasticsearch can be a torturous and slow process – you must upgrade the cluster one node at a time, whilst being particularly mindful of data replication to mitigate against data loss. If, as is often the case, a major version upgrade is needed, then the whole cluster has to be restarted, which brings with it risks of downtime and data loss. Organizations that choose not to outsource the management of their ELK stack deployments often end up with huge, out-of-date instances that become buggy and vulnerable.

On top of that, any upgrades to Kibana often come hand-in-hand with the loss of connectivity, and sometimes the functionality of visualizations needs to be started from scratch. Lastly, because of the interconnectivity of Elastic Stack, upgrades of the constituent tools need to be consistent across the board. For example, the most recent upgrade to Elasticsearch renders indices created by Beats versions 6.6 and earlier incompatible with Kibana, until each relevant index has a fix applied. All these Elasticsearch problems cause major headaches at any organization, which is why outsourcing the management of an ELK stack deployment is an obvious solution.

Security

Security should be at the forefront of anyone’s mind, business, and developer alike when deploying a tool or technology – ELK stack is no exception. The logs processed by Elastic Stack are often of a sensitive or business-critical nature and is why businesses are keen to outsource the managing of their ELK stacks. Not managing the security patching around nodes effectively will have dire consequences for your business internally, and with the potential for long-lasting reputational damage. Vulnerabilities in your application code leading to consumer data being included in logs, as happened with Twitter in 2018, Vision Direct in 2018, and Capital One in 2019. Whilst this may be a rare and unfortunate occurrence that can be mitigated by having an ELK stack expert managing the encryption of your logs going into ELK. 

There have also been some major security vulnerabilities with Elasticsearch in the past (which have since been resolved). As an example, at the time of writing this post, there were 41 outstanding vulnerabilities with Elasticsearch (again, these have since been patched). This alone is a huge consideration, particularly with ELK’s frequent use in SIEM and compliance. If you want the additional assurances of features such as SAML 2.0 SSO, encrypting data at rest, rotated SSL certificates (to name but a few) external expertise from a managed service can offer untold assurances.

Performance

Optimizing your ELK stack for your environment is a surefire way of getting the most out of it, particularly in regard to the time and money you will have most likely already invested. You also have to consider the fine-tuning of the underlying infrastructure that it sits on. The need for ELK stack performance optimization only increases as your infrastructure grows, log volume grows, reducing the effectiveness of your Elasticsearch clusters. The heavy lifting associated with this tuning is not lacking: assigning the optimal memory resource for Elasticsearch, removing unused indices, expertly tuning shard size and shard recovery for failover are just some of the considerations that should be top of mind. 

Naturally, the payoffs of running a fully optimized ELK stack are equally as numerous as the tasks that go into ensuring its success. A heterogeneous tool, ELK requires frequent attention and adjustments to run at its best, which presents a conundrum for its users. If you ELK stack runs in support of your product or services, instead of being product-critical or contributory, is the time needed to optimize its performance the best use of your developers’ valuable hours?

Capability

Today, ELK stands head and shoulders above its competitors. However, as with any tool, success is not guaranteed. Where Beats and Logstash carry out the aggregation and processing of data, Elasticsearch indexes data and Kibana is the user-facing layer for querying and visualization, a successful ELK cluster is only as strong as its constituent parts. With a four-part tool that requires frequent updates, performance tuning and has significant security considerations, you should be certain as to whether you have the time, resources, and knowledge to maintain your own ELK to have it firing on all cylinders.

A fully optimized, secure, and up-to-date ELK stack is a fantastic tool to have in your overall infrastructure – the benefits of which have been extolled throughout this post. Getting to that stage is no mean feat, nor is the ongoing task of ensuring that your ELK and its underlying infrastructure remain at peak performance. Conversely, your resources and time may be best directed at product development, scaling your services, or improving your offering in other departments. If so, then having a third party solution like Coralogix manage your ELK stack may just be the way to have your cake and eat it too.

Application Logs: 8 Goals and Best Practices to Aim For

Running a successful company relies on current and accurate information about the underlying systems. Much of this information is contained within your application logs. By investing in your log monitoring solution, you can unlock these crucial insights and access a wealth of powerful data.  This post presents a series of goals that will allow you to make the best possible use of your application logs.

Definition: Logging is an activity in almost all present-day applications, be it web, desktop, mobile apps, or services. Application logs capture timestamped data, comprising of decisions taken, actions initiated, runtime characteristics, or error states.

Intrinsic application log data

  • Application settings
  • Inputs and outputs of applications
  • Roles/permissions used to carry out actions
  • Failures encountered during execution
  • Resources consumed by actions (e.g., CPU time, storage, compute instances)
  • Performance traits of applications (e.g., service response time)

Extrinsic application log data

  • Application’s execution environment (e.g., details about the underlying hardware, versions of required components)
  • Execution context (e.g., type of clients, request load, user and transaction IDs, etc)

Such log data is rich with information that can enable and support management, engineering, and operational tasks at all levels of an organization. It can be difficult to work out where to begin. Below are several goals to target when looking for how to measure the maturity and success of your logging solution.

Logging Multiple Services

When applications are composed of multiple services, service logs capture data that is similar to the data captured in application logs but specific to services. Also, the logs will typically capture auxiliary yet essential data (e.g., request-id) that, along with timestamps, can help collate the actions performed by different services in the context of a specific action performed by an application.

Goal 1: Ensure an application honors its service level agreement (SLA)

Almost all paid services are accompanied by service-level agreements (SLAs) that codify the quality of service offered to customers. Service providers ensure that they honor SLAs by tracking if their services are fulfilling service level objectives (SLOs) derived from SLAs and defined in terms of service-level indicators (SLIs). Almost always, SLIs stem from the data about services/applications that are either logged by services/applications or captured and logged by the infrastructure running/supporting the services/applications. For example, the service latency can be derived from the arrival time of a request and the departure time of the corresponding response, which can be easily captured and logged by the infrastructure running/supporting the service.

Since SLAs are closely connected to log data via SLOs and SLIs, analyzing log data can be a great means of keeping tabs on the quality of the offered service and ensuring the promised quality is indeed provided.

Goal 2: Ensure and prove an application complies with rules and regulations

Modern applications deal with external data in some form, be it storing user data in the cloud (e.g., email services) or using locally stored data in conjunction with remote services (e.g., smart IDEs). Consequently, such applications need to prove compliance with rules and regulations governing the handling of external data. This goal is accomplished via audits of how an application, directly and indirectly, handles external data. Often, many bits of the data used in such audits are captured in logs that are related to the actions taken by an application (e.g., details about data access performed by an application) or in the context of an application (e.g., changes to a security group related to an application).

As logs capture data relevant to audits used to prove compliance, analyzing log data of an application is a great way to assess current practices used in the application and make changes to ensure the application is compliant.

Goal 3: Create a ‘sketch’ of the operating characteristics of an application

As applications evolve, we need reference characteristics of the application to make assessments and take evolution and maintenance related decisions. For this purpose, an application’s target characteristics after the last change seem like a good reference. However, current operating characteristics may differ from desired characteristics due to a myriad of factors. For example, the latency of a service could have increased with the number of service users. In contrast, the same latency could have decreased because we migrated the service to a more powerful hardware platform.

Logs form an outstanding baseline for your application behaviour, but it can be difficult to derive patterns from such vast information. Coralogix provides machine learning based tooling to do this for you. Assuming application logs capture relevant data, we can analyze the logs and sketch the operating characteristics of an application.

Goal 4: Assess an application’s health using application logs

Unlike desired characteristics of an application determined at design time, the operating characteristics of an application are fluid as a running application is exposed to its clients, service providers, and environment. Consequently, the health of an application is more prone to deterioration due to various factors such as increased client requests, failing internal components, and hardware malfunctions.

In most applications, data about such health-related factors are directly or indirectly captured in logs. So, by analyzing the logs, we can get a glimpse of the current health of the application by comparing its current operating characteristic with a recent past operating characteristic deemed as healthy, e.g., using features like Ratio Alerts in Coralogix. Based on this glimpse, we can plan/take corrective and/or preventive action to restore the health of the application (read the following possibilities).

Goal 5: Detect failures due to external attacks and internal errors

Most modern-day applications either expose or rely on web-based service access points. This allows external actors to impact applications via malicious attacks. Often such attacks are characterized by unusual extrinsic behavior, such as increased network traffic and increased data ingress. They also often result in unusual network traffic and data access patterns.

Similar to external attacks, internal errors stemming from coding faults (e.g., incorrect units) or deployment time issues (e.g., incorrect configuration) can also cause application failures that result in unusual intrinsic behaviors such as increased request failures. These failures can also result in unusual network traffic and data access patterns.

Many applications and their deployments log data about network traffic, data ingress/egress and access, and the computational load generated by applications. So, we can employ techniques such as pattern mining and outlier analysis to analyze logs and identify unusual behavior and patterns. Equipped with such patterns, we can monitor the application logs for anomalies and take corrective action to prevent or mitigate failures, e.g., using simple rule-based features such as Automatic Threat Discovery or learning-based features such as Flow Anomaly Detection in Coralogix.

Goal 6: Proactively maintain and evolve an application 

Once an application is published, how the application is used (e.g., number of users, frequency of use of features) can affect its operating characteristics. Such effects can trigger maintenance changes, e.g., fixing bugs in existing features, addressing performance/scaling issues, and improving availability.This can also trigger feature evolution, e.g., improve UX of existing features, add new features.

While such changes can be driven by user feedback, they can also be implemented proactively by continuously monitoring the operating characteristics of an application and its environment. This allows you to identify improvement opportunities and plan to implement the changes before the users are affected by the absence of these changes.

Goal 7: Assess the effectiveness of changes to an application

As customer needs evolve and improvement opportunities are discovered, applications are modified and new versions are released/deployed.  While such modifications are well-intentioned, they could turn out to be ineffective. Further, when alternative solutions are available to address an issue, measuring the effectiveness of alternative solutions (usually realized as different versions) after deployment is crucial to validate decisions.

In such situations, we can collect data that is necessary to measure the effectiveness of different versions, e.g., using the Tags feature in Coralogix.  Alternatively, if we can identify the expected effects of the changes on the data that is currently logged by and about the application, then analysis of such log data can easily help us assess the effectiveness of different versions.

Goal 8: Detect second-order effects of features of and changes to an application

While most changes to applications are intended to serve its users, they could have unintended detrimental effects. For example, a feature could ease the burden of authentication but, when combined with certain other features or processes, can open a security vulnerability. In such cases, analyzing application logs can help uncover such second-order effects and allow us to respond instantly, with a full picture of the issue, using features such as New Error and Critical Log Detection in Coralogix.

Often application logs are rich with information about the behavior of their applications. Analyzing these logs can tell us a lot about the applications, their environments, and their clients. This information can help improve applications and provide better service to users. So, failing to analyze logs is failing to use a precious resource!

Elasticsearch Update Index Settings

You’ve created the perfect design for your indices and they are happily churning along. However, in the future, you may need to reconsider your initial design and update the Elasticsearch index settings. This might be to improve performance, change sharding settings, adjust for growth and manage ELK costs. Whatever the reason, Elasticsearch is flexible and allows you to change index settings. Let’s learn how to do that!

During the lifecycle of an index, it will likely change to serve various data processing needs, like:

  • High ingest loads
  • Query volumes of varying intensity
  • Reporting and aggregation requirements
  • Changing data retention and data removal

Generally speaking, changes that can be performed on an index can be classified into these four types:

  • Index Settings
  • Sharding
  • Primary Data
  • Low-Level Changes to the index’s inner structure such as the number of segments, freezing, which we won’t cover for the purposes of this lesson. However, If you’d like to read more about advanced index design concepts, hop over to this blog post.

Index Settings

Elasticsearch index has various settings that are either explicitly or implicitly defined when creating an index.

There are two types of settings:

  • Dynamic Settings that can be changed after index creation
  • Static Settings that cannot be changed after index creation

Dynamic Settings can be changed after the index is created and are essentially configurations that don’t impact the internal index data directly. For example:

  • number_of_replicas: the number of copies the index has
  • refresh_interval when the ingested data is made available for queries
  • blocks disabling readability/writability of the index
  • _pipeline selecting a preprocessing pipeline applied to all documents

We can update dynamic settings with:

PUT requests to the /{index}/_settings endpoint.

Static Settings on the other hand, are settings that cannot be changed after index creation. These settings affect the actual structures that compose the index. For example:

  • number_of_shards the primary shards
  • codec defining the compression scheme of the data

Sharding

Shards are the basic building blocks of Elasticsearch’s distributed nature. It allows us to more easily scale up a cluster and achieve higher availability and resiliency of data.

High Availability
When we say that something has high availability, it means that we can expect the service to work, uninterrupted, for a very long time. By spreading services and data across multiple nodes, we make our infrastructure able to withstand occasional node failures, while still continuing to operate normally (service doesn’t go down, so it’s still “available”).

High Resiliency
Resiliency is achieved by means such as having enough copies of data around so that even if something fails, the healthy copies prevent data loss. Or, otherwise said, the infrastructure “resists” certain errors and can even recover from them.

How Sharding Works

Imagine having an index with multiple shards. Even if one of the shards should go down for some reason, the other shards can keep the index operating and also complete the requests of the lost shard. This is equivalent to high availability and resiliency.

Furthermore, if we need to achieve higher speeds, we can add more shards. By distributing the work to multiple shards, besides completing tasks faster, the shards also have less individual work to do, resulting in less pressure on each of them. This is equivalent to “scaling up,” work is done in parallel, faster, and there’s less pressure on each individual server.

Elasticsearch Cluster

Changing Number of Shards

As mentioned, the number of primary shards is a Static Setting and therefore cannot be changed on the fly, since it would impact the structure of the master data. However, in contrast to primary shards, the number of replica shards can be changed after the index is created since it doesn’t affect the master data.

If you want to change the number of primary shards you either need to manually create a new index and reindex all your data (along with using aliases and read-only indices) or you can use helper APIs to achieve this faster:

  1. POST /{source-index}/_shrink/{target-index-name} to lower the number
  2. POST /{source-index}/_split/{target-index-name} to multiply the number

Both actions require a new target index name as input.

Splitting Shards


If we need to increase the number of shards, for example, to spread the load across more nodes, we can use the  _split API. However, this shouldn’t be confused with simply adding more shards. Instead, we should look at it as multiplication.

The limitation to bear in mind is that we can only split the original primary shard into two or more primary shards, so you couldn’t just increase it by +1. Let’s go through a few examples to clarify:

  • If we start with 2, and multiple by a factor of 2, that would split the original 2 shards into 4
  • Alternatively, if we start with 2 shards and split them down to 6, that would be a factor of 3
  • On the other hand, if we started with one shard, we could multiply that by any number we wanted
  • We could not, however, split 2 shards into 3.

Shrinking Shards

The /_shrink API does the opposite of what the _split API does; it reduces the number of shards. While splitting shards works by multiplying the original shard, the  /_shrink API works by dividing the shard to reduce the number of shards. That means that you can’t just “subtract shards,” but rather, you have to divide them.

For example, an index with 8 primary shards can be shrunk to 4, 2 or 1. One with 15, can be brought down to 5, 3 or 1.

Primary Data

Primary Elasticsearch Index Data
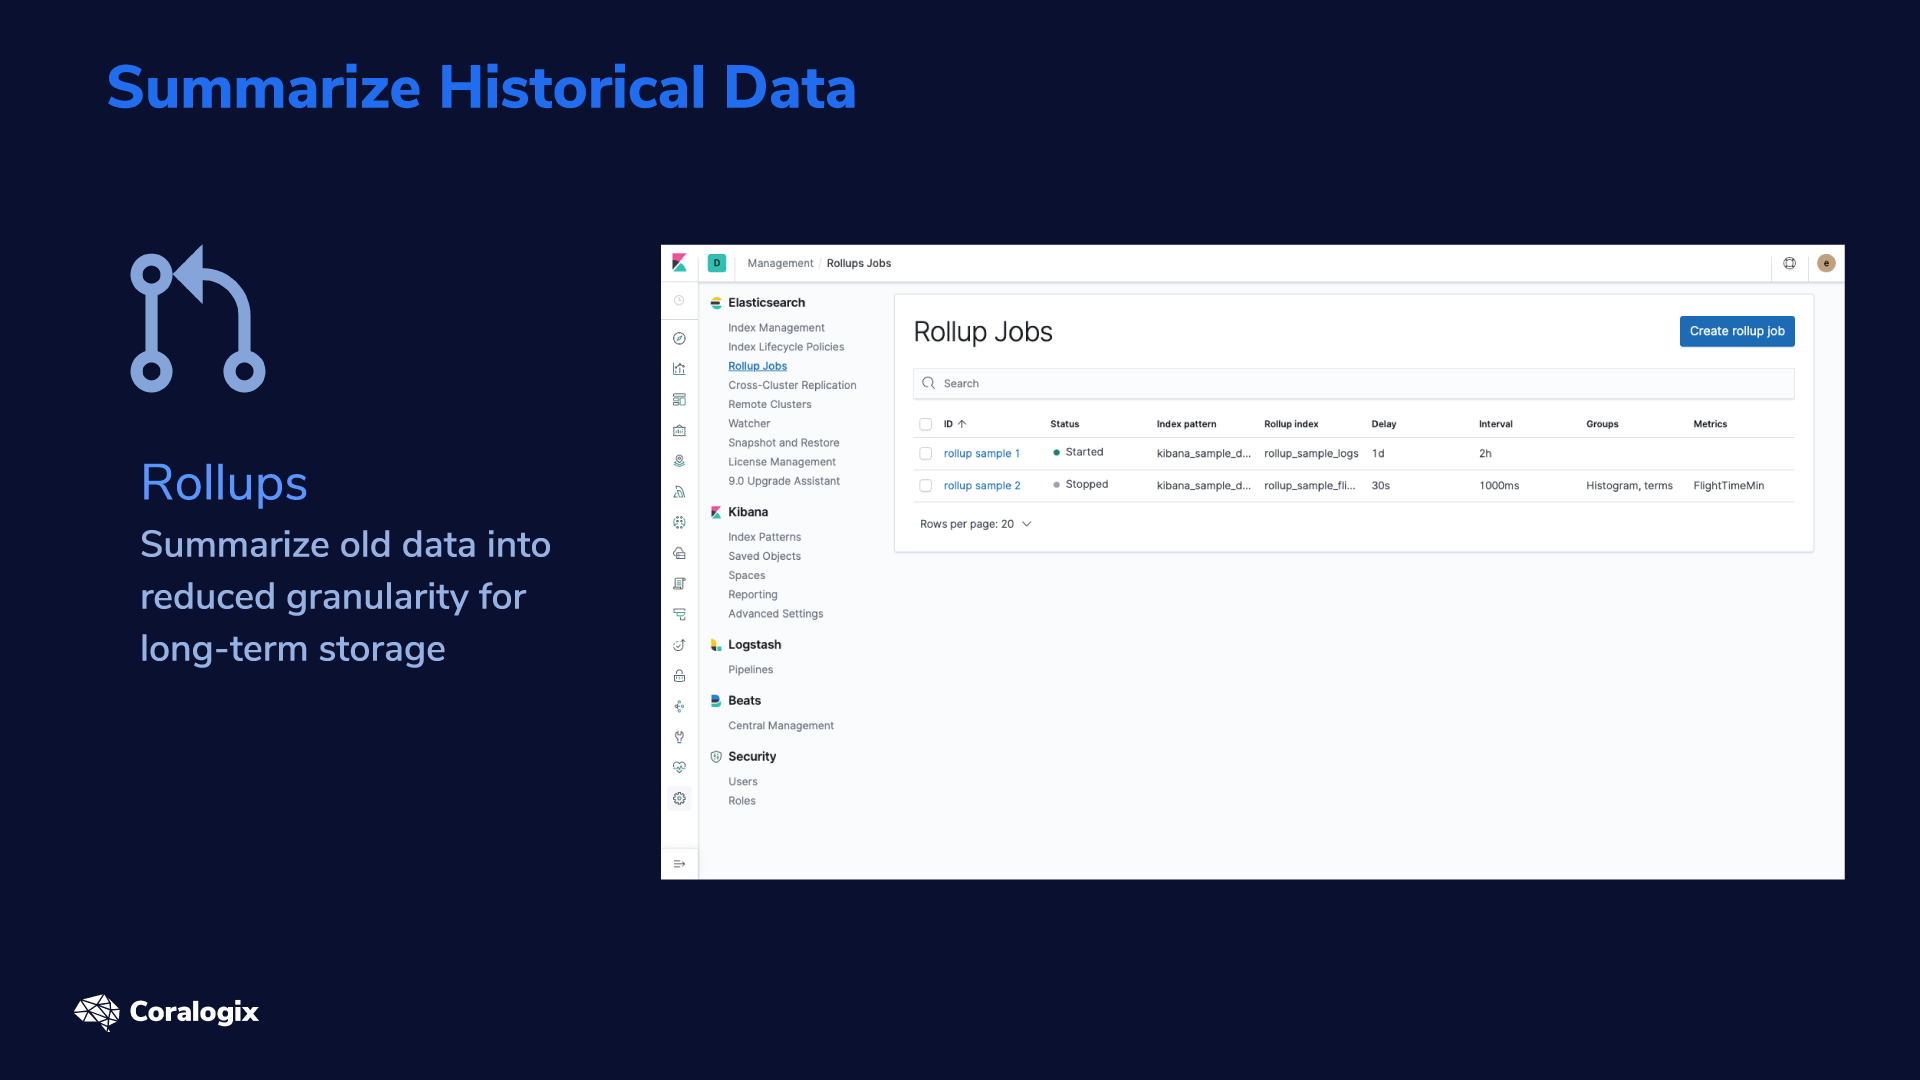
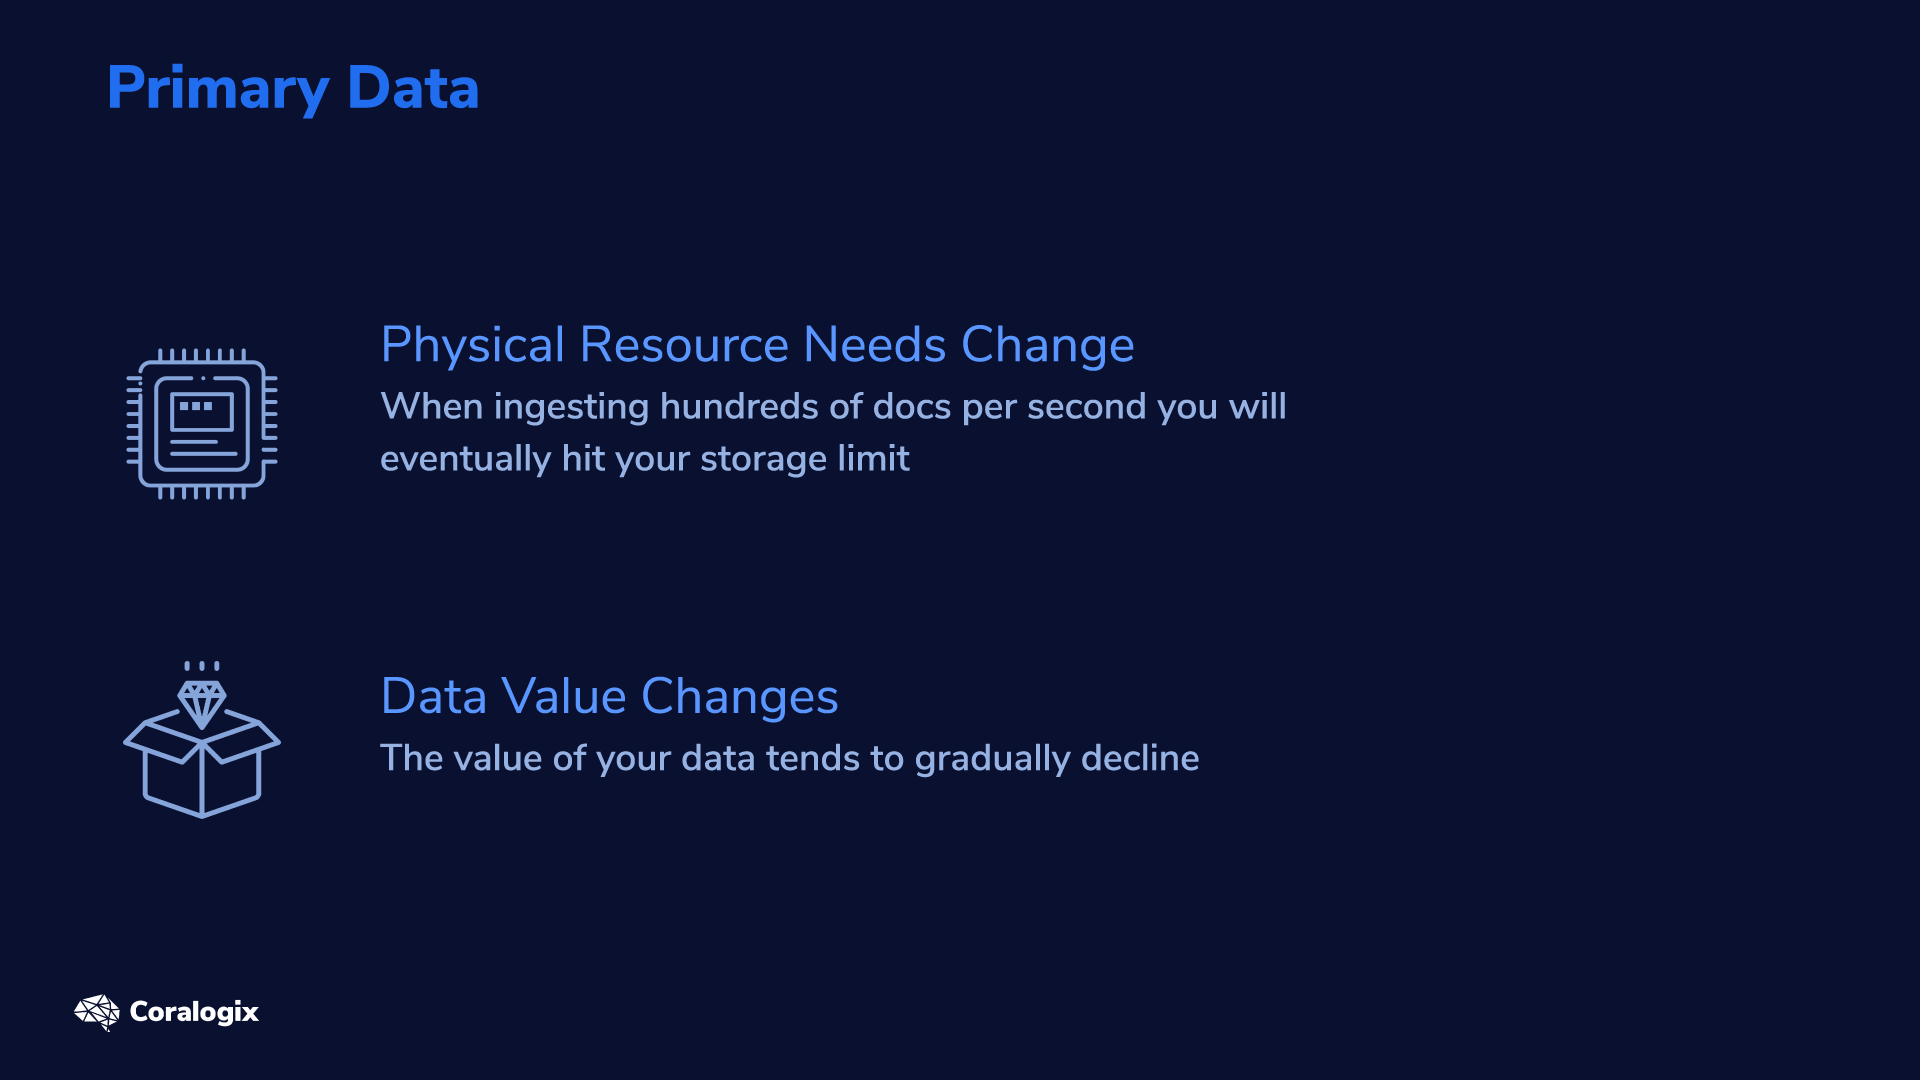
When you change your primary index data there aren’t many ways to reconstruct it. Now, you may be thinking, “why change the primary data at all?”

There are two potential causes for changing the primary data:

  • Physical resource needs change
  • The value of your data changes

Resource limitations are obvious; when ingesting hundreds of docs per second you will eventually hit your storage limit.

Summarize Historical Data with Rollups

Elasticsearch Index Rollup
Secondly, the value of your data tends to gradually decline (especially for logging and metrics use cases). Holding millisecond-level info doesn’t have the same value as when it was fresh and actionable, as opposed to being a year old. That’s why Elasticsearch allows you to rollup data to create aggregated views of the data and then store them in a different long-term index.

For the purposes of this lesson, we’ll focus the hands-exercises only on Dynamic Setting changes.

Hands-on Exercises

Before starting the hands-on exercises, we’ll need to download sample data to our index from this Coralogix Github repository.

Cluster Preparation

Before we can begin experimenting with shards we actually need more nodes to distribute them across. We’ll create 3 nodes for this purpose, but don’t worry, we’ll set it up to run on a single local host (our vm). This approach wouldn’t be appropriate for a production environment, but for our hands-on testing, it will serve us well.

Each node will require a different configuration, so we’ll copy our current configuration directory and create two new configuration directories for our second and third node.

sudo cp -rp /etc/elasticsearch/ /etc/elasticsearch-node-2
sudo cp -rp /etc/elasticsearch/ /etc/elasticsearch-node-3

Next, we need to edit the configurations. We will perform these changes under the Elasticsearch user to have sufficient permissions.

sudo -su elasticsearch

We need to make the following changes to the elasticsearch.yml configs file:

  • Pick a reasonable name for our cluster (eg. lecture-cluster)
  • Assign each node a unique name
  • Set the initial master nodes for the first cluster formation
  • Configure the max_local_storage_nodes setting (node.max_local_storage_nodes: 3)
    • This will allow us to share our data.path between all our nodes.

Perform these changes for our existing node using this command:

cat > /etc/elasticsearch/elasticsearch.yml <<- EOM
# ---------------------------------- Cluster -----------------------------------
cluster.name: lecture-cluster
# ------------------------------------ Node ------------------------------------
node.name: node-1
# ----------------------------------- Paths ------------------------------------
path.data: /var/lib/elasticsearch
path.logs: /var/log/elasticsearch
# ---------------------------------- Network -----------------------------------
network.host: 0
http.port: 9200
# --------------------------------- Discovery ----------------------------------
discovery.seed_hosts: ["127.0.0.1"]
cluster.initial_master_nodes: ["node-1", "node-2", "node-3"]
# ---------------------------------- Various -----------------------------------
node.max_local_storage_nodes: 3
EOM

Now we’ll do the same for the newly created configuration directories. Notice that we are incrementing the node name and node port:

for i in {2..3}
do
cat > /etc/elasticsearch-node-$i/elasticsearch.yml <<- EOM
# ---------------------------------- Cluster -----------------------------------
cluster.name: lecture-cluster
# ------------------------------------ Node ------------------------------------
node.name: node-${i}
# ----------------------------------- Paths ------------------------------------
path.data: /var/lib/elasticsearch
path.logs: /var/log/elasticsearch
# ---------------------------------- Network -----------------------------------
network.host: 0
http.port: 920${i}
# --------------------------------- Discovery ----------------------------------
discovery.seed_hosts: ["127.0.0.1"]
cluster.initial_master_nodes: ["node-1", "node-2", "node-3"]
# ---------------------------------- Various -----------------------------------
node.max_local_storage_nodes: 3
EOM
done

Next, we need to copy the systemd unit-file of Elasticsearch for our new nodes so that we will be able to run our nodes in separate processes.

cd /usr/lib/systemd/system
sudo cp elasticsearch.service elasticsearch-node-2.service
sudo cp elasticsearch.service elasticsearch-node-3.service

In the unit file, we need to change only a single line and that is providing the link to the node’s specific configuration directory.

sudo nano elasticsearch-node-2.service
# change following line
Environment=ES_PATH_CONF=/etc/elasticsearch-node-2
 
sudo nano elasticsearch-node-3.service
# change following line
Environment=ES_PATH_CONF=/etc/elasticsearch-node-3

Finally, we can reload the changes in the unit files.

sudo systemctl daemon-reload

To save us from potential trouble, make sure that in /etc/default/elasticsearch the following line is commented out. Otherwise, this default (ES_PATH_CONF) would override our new paths to the configuration directories when starting our service.

sudo nano /etc/default/elasticsearch
# Elasticsearch configuration directory
#ES_PATH_CONF=/etc/elasticsearch

Perfect! Now you can sequentially start all of our nodes.

sudo systemctl start elasticsearch
sudo systemctl start elasticsearch-node-2
sudo systemctl start elasticsearch-node-3

After they are started you can check the status of the cluster and that all nodes have joined in.

curl localhost:9200/_cluster/health?pretty

pasted image 0 32

Setup

For the following exercises we’ll use a data set provided on the Coralogix github (more info in this article). It consists of wikipedia pages data and is used also in other lectures. For this specific topic though, the actual data contents are not the most important aspect so feel free to play with any other data relevant for you, just keep the same index settings.

As we will be digging into sharding we will also touch on the aspect of clustering so make sure to prepare three valid nodes before continuing. But don’t worry you can still run on a single host.

Now, let’s download and index the data set with these commands:

mkdir index_design && cd "$_"
for i in {1..10}
do
  wget "https://raw.githubusercontent.com/coralogix-resources/wikipedia_api_json_data/master/data/wiki_$i.bulk"
done
 
curl --request PUT 'https://localhost:9200/example-index' 
--header 'Content-Type: application/json' 
-d '{"settings": { "number_of_shards": 1, "number_of_replicas": 0 }}'
 
for bulk in *.bulk
do
  curl --silent --output /dev/null --request POST "https://localhost:9200/example-index/_doc/_bulk?refresh=true" --header 'Content-Type: application/x-ndjson' --data-binary "@$bulk"
  echo "Bulk item: $bulk INDEXED!"
done

Dynamic Settings

Now let’s make put all the theoretical concepts we learned to action with a few practical exercises.

We’ll start with Dynamic Settings.

Let’s play with the number_of_replicas parameter. You can review all your current index settings with the following GET request:

vagrant@ubuntu-xenial:~$ curl --location --request GET 'https://localhost:9200/example-index/_settings?include_defaults=true&flat_settings=true&human&pretty'
>>>
{
 "example-index" : {
   "settings" : {
     "index.creation_date" : "1585482088406",
     "index.number_of_replicas" : "0",
     "index.number_of_shards" : "1",
...
   },
   "defaults" : {
     "index.refresh_interval" : "1s",     
     "index.blocks.metadata" : "false",
     "index.blocks.read" : "false",
     "index.blocks.read_only" : "false",
     "index.blocks.read_only_allow_delete" : "false",
     "index.blocks.write" : "false",
     "index.default_pipeline" : "_none",
...
   }
 }
}

As shown in the output, we see that we currently have only one primary shard in example-index and no replica shards. So, if our data node goes down for any reason, the entire index will be completely disabled and the data potentially lost.

To prevent this scenario, let’s add a replica with the next command.

vagrant@ubuntu-xenial:~$ curl --location --request PUT 'https://localhost:9200/example-index/_settings' 
--header 'Content-Type: application/json' 
--data-raw '{
   "index.number_of_replicas" : 1
}'
>>>
{"acknowledged":true}

At this point, it’s a good idea to check if all shards, both primary and replicas, are successfully initialized, assigned and started. A message stating UNASSIGNED could indicate that the cluster is missing a node on which it can put the shard.

By default, it would refuse to allocate the replica on the same primary node, which makes sense; it’s like putting all eggs in the same basket — if we lose the basket, we lose all the eggs.

You can consult the following endpoint to be sure that all your shards (both primary and replica ones) are successfully initialized, assigned and started.

vagrant@ubuntu-xenial:~$ curl --location --request GET 'https://localhost:9200/_cat/shards?v'
index         shard prirep state    docs   store ip        node
example-index 0     p      STARTED 38629 113.4mb 10.0.2.15 node-2
example-index 0     r      STARTED 38629 113.4mb 10.0.2.15 node-1

With this easy step, we’ve improved the resiliency of our data. If one node fails, the other can take its place. The cluster will continue to function and the replica will still have a good copy of the (potentially) lost data from the failed node.

Splitting Shards

We now have a setup of one primary shard on a node, and a replica shard on the second node, but our third node remains unused. To change that, we’ll scale and redistribute our primary shards with the _split API.

However, before we can start splitting, there are two things we need to do first:

  • The index must be read-only
  • The cluster health status must be green

Let’s take care of these splitting requirements!

To make the index read-only, we change the blocks dynamic setting:

curl --location --request PUT 'https://localhost:9200/example-index/_settings' 
--header 'Content-Type: application/json' 
--data-raw '{
   "index.blocks.write": true
}'
>>>
{"acknowledged":true}

Now let’s check the cluster health status to verify that’s in “green”:

curl --location --request GET 'https://localhost:9200/_cluster/health?pretty' | grep status
>>>
 "status" : "green",

The status shows as “green” so we can now move on to splitting with the following API call:

We’ll split it by a factor of 3, so 1 shard will become 3. All other defined index settings will remain the same, even for the new index, named example-index-sharded:

curl --location --request POST 'https://localhost:9200/example-index/_split/example-index-sharded' 
--header 'Content-Type: application/json' 
--data-raw '{
       "settings": {
               "index.number_of_shards": 3
       }
}'
>>>
{"acknowledged":true,"shards_acknowledged":true,"index":"example-index-sharded"}

We should note here that, when required, the  _split API allows us to pass standard parameters, like we do when creating an index. We can, thus, specify different desired settings or aliases for the target index.

If we now call the _cat API, we will notice that the new index more than tripled the size of its stored data, because of how the split operation works behind the scenes.

vagrant@ubuntu-xenial:~$ curl --location --request GET 'https://localhost:9200/_cat/shards?v'
index                 shard prirep state    docs   store ip        node
example-index-sharded 2     p      STARTED 12814  38.9mb 10.0.2.15 node-2
example-index-sharded 2     r      STARTED 12814 113.4mb 10.0.2.15 node-3
example-index-sharded 1     p      STARTED 12968 113.4mb 10.0.2.15 node-1
example-index-sharded 1     r      STARTED 12968 113.4mb 10.0.2.15 node-3
example-index-sharded 0     p      STARTED 12847  38.9mb 10.0.2.15 node-2
example-index-sharded 0     r      STARTED 12847 113.4mb 10.0.2.15 node-1
example-index         0     p      STARTED 38629 113.4mb 10.0.2.15 node-2
example-index         0     r      STARTED 38629 113.4mb 10.0.2.15 node-1

A merge operation will reduce the size of this data, eventually, when it will run automatically. If we don’t want to wait, we also have the option to force a merge, immediately, with the /_forcemerge API.

vagrant@ubuntu-xenial:~$ curl --location --request POST 'https://localhost:9200/example-index-sharded/_forcemerge'

However, we should be careful when using the /_forcemerge API on production systems. Some parameters can have unexpected consequences. Make sure to read the /_forcemerge API documentation thoroughly, especially the warning, to avoid side effects that may come as a result of using improper parameters.

how to get some insights on this – you can further inspect index /_stats API that goes into lot’s of details on you index’s internals. Hint: inspect it before you forcemerge and after and you may find some similar answers.

We can get insights on how our indices are performing with their new configuration. We do this by calling the /_stats API, which displays plenty of useful details. Here’s an example of how the size was reduced after splitting (on the left) and after merging (on the right).

pasted image 0 31

pasted image 0 33

Shrinking Shards

We tried splitting shards, now let’s try the opposite by reducing our number of shards the /_shrink API which works by dividing shards.

Note: While we’re just experimenting here, in real-world production scenarios, we would want to avoid shrinking the same shards that we previously split, or vice versa.

Before shrinking, we’ll need to:

  1. Make Index read-only
  2. Ensure a copy of every shard in the index is available on the same node
  3. Verify that the Cluster health status is green

We can force the allocation of each shard to one node with the index.routing.allocation.require._name setting. We’ll also activate read-only mode.

vagrant@ubuntu-xenial:~$ curl --location --request PUT 'https://localhost:9200/example-index-sharded/_settings' 
--header 'Content-Type: application/json' 
--data-raw '{
 "settings": {
   "index.routing.allocation.require._name": "node-1",
   "index.blocks.write": true
 }
}'

With prerequisites met, we can now shrink this to a new index with one shard and also reset the previously defined settings. Assigning “null” values brings the settings back to their default values:

vagrant@ubuntu-xenial:~$ curl --location --request POST 'https://localhost:9200/example-index-sharded/_shrink/example-index-shrunk' 
--header 'Content-Type: application/json' 
--data-raw '{
 "settings": {
   "index.routing.allocation.require._name": null,
   "index.blocks.write": null,
   "index.number_of_shards": 1
 }
}'

Learn More

A practical guide to FluentD

In this post we will cover some of the main use cases FluentD supports and provides example FluentD configurations for the different cases.

What is Fluentd

Fluentd is an open source data collector, which allows you to unify your data collection and consumption. Fluentd was conceived by Sadayuki “Sada” Furuhashi in 2011. Sada is a co-founder of Treasure Data, Inc., the primary sponsor of the Fluentd and the source of stable Fluentd releases.

Installation

Fluentd installation instructions can be found on the fluentd website.

Here are Coralogix’s Fluentd plugin installation instructions

Coralogix also has a Fluentd plug-in image for k8s.  This doc describes Coralogix integration with Kubernetes. 

Configuration

Flunetd configuration file consists of the following directives (only source and match are mandatory ones):

  1. source directives determine the input sources.
  2. match directives determine the output destinations.
  3. filter directives determine the event processing pipelines. (optional)
  4. system directives set system wide configuration. (optional)
  5. label directives group the output and filter for internal
    routing (optional)
  6. @include directives include other files. (optional)

Fluentd configuration is organized by hierarchy. Each of the directives has different plug-ins and each of the plug-ins has its own parameters. There are numerous plug-ins and parameters associated with each of them. In this post I will go over  on a few of the commonly used ones and focus on giving examples that worked for us here at Coralogix. I also tried to plug pointers to existing documentation to help you locate directive and plug-ins that are not mentioned here. 

Without further ado let’s dive in.

These directives will be present in any Fluentd configuration file:

Source

This is an example of a typical source section in a Fluentd configuration file:

<source>
  @type tail
  path /var/log/msystem.log
  pos_file /var/log/msystem.log.pos
  tag mytag
  <parse>
    @type none
  </parse>
</source>

Let’s examine the different components:

@type tail –  This is one of the most common  Fluentd input plug-ins. There are built-in input plug-ins and many others that are customized. The ‘tail’ plug-in allows Fluentd to read events from the tail of text files. Its behavior is similar to the tail -F command. The file that is read is indicated by ‘path’. Fluentd starts from the last log in the file on restart or from the last position stored in ‘pos_file’, You can also read the file from the beginning by using the ‘read_from_head true’ option in the source directive. When the log file is rotated Fluentd will start from the beginning. Each input plug-in comes with parameters that control its behavior. These are the tail parameters.

Tags allow Fluentd to route logs from specific sources to different outputs based on conditions. E.g – send logs containing the value “compliance” to a long term storage and logs containing the value “stage” to a short term storage.

The parser directive, <parse>, located within the source directive, , opens a format section. This is mandatory. It can use type none (like in our example) if no parsing is needed. This list includes the built-in parsers. There is an option to add a custom parser

One of the commonly used built-in parsers is ‘multiline’. Multiline logs are logs that span across lines. Log shippers will ship these lines as separate logs, making it hard to get the needed information from the log. The ‘Multiline’ parser enables the restructuring and formatting of multiline logs into the one log they represent. You can see a few examples of this parser in action in our examples’ section. See here for a full logging in multiline guide

An example of a multiline configuration file using regex:

<source>
  @type tail
  path /var/log/msystem.log
  pos_file /var/log/msystem.log.pos
  tag mytag
  <parse>
          @type multiline
          # Each firstline starts with a pattern matching the below REGEX.
          format_firstline /^d{2,4}-d{2,4}-d{2,4} d{2,4}:d{2,4}:d{2,4}.d{3,4}/
          format1 /(?<message>.*)/
  </parse>
</source>

These input plug-ins support the parsing directive.

Match  

The Match section uses a rule. Matches each incoming event to the rule and and routes it through an output plug-in. There are different output plug-ins. This is a simple example of a Match section:

<match mytag**>
   @type stdout
</match>

It will match the logs that have a tag name starting with mytag and direct them to stdout. Like the input plug-ins, the output ones come with their own parameters. See The http documentation as an example.  

Combining the two previous directives’ examples will give us a functioning Fluentd configuration file that will read logs from a file and send them to stdout.

HTTP output plug-in

One of the most common plugins is HTTP. We recommend using the generic HTTP output plugin, as it has plenty of adjustability and exposed metrics. Just insert the private key and paste the correct endpoint (you can look at the table below). You can read more in our tutorial.

Here is a basic HTTP plug in example:

<match **>
  @type http
  @id out_http_coralogix
#The @id parameter specifies a unique name for the configuration. It is used as paths for buffer, storage, logging and for other purposes.
  endpoint "https://ingress.<domain>/logs/rest/singles"
  headers {"private_key":"xxxxxxx"}
  error_response_as_unrecoverable false
  <buffer tag>
    @type memory
    chunk_limit_size 5MB
    compress gzip
    flush_interval 1s
    overflow_action block
    retry_max_times 5
    retry_type periodic
    retry_wait 2
  </buffer>
  <secondary>
    #If any messages fail to send they will be send to STDOUT for debug.
    @type stdout
  </secondary>
</match>

Choose the correct https://ingress.<domain>/logs/rest/singles endpoint that matches the cluster under this URL.

Filter

Another common directive, and one that is mandatory in this case, is ‘filter’. The name of this directive is self explanatory. The filter plug-ins allow users to:

  • Filter out events by grepping the value of one or more fields.
  • Enrich events by adding new fields.
  • Delete or mask certain fields for privacy and compliance.
  • Parse text log messages into JSON logs

Filters can be chained together.

In order to pass our data to Coralogix API we must manipulate our data (using the record_transformer plugin) so the structure of the data will be valid by the API.

As an example, this filter will show the fields needed in order to be valid by the API:

  <filter **>
    @type record_transformer
    @log_level warn
    #will only show warn and info logs
    enable_ruby true
    #allows the usage of ${}
    auto_typecast true
    renew_record true
    <record>
      # In this example we are using record to set values.
      # Values can also be static, dynamic or simple variables
      applicationName app
      subsystemName subsystem
      timestamp ${time.strftime('%s%L')} # Optional
      text ${record.to_json} # using {record['message']} will display as txt
    </record>
  </filter>

At this point we have enough Fluentd knowledge to start exploring some actual configuration files.

The rest of this document includes more complex examples of Fluentd configurations. They include detailed comments and you can use them as references to get additional information about different plug-ins and parameters or to learn more about Fluentd.

Configuration examples

Example 1

This configuration example shows how to use the rewrite_tag_filter plug-in to separate the logs into two groups and send them with different metadata values.

<source>
  @type tail
  #Reading from file locateed in path and saving the pointer to the file line in pos_file
  @label @CORALOGIX
  #Label reduces complex tag handling by separating data pipelines, CORALOGIX events are routed to label @CORALOGIX
  path /var/log/nginx/access.log
  pos_file /var/log/td-agent/nginx/access.log.pos
  tag nginx.access
  #tagging it as the nginx access logs
  <parse>
    @type nginx
    #nginx parsing plugin
  </parse>
</source>

<source>
  @type tail
  @label @CORALOGIX
  path /var/log/nginx/error.log
  pos_file /var/log/td-agent/nginx/error.log.pos
  tag nginx.error
  #tagging it as the nginx error logs
  <parse>
    @type none
    #no parsing is done
  </parse>
</source>

<label @CORALOGIX>
#as mentioned above events are routed from @label @CORALOGIX
  <filter nginx.access>
  #nginx access logs will go through this filter
    @type record_transformer
    #using this plugin to manipulate our data
    <record>
      severity "info"
      #nginx access logs will be sent as info
    </record>
  </filter>

  <filter nginx.error>
    @type record_transformer
    #error logs will go throgh this filter
    <record>
      severity "error"
      #error logs will be sent as error
    </record>
  </filter>
  <filter **>
    @type record_transformer
    @log_level warn
    enable_ruby true
    auto_typecast true
    renew_record true
    <record>
      # In this example we are using record.dig to dynamically set values.
      # Values can also be static or simple variables
      applicationName fluentD
      subsystemName ${tag}
      timestamp ${time.strftime('%s%L')} # Optional
      text ${record['message']}
#will send the log as a regular text
    </record>
  </filter>
  <match **>
    @type http
    @id coralogix
    endpoint "https://ingress.coralogixstg.wpengine.com/logs/rest/singles"
    headers {"private_key":"XXXXX"}
    retryable_response_codes 503
    error_response_as_unrecoverable false
    <buffer>
      @type memory
      chunk_limit_size 5MB
      compress gzip
      flush_interval 1s
      overflow_action block
      retry_max_times 5
      retry_type periodic
      retry_wait 2
    </buffer>
    <secondary>
      #If any messages fail to send they will be send to STDOUT for debug.
      @type stdout
    </secondary>
  </match>
</label>

Example 2

In this example a file is read starting with the last line (the default). The message section of the logs is extracted and the multiline logs are parsed into a json format.

<source>
  @type tail
  path M:/var/logs/inputlogs.log
  pos_file M:/var/logs/inputlogs.log.pos
  tag mycompany
  <parse>
# This parse section will find the first line of the log that starts with a date. The log 
#includes  the substring “message”. ‘Parse’ will extract what follows “message” into a #json field called ‘message’. See additional details in #Example 1.
    @type multiline
    format_firstline /^d{2,4}-d{2}-d{2,4}/
    format1 /(?<message>.*)/
  </parse>
</source>
  <match **>
#match is going to use the HTTP plugin
    @type http
    @davidcoralogix-com
#The @id parameter specifies a unique name for the configuration. It is used as paths for buffer, storage, logging and for other purposes.
    endpoint "https://ingress.coralogixstg.wpengine.com/logs/rest/singles"
    headers {"private_key":"XXXXX"}
    retryable_response_codes 503
    error_response_as_unrecoverable false
    <buffer>
      @type memory
      chunk_limit_size 5MB
      compress gzip
      flush_interval 1s
      overflow_action block
      retry_max_times 5
      retry_type periodic
      retry_wait 2
    </buffer>
    <secondary>
      #If any messages fail to send they will be send to STDOUT for debug.
      @type stdout
    </secondary>
  </match>

Example 3

This example uses the http input plug-in. This plug-in enables you to gather logs while sending them to an end point. It uses the enable_ruby option to transform the logs and uses the copy plug-in to send logs to two different inputs.

<source>
  @type http
  port 1977
  bind 0.0.0.0
  tag monitor
#This indicates the max size of a posted object   
  body_size_limit 2m
#This is the timeout to keep a connection alive
  keepalive_timeout 20s
#If true adds the http prefix to the log
  add_http_headers true
#If true adds the remote, client address, to the log. If there are multiple forward headers in the request it will take the first one  
  add_remote_addr true
  <parse> 
     @type none
  </parse>
</source>

<filter monitor>
#record_transformer is a filter plug-in that allows transforming, deleting, and adding events
  @type record_transformer
#With the enable_ruby option, an arbitrary Ruby expression can be used inside #${...}
  enable_ruby
#Parameters inside <record> directives are considered to be new key-value pairs
  <record>
#Parse json data inside of the nested field called “log”. Very useful with #escaped fields. If log doesn’t exist or is not a valid json, it will do #nothing. 
    log ${JSON.parse(record["log"]) rescue record["log"]}
#This will create a new message field under root that includes a parsed log.message field.
    message ${JSON.parse(record.dig(“log”, “message”)) rescue ""}
  </record>
</filter>
<match monitor>
  @type copy
  <store>
    @type http
    @id coralogix
    endpoint "https://ingress.coralogixstg.wpengine.com/logs/rest/singles"
    headers {"private_key":"XXXXX"}
    retryable_response_codes 503
    error_response_as_unrecoverable false
    <buffer>
      @type memory
      chunk_limit_size 5MB
      compress gzip
      flush_interval 1s
      overflow_action block
      retry_max_times 5
      retry_type periodic
      retry_wait 2
    </buffer>
  </store>

  <store>
    @type stdout
    output_type json
  </store>
</match>

<match **>
#Split is a third party output plug-in. It helps split a log and parse #specific fields.
  @type split
#separator between split elements 
  separator   s+
#regex that matches the keys and values within the splitted key
  format      ^(?<key>[^=]+?)=(?<value>.*)$
#Key that holds the information to be splitted
  key_name message
#keep the original field
  reserve_msg yes
  keep_keys HTTP_PRIVATE_KEY
</match>

Example 4

This example uses label in order to route the logs through its Fluentd journey. At the end we send Fluentd logs to stdout for debug purpose.

# Read Tomcat logs
<source>
#Logs are read from a file located at path. A pointer to the last position in #the log file is located at pos_file
  @type tail
#Labels allow users to separate data pipelines. You will see the lable section #down the file.
  @label @AGGREGATION
  path /usr/local/tomcat/logs/*.*
#adds the watched file path as a value of a new key filename in the log
  path_key filename
#This path will not be watched by fluentd
  exclude_path ["/usr/local/tomcat/logs/gc*"]
  pos_file /fluentd/log/tomcat.log.pos
  <parse>
#This parse section uses the multi_format plug-in. This plug-in needs to be #downloaded and doesn’t come with Fluentd. After installing it users can #configure multiple <pattern>s to #specify multiple parser formats. In this #configuration file we have 2 patterns being formatted. 
    @type multi_format
    # Access logs
    <pattern>
      format regexp
      expression /^(?<client_ip>.*?) [(?<timestamp>d{2}/[a-zA-Z]{3}/d{4}:d{2}:d{2}:d{2} +d{4})] "(?<message>.*?)" (?<response_code>d+) (?<bytes_send>[0-9-]+) (?<request_time>d+)$/
      types response_code:integer,bytes_send:integer,request_time:integer
#Specifies time field for event time. If the event doesn't have this field, #current time is used.
      time_key timestamp
#Processes value using specific formats
      time_format %d/%b/%Y:%T %z
#When true keeps the time key in the log
      keep_time_key true
    </pattern>
# Stacktrace or undefined logs are kept as is
    <pattern>
      format none
    </pattern>
  </parse>
  tag tomcat
</source>

# Read Cloud logs
<source>
  @type tail
  @label @AWS
  path /usr/local/tomcat/logs/gc*
  pos_file /fluentd/log/gc.log.pos
  format none
  tag gclogs
</source>

# Route logs according to their types
<label @AGGREGATION>
  # Strip log message using a filter section
  <filter tomcat.**>
#record_transformer is a filter plug-in that allows transforming, deleting, and #adding events
    @type record_transformer
#With the enable_ruby option, an arbitrary Ruby expression can be used inside #${...}
    enable_ruby
#Parameters inside <record> directives are considered to be new key-value pairs
    <record>
      message ${record["message"].strip rescue record["message"]}
    </record>
  </filter>
# Delete undefined character
# This filter section filters the tomcat logs 
  <filter tomcat.**>
#record_transformer is a filter plug-in that allows transforming, deleting, and #adding events
    @type record_transformer
    Enable_ruby
#Parameters inside <record> directives are considered to be new key-value pairs
    <record>
      message ${record["message"].encode('UTF-8', invalid: :replace, undef: :replace, replace: '?') rescue record["message"]}
    </record>
  </filter>

# Concat stacktrace logs to processing
  <filter tomcat.**>
#A plug-in that needs to be installed
    @type concat
#This is the key for part of the multiline log
    key message
#This defines the separator
    separator " "
#The key to determine which stream an event belongs to
    stream_identity_key filename
#The regexp to match beginning of multiline.
    multiline_start_regexp /^((d{2}/d{2}/d{4} d{2}:d{2}:d{2}.d{1,3})|(d{2}-[a-zA-Z]{3}-d{4} d{2}:d{2}:d{2}.d{1,3})|NOTE:) /
#Use timestamp of first record when buffer is flushed.
    use_first_timestamp true
#The number of seconds after which the last received event log will be flushed
    flush_interval 5
#The label name to handle events caused by timeout
    timeout_label @PROCESSING
  </filter>
# Route logs to processing
  <match tomcat.**>
    @type relabel
    @label @PROCESSING
  </match>
</label>

 # Process simple logs before sending to Coralogix
<label @PROCESSING>
# Parse stacktrace logs
  <filter tomcat.**>
    @type parser
    format /^(?<timestamp>d{2}/d{2}/d{4} d{2}:d{2}:d{2}.d{1,3}) (?<hostname>.*?)|(?<thread>.*?)|(?<severity>[A-Z ]+)|(?<TenantId>.*?)|(?<UserId>.*?)|(?<executor>.*?) - (?<message>.*)$/
#Specifies time field for event time. If the event doesn't have this field, #current time is used.
    time_key timestamp
#Processes value using specific formats
    time_format %d/%m/%Y %T.%L
#When true keeps the time key in the log
    keep_time_key true
    key_name message
    reserve_data true
    emit_invalid_record_to_error false
  </filter>

 # Parse access logs request info
  <filter tomcat.**>
    @type parser
    format /^(?<method>GET|HEAD|POST|PUT|DELETE|CONNECT|OPTIONS|TRACE|PATCH) (?<path>/.*?) (?<protocol>.+)$/
    key_name message
    hash_value_field request
    reserve_data true
    emit_invalid_record_to_error false
  </filter>

# Other logs  
  <filter tomcat.**>
#This is a filter plug-in that pases the logs
    @type parser
    format /^(?<timestamp>d{2}-[a-zA-Z]{3}-d{4} d{2}:d{2}:d{2}.d{1,3}) (?<severity>[A-Z ]+) [(?<thread>.*?)] (?<executor>.*?) (?<message>.*)$/
#Specifies time field for event time. If the event doesn't have this field, #current time is used.
    time_key timestamp
#Processes value using specific formats
    time_format %d-%b-%Y %T.%L
#When true keeps the time key in the log
    keep_time_key true
#message is a key in the log to be filtered
    key_name message
#keep the other key:value pairs
    reserve_data true
#Emit invalid records to @ERROR label. Invalid cases are key not exist, format #is not matched, and unexpected error. If you want to ignore these errors set #to false.
    emit_invalid_record_to_error false
  </filter>

# Add filename and severity
  <filter tomcat.**>
#record_transformet is a filter plug-in that allows transforming, deleting, and #adding events
    @type record_transformer
#With the enable_ruby option, an arbitrary Ruby expression can be used inside #${...}
    Enable_ruby
#Parameters inside <record> directives are considered to be new key-value pairs
    <record>
#Overwrite the value of filename with the filename itself without the full path
      filename ${File.basename(record["filename"])}
#Takes the value of the field “severity” and trims it. If there is no severity #field create it and return the value DEBUG
      severity ${record["severity"].strip rescue "DEBUG"}
    </record>
  </filter> 
  # Route logs to output
  <match tomcat.**>
#Routes all logs to @labe
    @type relabel
    @label @CORALOGIX
  </match>
</label>

<label @CORALOGIX>
  <match **>
    @type http
    @id coralogix
    endpoint "https://ingress.coralogixstg.wpengine.com/logs/rest/singles"
    headers {"private_key":"d2aaf000-4bd8-154a-b7e0-aebaef7a9b2f"}
    retryable_response_codes 503
    error_response_as_unrecoverable false
    <buffer>
      @type memory
      chunk_limit_size 5MB
      compress gzip
      flush_interval 1s
      overflow_action block
      retry_max_times 5
      retry_type periodic
      retry_wait 2
    </buffer>
</label>

# Send GC logs to AWS S3 bucket
#<label> indicates that only AWS labeled logs will be processed here. They will #skip sections not labeled with AWS
<label @AWS>
  <match gclogs.**>
#The S3 output plugin is included with td-agent (not with Fluentd). You can get #information about its specific parameters in the documentation
   @type s3
   aws_key_id "#{ENV['AWS_ACCESS_KEY_ID']}"
   aws_sec_key "#{ENV['AWS_SECRET_ACCESS_KEY']}"
   s3_bucket "#{ENV['S3Bucket']}"
   s3_region us-east-1
   path /logs/"#{ENV['SUBSYSTEM_NAME']}"
   buffer_path /fluentd/logs
   store_as text
   utc
   time_slice_format %Y%m%d%H
   time_slice_wait 10m
   s3_object_key_format "%{path}%{time_slice}_#{Socket.gethostname}%{index}.%{file_extension}"
   buffer_chunk_limit 256m
   <buffer time>
    timekey      1h # chunks per hours ("3600" also available)
    timekey_wait 5m # 5mins delay for flush ("300" also available)
   </buffer>
  </match>
</label>
 
# Print internal Fluentd logs to console for debug
<match fluent.**>
  @type stdout
  output_type hash
</match>

Example 5

The following configuration reads the input files starting with the first line. Then transform multi line logs into a json format. It sends the logs to stdout.

<source>
  @type tail
#The parameter ‘read_from_head’ is set to true. It will read all files from the #first line instead of #the default last line
  tag audit
  read_from_head true
# Adds the file name to the sent log.  
  path_key filename
  path /etc/logs/product_failure/*.*.testInfo/smoke*-vsim-*/mroot/etc/log/auditlog.log.*
  pos_file /etc/logs/product_failure/audit_logs.fluentd.pos
  <parse>
#The multiline parser plugin parses multiline logs. This plugin is multiline #version of regexp parser.
    @type multiline
#This will match the first line of the log to be parsed. The plugin can skip #the logs until format_firstline is matched.
    format_firstline /^(?<timestamp>[a-zA-Z]{3} [a-zA-Z]{3} *[0-9]{1,2} [0-9]{2}:[0-9]{2}:[0-9]{2}(?: [A-Z]+)?)/
#Specifies regexp patterns. For readability, you can separate regexp patterns #into multiple format1 … formatN. The regex will match the log and each named #group will become a key:value pair in a json formatted log. The key will be #the group name and the value will be the group value.
    format1 /^(?<timestamp>[a-zA-Z]{3} [a-zA-Z]{3} *[0-9]{1,2} [0-9]{2}:[0-9]{2}:[0-9]{2}(?: [A-Z]+)?) [(?<machine>[^:]+):(?<shell>[^:]+):(?<severity>[^]]+)]: (?<message>.*)/
  </parse>
</source>

# Send to STDOUT
<match *>
  @type stdout
</match>