The new standard of observability is here. Discover Olly, the industry’s first
Observability data arrives as a flood of signals, full of potential, but rarely consistent. Error messages and debug logs can reveal what businesses care about: reliability, customer experience, and revenue. The challenge is turning raw technical events into information the whole organization can act on.
Many observability systems store data first and structure it later, forcing teams to rebuild context in dashboards and queries, often duplicating logic across services.
Coralogix takes a different approach: by decoupling storage from compute, raw telemetry can be queried and analyzed in real time directly from your own cloud storage using DataPrime and AI-driven capabilities.
Additionally, Data Pipeline continuously refines telemetry at ingest, parsing, enriching, and shaping it into consistent, contextual, business-relevant signals, without requiring app code or logging changes.
The problem with opaque data
Imagine a log line generated during a checkout process:
2026-02-14T10:45:23Z ERROR CheckoutService - Failed to process payment. Error details: item 66VCHJNUP, qty 1, code 500An engineer might notice the product ID buried in the string. Elsewhere in the organization, that ID maps to a product name, price, and category, information that could immediately quantify business impact. When telemetry carries that context at ingestion time, queries get simpler, correlations get faster, and dashboards become more meaningful.
In legacy systems, achieving this clarity often means a heavy overhead: changing application code and logging formats, redeploying services, and repeating parsing logic across teams. Coralogix centralizes this work in real time, structuring and enriching telemetry as it’s ingested, before it’s analyzed, visualized, or routed.
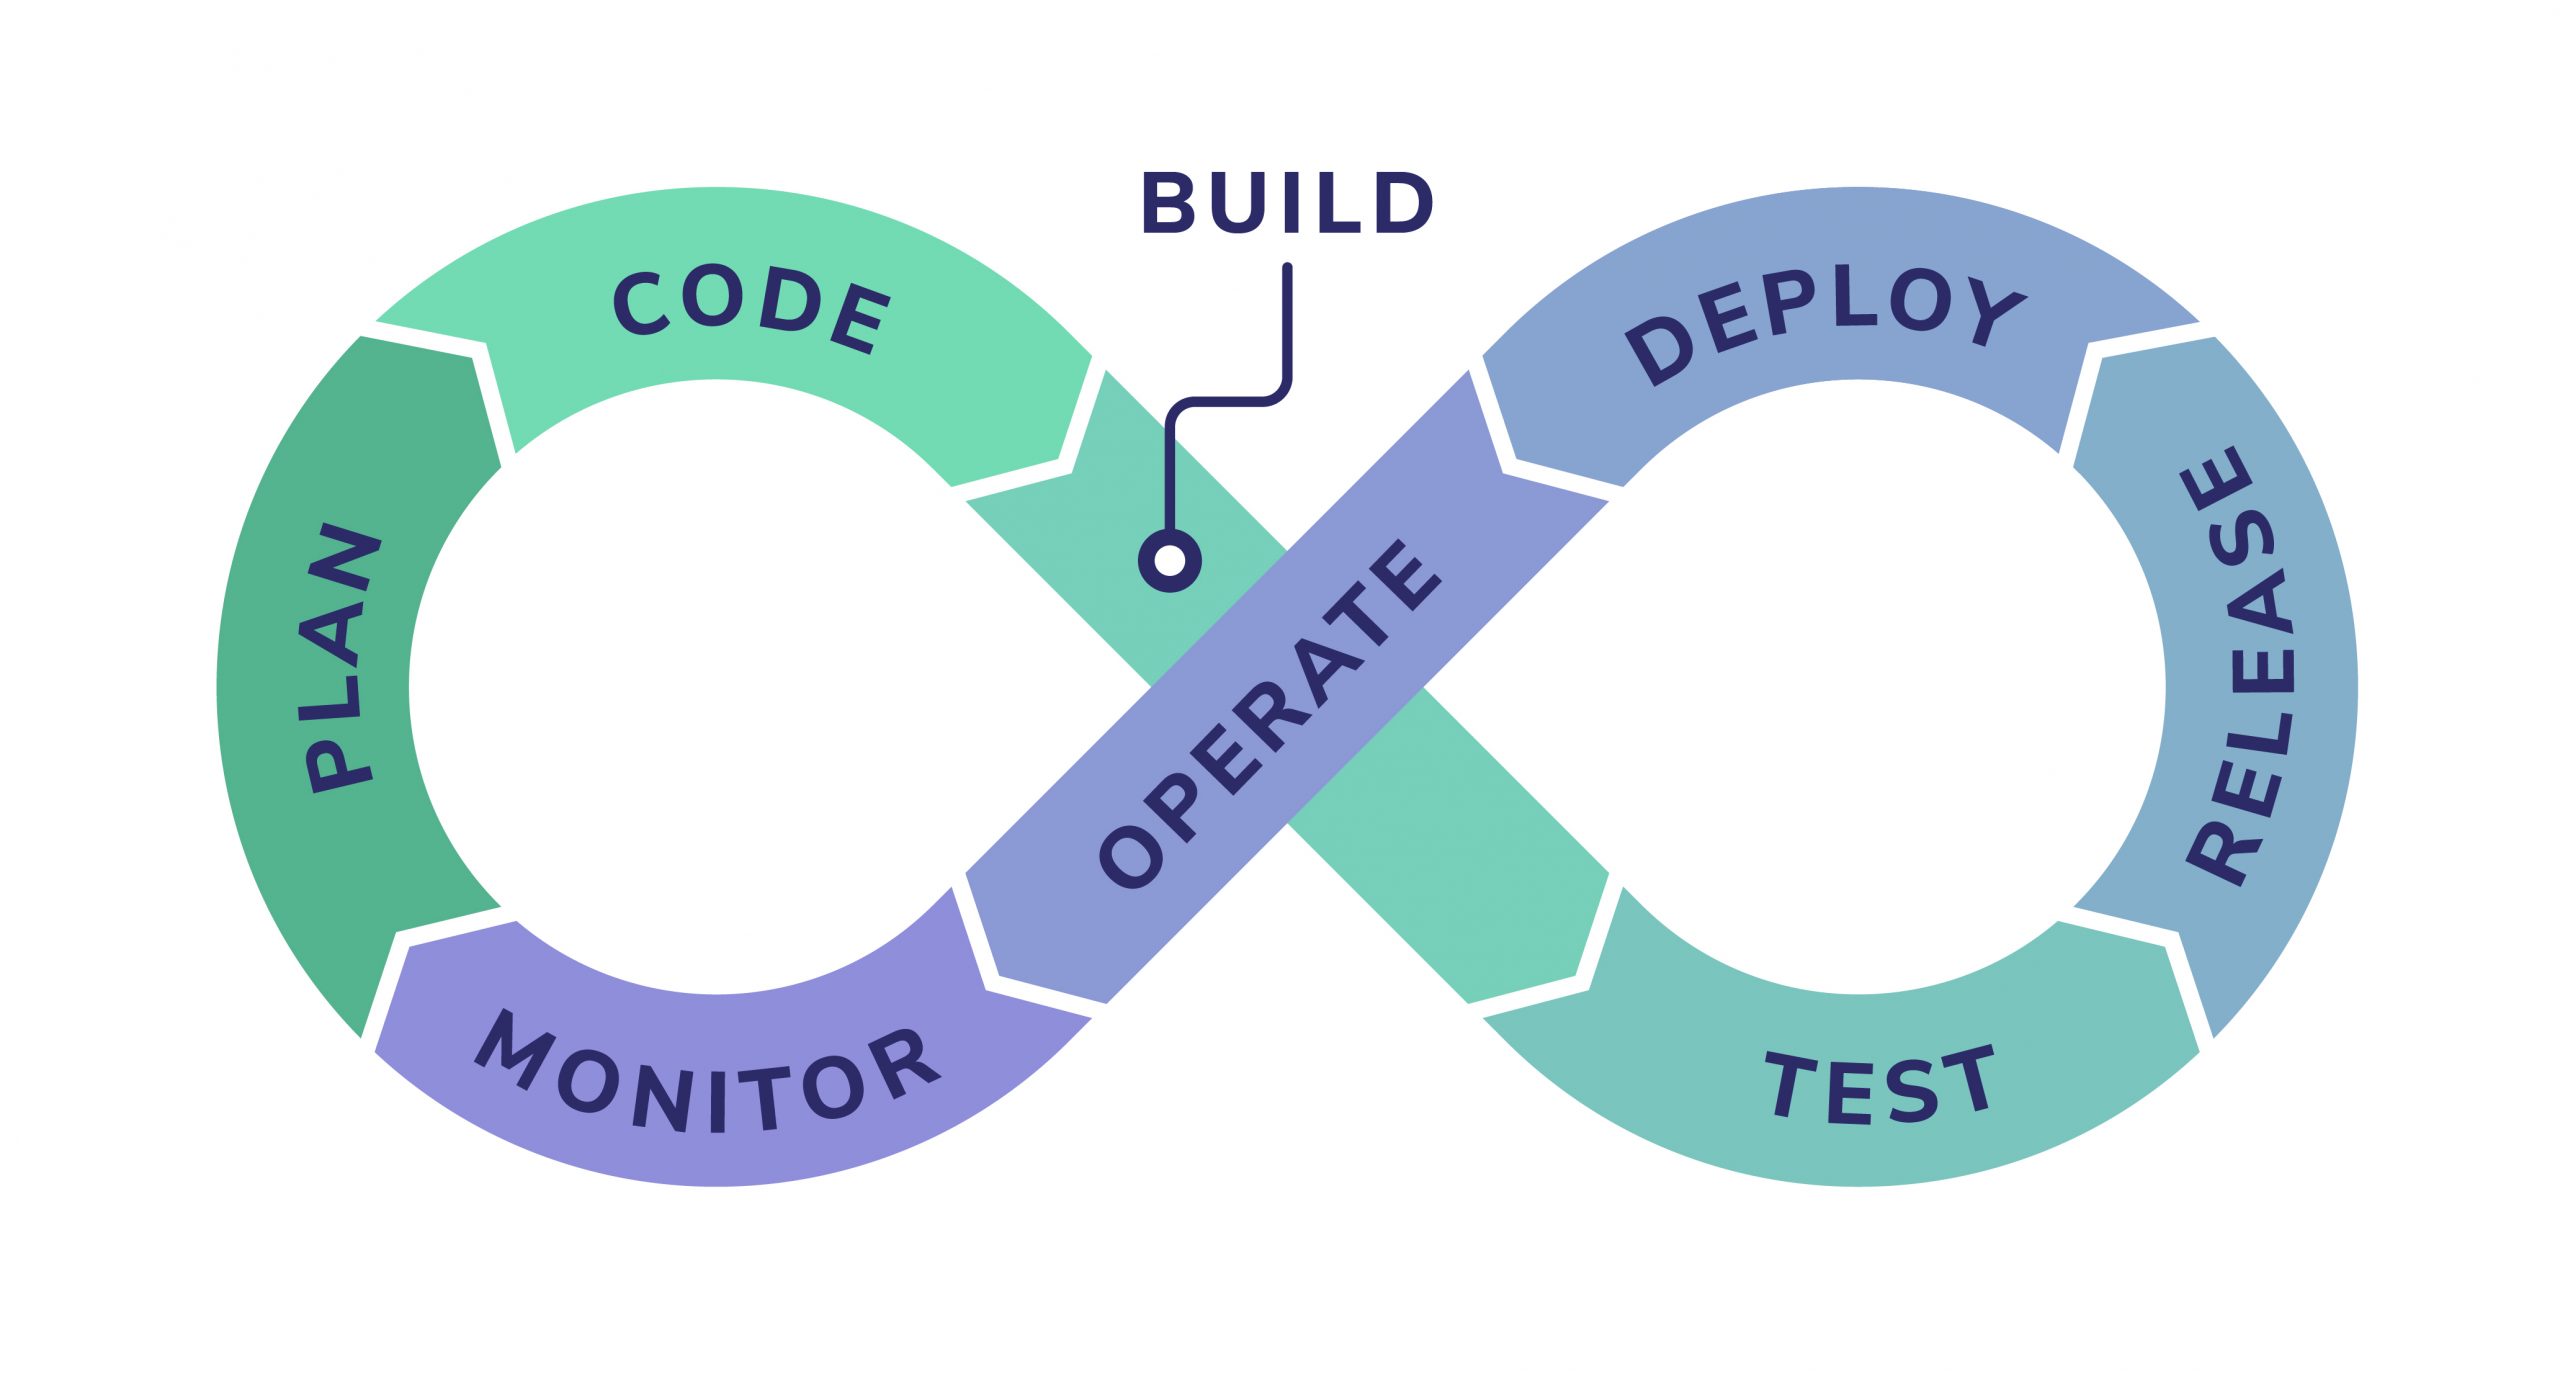
How the Coralogix Data Pipeline works
As data flows into Coralogix, it passes through a centralized pipeline that transforms raw telemetry into clear, contextual signals. Processing logic can be defined once and applied consistently, without requiring teams to change app code or implement client-side logic. The pipeline operates in-stream, shaping telemetry in real time before it’s written to storage.
The pipeline can be understood as four stages:
- Stage 1: Create meaning
- Stage 2: Understand flow
- Stage 3: Control spend
- Stage 4: Govern at scale
Let’s walk through them using our checkout example.
Stage 1: Data Shaping – create meaning
Stage 1 turns raw logs into structured, contextual signals that can be used across the platform.
Parsing rules: sanitize and standardize
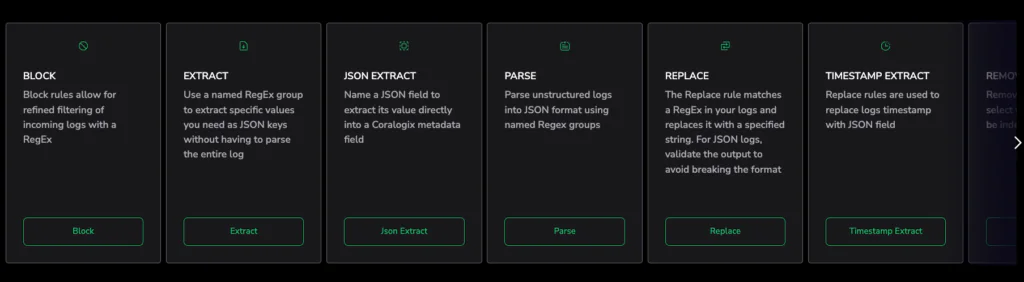
At this step, Parsing Rules transform unstructured messages into consistent key-value fields. Formats are normalized, noise can be removed, and sensitive information can be masked.
For our checkout error, parsing can extract the product ID and restructure the message into a standardized JSON document:
{
"service": "CheckoutService",
"level": "ERROR",
"product_id": "66VCHJNUP",
"quantity": 1,
"error_code": 500
}
Now the event is machine-readable and ready for enrichment.
Data enrichment: add context
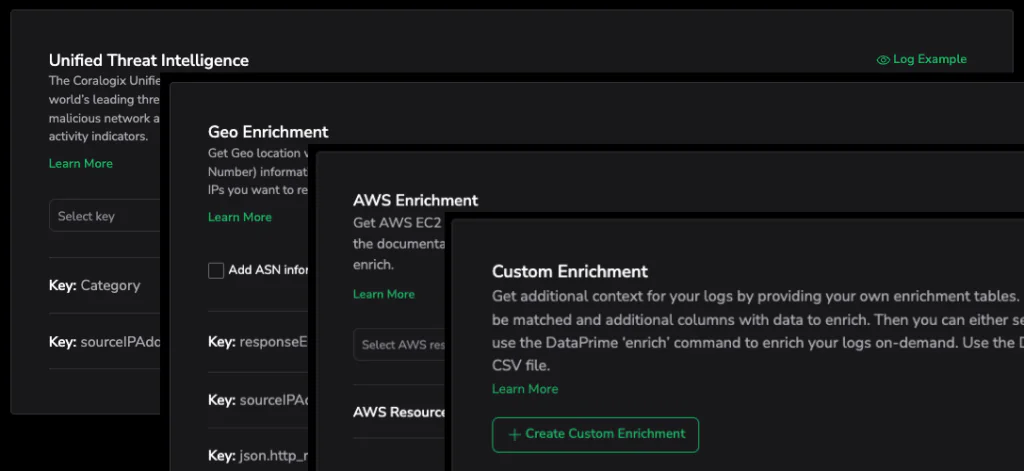
Structured data becomes highly actionable when context is added. Coralogix performs high-scale, stateful enrichment directly within the stream, including:
- Security & Threat Intelligence: Automatically flagging malicious IPs.
- Geolocation: Mapping user impact by region.
- Cloud infrastructure tagging: Mapping logs to specific clusters or microservices.
- Custom reference tables: maps log values to a custom table to automatically add metadata to your data
- Custom Enrichments: Appends custom business data to your logs
In our example, once product_id is standardized, it can be joined with a reference table that contains product metadata (name, price, category). The enriched event might look like:
{
"service": "CheckoutService",
"level": "ERROR",
"product_id": "66VCHJNUP",
"quantity": 1,
"error_code": 500,
"product_name": "Wireless Speaker X",
"price": 129,
"category": "Audio"
}
This transforms an error log into a business insight. Instead of only seeing that checkout failed, you can see what revenue was at risk in that moment for a specific product and customer journey. That’s the foundation of Organization Intelligence: engineering and business data speaking the same language.
Events2Metrics, Recording Rules (operational prep)
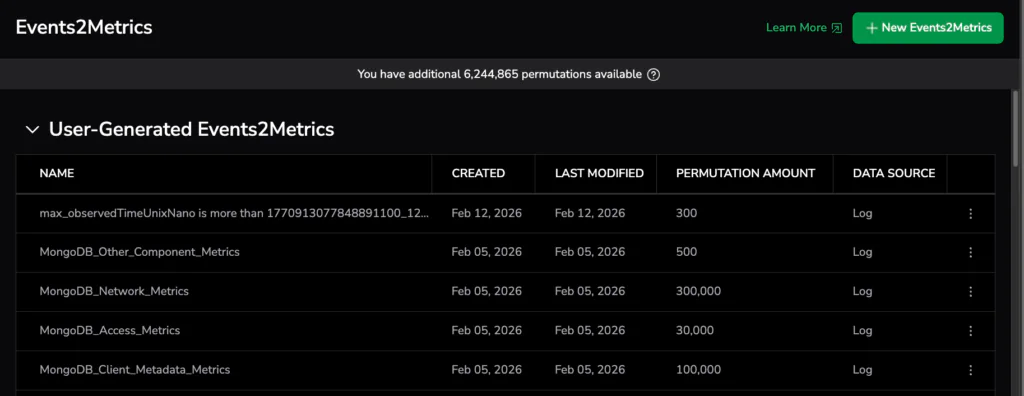
If needed, enriched events can also be operationalized further. Events2Metrics can transform them into measurable metrics for aggregation and alerting. Recording Rules can be created for standardized data that multiple teams rely on.
By the end of Stage 1, a raw log line has become a structured, contextual signal. Meaning has been created at ingestion time. The result is data that is not only immediately queryable but also includes both business and technical contexts.
Stage 2: Data Usage – understand flow
Once data has meaning, the next step is visibility and understanding: how much is flowing, where it’s routed to, and what effect your pipeline rules are having.
Included Features
- Data Usage: Provides visibility into ingestion volumes and distribution across services and datasets
- Data Usage – Extension: Expands insight into data flow and patterns
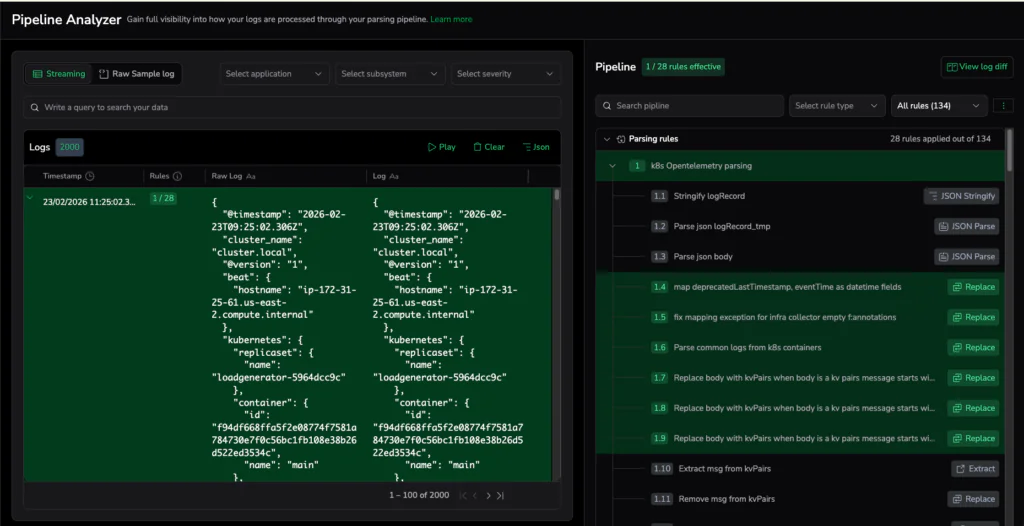
- Pipeline Analyzer: Helps analyze how pipeline rules impact data in the system
In the checkout scenario, teams can move from “we saw errors later” to real-time operational awareness, triggering an alert when enriched payment failures cross a threshold, even before logs are persisted. Instead of waiting for dashboards, teams can quantify impact in the moment: frequency, affected products, and potential revenue at risk.
Stage 3: Cost Optimization – align spend with business value
Once you understand what data is flowing through your pipeline and what it represents, the next step is control.
Cost Optimization ensures that observability spend reflects the value of the signals being collected. Some events are tied directly to revenue, security risk, or customer experience. Others are low-impact debug logs that can be routed for archiving.
Included Features
- TCO Optimizer – Provides visibility into cost drivers and optimization opportunities
- Quota Rules – Define limits and controls on data ingestion
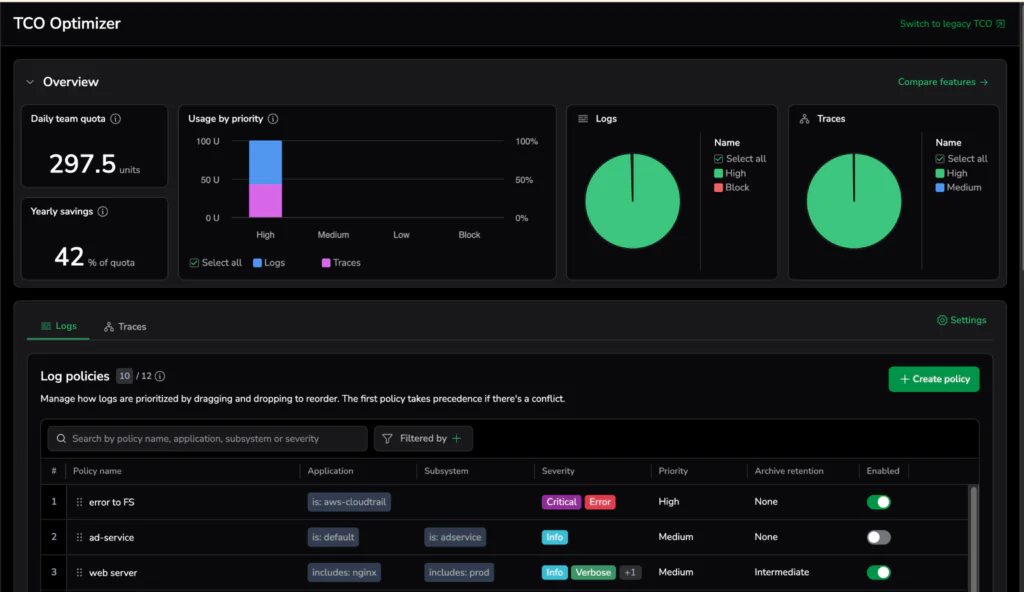
Returning to our checkout example, enriched payment failures tied to revenue impact are high-value signals. These events may deserve a higher performance tier. Verbose debug logs from non-production environments may be routed to lower-cost storage, retained for shorter periods, or limited by quota rules.
Because the data was shaped and contextualized in Stage 1, cost decisions are now based on impact, not guesswork.
Stage 4: Govern Data – operate at scale
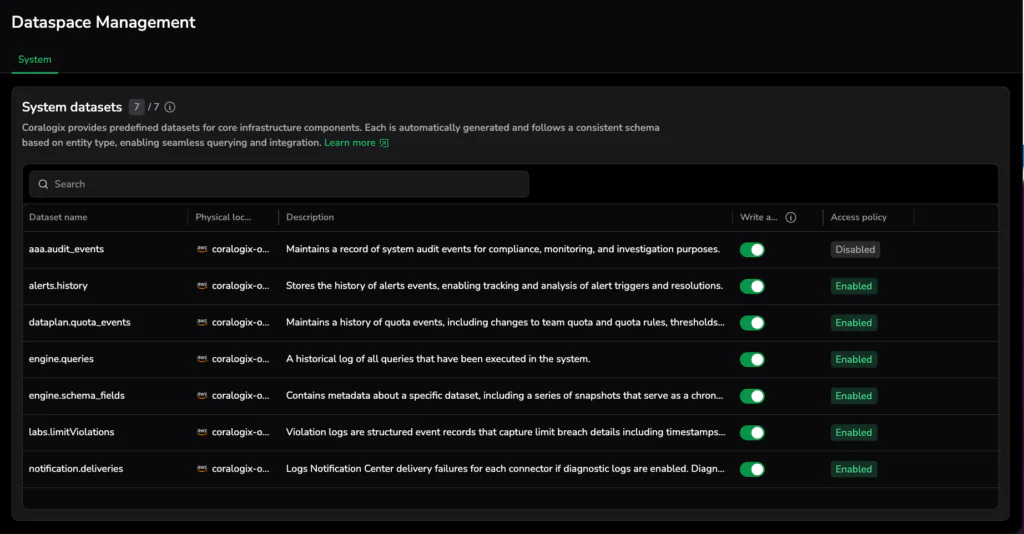
As observability data scales, governance becomes essential. Without clear structure and ownership, even well-shaped data can drift. Granular routing and access rules can also create overhead.
Stage 4 ensures that observability data remains consistent, organized, and reusable across teams and use cases.
Included Features
- Dataset Management: Organize data into logical groupings aligned with services, teams, or business domains
- Forwarders: Route data to the right destinations, internally or externally, based on policy
- Schema Manager & Reserved Fields: Enforce consistent structure and protect critical fields across environments
- Metrics Explorer: Explore and standardize metric usage across the organization
Returning to our checkout example, governance makes sure checkout events:
- Land in the correct datasets
- Maintain consistent field definitions (like product_id, price, category)
- Can be safely reused across dashboards, alerts, and AI-driven workflows
- Remain stable as teams evolve and services scale
Governance keeps data consistent and controlled: schemas stay stable, routing is policy-driven, and permissions are enforced, so teams can scale safely.
Returning to the checkout example: from error to insight
The original checkout failure began as an opaque string. After moving through the Data Pipeline, the product ID is structured, business context is attached, usage is measured, cost policies are applied, and governance maintains consistency.
For example, you could run a simple query to measure checkout failures for a specific product:
source logs
| filter json.service == 'CheckoutService'
| filter json.level == 'ERROR'
| filter json.product_name == 'Wireless Speaker X'
| create hour_bucket from $m.timestamp / 1.toInterval('h')
| groupby hour_bucket
| aggregate count() as failures,
sum(json.price) as revenue_at_risk
Because key fields were extracted and enriched at ingest, calculating failure volume and potential revenue impact becomes straightforward.
Now you can ask and answer questions that weren’t previously obvious:
- How many checkout failures of this type occurred in the last hour?
- What is the estimated revenue at risk?
- Is the issue isolated to a specific region or environment?
Instead of reporting “we have a bug,” teams can report: “Checkout errors affecting Product X have resulted in $360 of revenue risk in the last two hours.” That’s the foundation of Organization Intelligence: engineering and business data speaking the same language.
Conclusion: refinement creates value
In Coralogix, you can query data the moment it arrives, even raw. But as telemetry is shaped, enriched, and standardized in-stream, it becomes easier to correlate, faster to query, and more reliable to reuse across teams.
That’s the difference between technical visibility and actionable business insight: quicker investigations, clearer decisions, and a tighter link between technical events and business impact.