Coralogix’s Cross-Vendor Compatibility To Keep Your Workflow Smooth

Coralogix supports logs, metrics, traces and security data, but some organizations need a multi-vendor strategy to achieve their observability goals, whether it’s developer adoption, or vendor lock-in is preventing them from migrating all of their data.

Coralogix offers a set of features that allow customers to bring all of their data into a single flow—across SaaS and hosted solutions. 

Custom actions: Bring extensibility to your data

Custom actions in Coralogix let customers define bespoke functionality within the platform, such as redirect their browser to another SaaS vendor, a hosted solution within their VPN or another application entirely. Custom actions enable extensible observability, which is the key to a cross-vendor strategy.

How does it work?

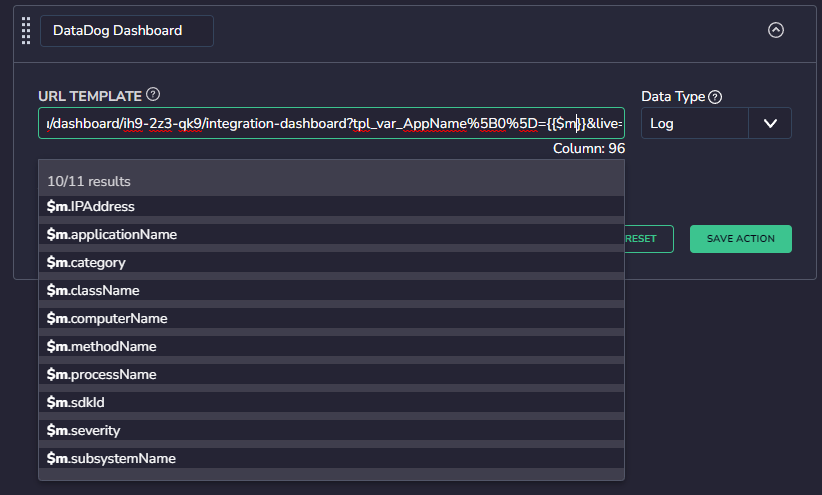
Custom actions allow Coralogix customers to populate URL templates with values from the data. For example, a custom action attached to a log can template a URL with values from within the log document, or any related metadata. 

Joining Coralogix logs to DataDog metrics

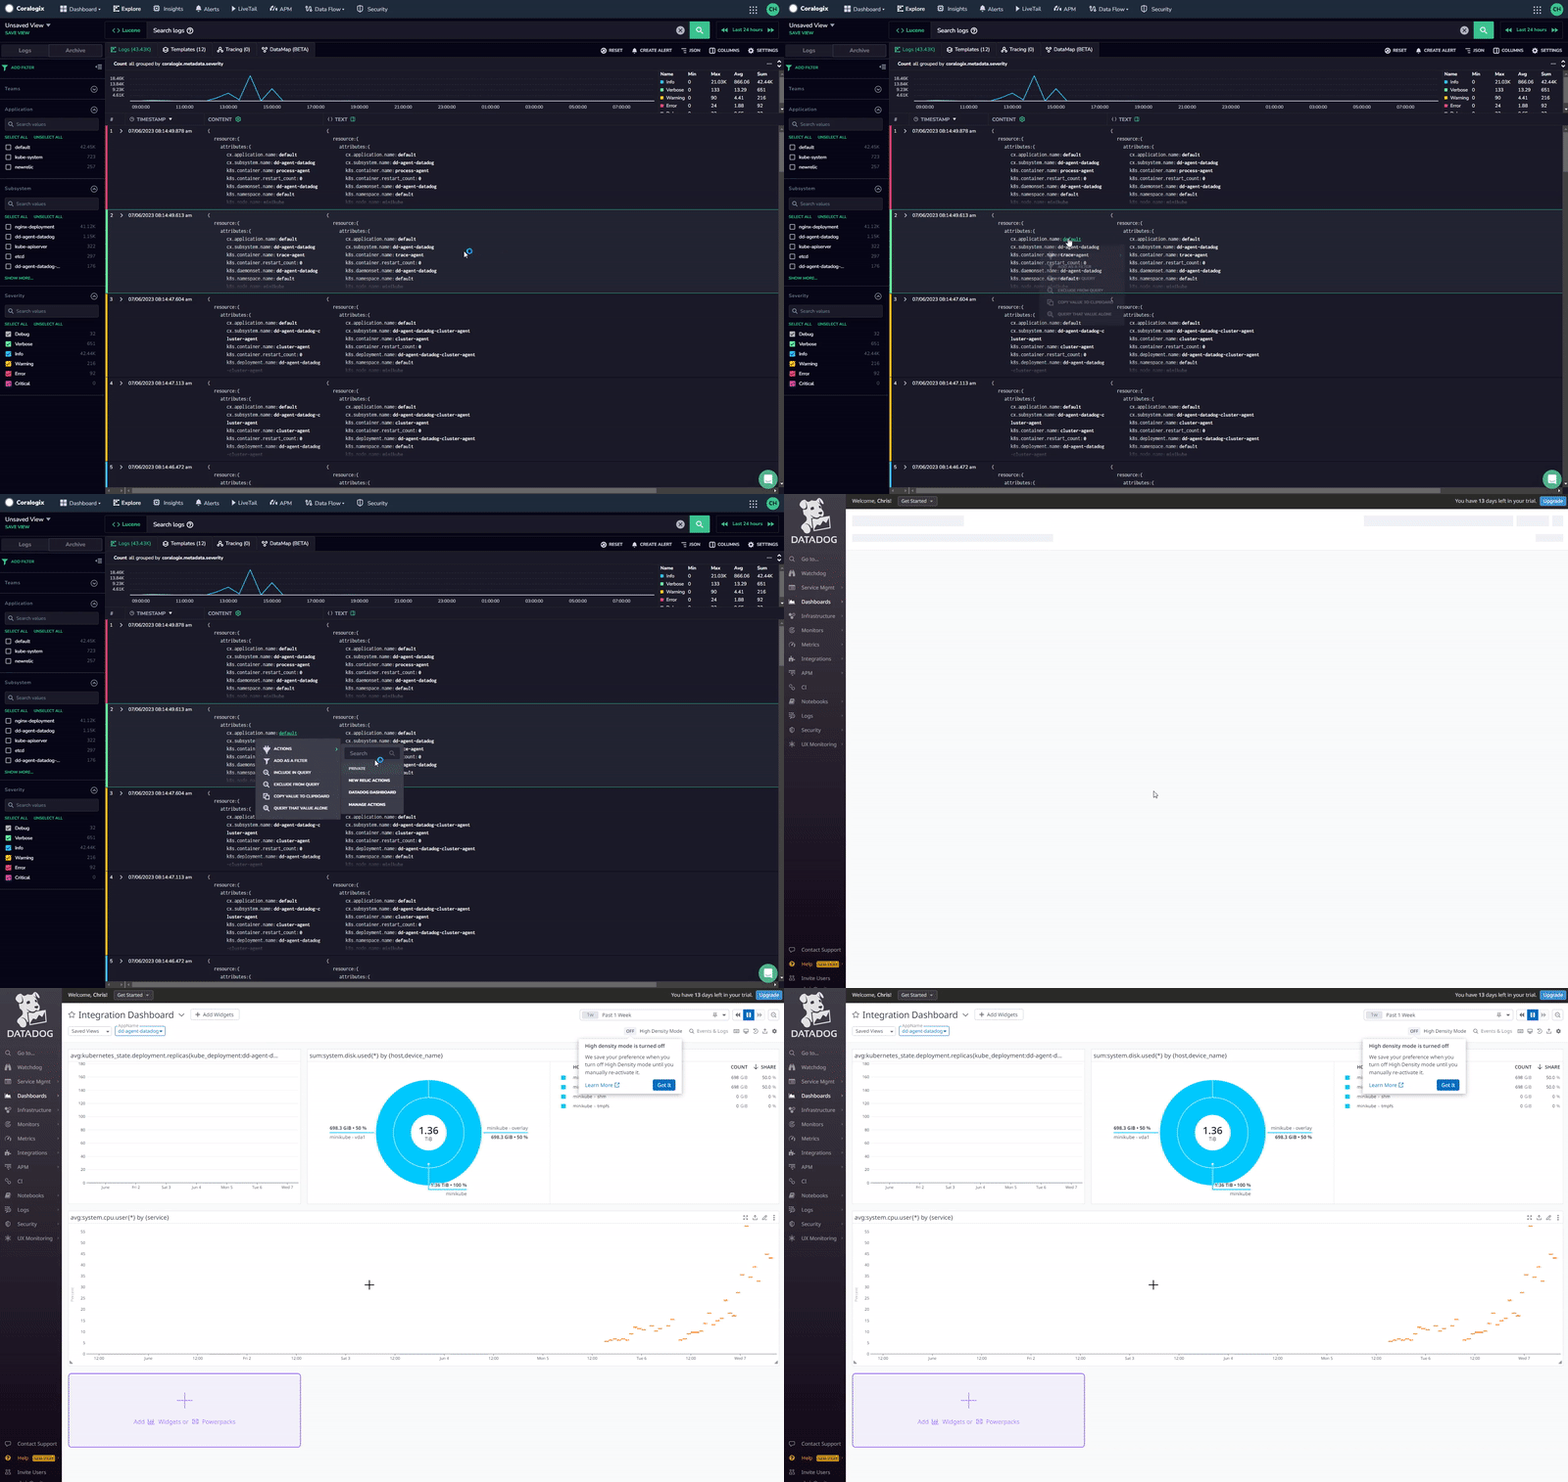
A customer may host their logs in Coralogix, but have their infrastructure metrics in DataDog. Normally, this would lead to a fragmented and confusing debugging process, however Coralogix makes this hybrid process easy. 

Using custom actions, Coralogix customers can easily connect multiple solutions together, with one click integrations. This encourages a true multi-vendor strategy and makes it as easy as possible to get the greatest possible benefit from every tool for which your organization is paying. 

Connecting Coralogix metrics to New Relic infrastructure monitoring

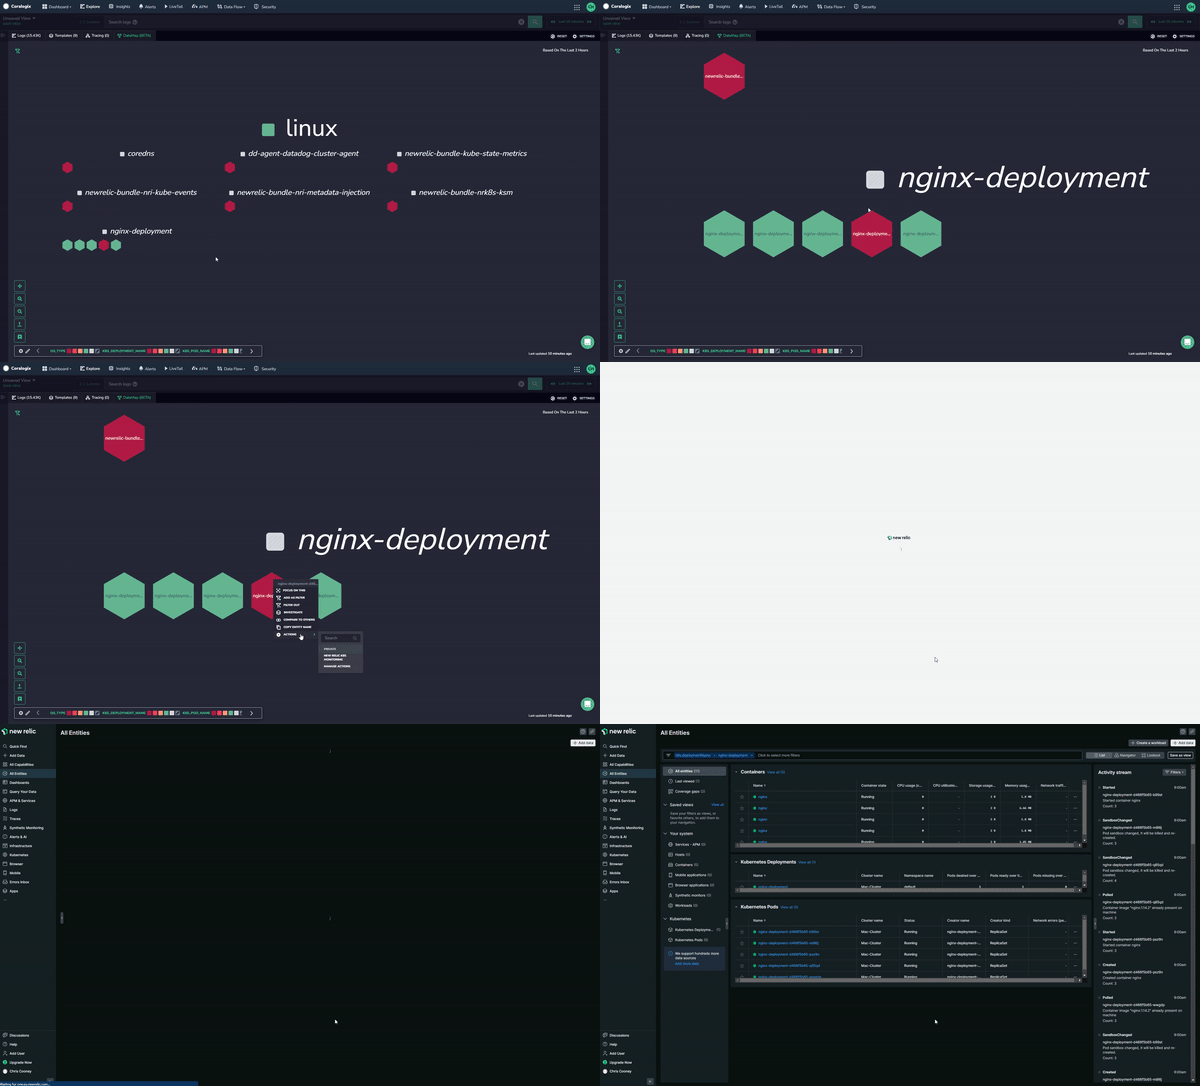
Metrics can also be connected using Coralogix’s custom actions. Customers can define simple integrations from their metrics views, like DataMap, and instantly jump to any other view they want. For example, to the Infrastructure and Kubernetes monitoring in New Relic.

Coralogix. Ready for anything, open to everyone.

At Coralogix, we don’t believe in locking our customers in, whether that’s with proprietary agents, custom data formats or obscure pricing. Instead, we favor open source integrations, use open source data formats and have the most effective pricing model on the market

That also goes for our integrations. Coralogix boasts a comprehensive featureset, processing logs, metrics, traces and security data. You can also convert that into tailored infrastructure monitoring, custom dashboards, data transformation pipelines and much more.

Our goal is to provide a seamless experience for all of our customers, giving them the tools they need to solve any problem along the way. Coralogix doesn’t just integrate cleanly with open source tooling. Our custom actions integrate with competitors’ platforms to keep your observability workflow smooth.  

Common Pitfalls in Maintaining Speed of Software Development

Google is known for giving developers difficult and quirky brain teasers during the hiring process. They’re specifically designed to filter out all but the top 1% of coders with the ability to solve complex programming problems.

In the 2013 film, The Internship, Owen Wilson and Vince Vaughan pit their wits against Google’s hiring manager for a chance to win one of Google’s coveted internships. They had to work out how to escape from a blender if they’d been shrunk down to the size of flies and put inside.  To this, Owen Wilson responded, “physics scares me.” He was not what you might call a 10x dev.

The Mythical 10x Dev

Techpedia defines a 10x dev as “an individual who is thought to be as productive as 10 others in his or her field. The 10x developer would produce 10 times the outcomes of other colleagues, in a production, engineering or software design environment.” It’s not hard surprising that every company wants to attract and hire these programmers.

A development team made of these mythical coding unicorns should be able to outperform average development teams by an order of magnitude, potentially leading to massive profits. There’s just one problem with building a business plan around this, it’s completely unreasonable. Regardless, the productivity of a software team is much more contingent on effective practices and culture than any individual’s abilities. Let’s explore this a bit.

Tar Pits of Code

IBM manager Fred Brooks painted a nightmare picture of how software development could go wrong in his essay The Tar Pit. Tar pits around the world contain the bodies of mammoths and sabre-toothed tigers who blundered in, only to find the tar was a death trap; the more fiercely they struggled to escape, the deeper they sank.

Brookes’ analogy was as pointed as it was chilling. An unavoidable by-product of large software projects is system complexity. He theorized that such projects are like tar pits and programmers working on them are in constant danger of being trapped within them. It doesn’t matter how quick they are at solving problems, the rot eventually sets in and development slows to a snail pace.

A Tale of Two Companies

About a year ago, I was entrenched in one of Brooks’ tar pits. It was a small software company who had built their codebase on a sturdy – if a little old fashioned – Java tech stack. On the business side they had some respectable clients, who paid them a lot of money. Not only were they keeping the lights on, there was cold beer in the fridge. Unfortunately, this picture of paradise crumbled as soon as anyone tried to do any actual coding. 

There was no documentation (the resident 10x devs hadn’t written any), and unit test coverage for the entire codebase was less than 5% (because those same 10x devs didn’t know how to do TDD). The codebase was a monolith application, so to test any changes – even one line of code – you had to build the entire application and deploy it.

To top it off there was only one development server. Whenever anyone wanted to deploy a code change, for any reason, they had to holler “deploy to dev” to the entire room and wait for the entire room to give the ok (who said coding wasn’t a spectator sport?).

As a result, productivity was low, very low. Developers with Masters degrees in computer science were writing ten lines of code a day. The rest of their time was spent reading code or reading the server logs. When I was at that company, I couldn’t program my way out of a wet paper bag.

In contrast to this previous experience, I’m now working at a start-up which markets healthcare apps. I’m working entirely remotely, becoming familiar with an entirely new system on the job. The only other guy I talk to is my boss, and communication channels are limited to Slack and Zoom. And I’m doing fine.

There’s no documentation yet but that doesn’t bother me. Firebase enables me to deploy my code with a single command while Node lets me fire it up on my laptop. Chrome dev tools gives me real-time feedback on what my system is doing, meaning I’ve got observability in spades.

What it Takes to Maintain Speed of Software Development

For me, the moral of the previous tale is that tooling and processes matter. Developers often think that their expert knowledge enables them to make even the most cumbersome tools pay dividends. The 2019 State of DevOps report busts this myth, showing that user-friendly tools and processes are just as important for pro devs as they are for end users.

Tooling Up

The fastest software teams use off-the-shelf systems that can be easily learned and require little customization. Developers in these teams can take their toolchain for granted and focus all their efforts on what Martin Fowler called “strategic” software. This is code that enhances the product and makes money for the company.

The explosion in serverless computing, containerisation, and automated pipelines has provided a plethora of commercially available tools for painless feature integration and deployment. State of DevOps findings show 92% of the highest performing software teams use automated build tools. In 2020, there is a wealth of CI/CD pipeline solutions, the most popular being Jenkins, Azure DevOps Services and CircleCI.

Accessible Knowledge Bases

The State of DevOps also found that easy internal and external search improved productivity. Internal search covers documentation, ticketing systems and easily navigable company codebases. External search includes Google and go-to sites like Stack Overflow. Good documentation and efficient project management frameworks, mediated by tools like Confluence and JIRA, increase developer productivity by over 70%.

Trust and Respect

A final point is psychological safety. Developers solve problems most effectively when they are working with people they can trust and respect. Like Thor and his hammer, a dev with the right tools can move the world.
Delivery vs. Quality – Why not both?

Previously, we talked about the huge amount of time that software developers spend on maintenance. In this post we will try to give some advice on how to tackle this issue, save time and improve customer satisfaction.

[ssf id=298592458] 

It turns out you spend approximately 75% of your time debugging your code, fixing production problems and trying to understand what the hell went wrong this time. But how can you drastically reduce this time consumer you ask? The typical answers such as ‘write more unit tests’, ‘do better code reviews’, ‘stick to code conventions’ or simply ‘hire better developers’ are obvious and I’m not sure I can say anything you didn’t know about them. What we’d like to elaborate in this post is how you can reduce these 75% in a big way with minimal effort on your side. The short answer is Log Analytics. The long answer is elaborated below.

It’s obvious you have a deadline and that no one will give you the time needed to write the quality code you’d like to produce. It is also obvious that no one will accept a buggy code that will crash on production. This is exactly the fine balance you need to find between delivery and quality – a never ending story. Among the obvious methods to deliver quality code on time, one method remained unchanged for almost 30 years: log entries in your code. If you have a working production system, chances are you have thousands of log entries emitted from your system each second, and once you encounter a problem you browse through these logs in order to figure out what went wrong. Now let’s raise two questions: do you write quality log entries that really help you solve your bugs? And how can you understand the cause of problems from your logs without wasting hours on text search and graph analysis?

Regarding the first question, you know you are writing quality logs when you can actually understand the story of what your system does from your log records alone. This is not the case if you only log exceptions or problematic end-cases, because once a problem occurs you have no idea why it happened. You just know it did. On the other hand, you don’t want to clutter your log files with irrelevant information – for example logging a method which is called every 2 milliseconds. Writing quality logs does not take a lot of effort, but you do need to follow a few basic rules of thumb:

Write real sentences in the text message (so you can understand what you meant to log)
Use metadata which will help you filter and understand what this log entry is all about (severity, category, class name, method name, etc..)
Don’t be lazy – write enough logs which will tell you the story of your system
These will go a long way once you try to solve real problems in the field.

Regarding the second question – how to avoid bleeding your eyes out while reading your logs – even if you are writing super informative logs, most often than not, you are cluttered by them: Production systems create anywhere between 3-50 GB of logs per day. We are talking about ~80M log records per day. Try to understand a problem’s cause from this mass amount of information, and you are lost.

To tackle this ever growing problem, many Log Analytics companies are rising to the challenge and are trying to make your (truly Big Data) logs searchable and accessible. These companies provide the tools to search your data for specific keywords, define conditions for receiving alerts on suspicious cases, provide a single point repository for all your log data and provide cool graphs to show different trends.

The next challenge Log Analytics companies need to tackle, other than the feats they provide today, is to actually make sense out of your log entries, and provide an automatic manner to find the smoking gun that caused your problem. Looking even further into the future, these companies would love to offer actionable solutions to the problem you encounter, and let their algorithms do the frustrating work you do today.

With growing attention and advances in Big Data analytics, we assume we’ll see a growing number of Log Analytics platforms going to that direction in the next few years.