When your Elasticsearch cluster ingests data, it needs to understand how the data is constructed. To do this, your Elasticsearch cluster undergoes a process called mapping. Mapping involves defining the type for each field in a given document. For example, a number or a string of text. But how do you know the health of the mapping process? And why do you need to monitor it? This is where mapping statistics come in.
Mapping statistics give you an overall view of the mapping process. For example, this includes the number of fields that have been mapped, the mapping exceptions, and errors that have occurred. These statistics are essential to ensure your cluster is working as well as possible.
What is mapping?
Different data types can be queried in different ways. Elasticsearch has a myriad of optimizations under the hood for the different data types that it stores. Elasticsearch indexes the field and its data type so that when you are querying for that field, it knows how to handle it. It does this in two different ways.
1. Dynamic Mapping to automatically create Mapping Fields
When Elasticsearch ingests a document with fields that it has not seen before, it will attempt to automatically detect the type of that field. This is great when you’re just starting out with the data. You can explore and learn about the information you have in your cluster. As soon as Elasticsearch indexes the document, it automatically adds new fields.
If you need to customize the dynamic mapping process, you can do this with dynamic templates. These templates tell Elasticsearch to apply mappings for specific fields that have been dynamically added. This can be useful when you’ve got lots of new fields, and some simple rules will ensure they are mapped correctly.
Explicit Mapping to specify the correct Elasticsearch datatype
When the default behavior for mapping is not what you want, you can be more surgical with the mapping process. Explicit mapping allows you to go in and change the mappings for each field. This is especially useful when you need to state things like the format of a date string.
Mapping Explosions and Errors
As with all things, there is a limit to these features. Firstly, when you have a lot of mutable data, Elasticsearch will attempt to index too many fields as part of the mapping process. Secondly, if a field changes its type, this is going to cause errors because Elasticsearch already has a copy of a field in one type and is attempting to ingest it in another. So how do you manage and fix these issues?
The Mapping Fields Limit
Out of the box, Elasticsearch allows you to index 1000 fields in your mappings. This limit is in place to ensure that your index size remains at an optimal level. With too many mappings, you will slow down your query speed. The mapping statistics available in the Elasticsearch API can tell you how close you are to this limit, and you can reconfigure Elasticsearch to allow for more mappings. You should note, that increasing this limit can have unintended side effects. Proceed with caution!
Mapping Exceptions Count
Mapping exceptions occur when Elasticsearch is not able to map a given field. This will greatly impact query performance and cause errors every single time this field is ingested by the cluster, if that field has now changed. This most commonly happens when a field has changed from one type to another (for example, a numeric value to a string). We’ve written all about mapping exceptions to help you better understand how to prevent this from happening in the future. Mapping exceptions are a fundamental part of your mapping statistics that will let you know as soon as something is wrong with a document. With this level of visibility, you’ll be able to trace the source and either fix the information or reindex your documents as needed.
Summary
Your mapping statistics are an essential ingredient in your Elasticsearch monitoring. Engineering and DevOps teams will almost always focus on the obvious metrics, like CPU, memory, network, and so on. These alerts can differentiate between a perfectly functioning cluster and a broken system.
Optimizing your Elasticsearch cluster is a complex task that can be very time-consuming. If these kinds of operational concerns are a distraction from the core goals of your business, you may wish to outsource your logging and metrics to a SaaS solution. A great solution is Coralogix, with machine learning, complex alerting, and much more that will help you scale your technology as you scale your ambitions.
Security is a top-of-mind topic for software companies, especially those that have experienced security breaches. This article will discuss how to set up Elasticsearch audit logging and explain what continuous auditing logs track.
Alternatively, platforms can use other tools like the cloud security platform offered by Coralogix instead of internal audit logging to detect the same events with much less effort.
Companies must secure data to avoid nefarious attacks and meet standards such as HIPAA and GDPR. Audit logs record the actions of all agents against your Elasticsearch resources. Companies can use audit logs to track activity throughout their platform to ensure usage is valid and log when events are blocked.
Elasticsearch can log security-related events for accounts with paid subscriptions. Elasticsearch audit provides logging of events like authentications and data-access events, which are critical to understanding who is accessing your clusters, and at what times. You can use machine learning tools such as the log analytics tool from Coralogix to analyze audit logs and detect attacks.
Turning on Audit Logging in Elasticsearch
Audit General Settings
Audit logs are off by default in your Elasticsearch node. They are turned on by configuring the static security flag in your elasticsearch.yml (or equivalent .yml file). Elasticsearch requires this setting for every node in your cluster.
xpack.security.audit.enabled=true
Enabling audit logs is currently the only static setting needed. Static settings are only applied, or re-applied, to unstarted or shut down nodes. To turn on Elasticsearch audit logs, you will need to restart any existing nodes.
Audit Event Settings
You can decide what events are logged on each Elasticsearch node in your cluster. Using the events.include or events.exclude settings, you can decide which security events Elasticsearch logs into its’ audit file. Using _all as your include setting will track everything. The exclude setting can be convenient when you want to log all audit event types except one or two.
You can also decide if the request body that triggered the audit log is included in the audit event log. By default, this data is not available in audit logs. If you need to audit search queries, use this setting, so the queries are available for analysis.
Ignore policies allow you to search for audit events that you do not want to print. Use the policy_name value to link configurations together and form a policy with multiple settings. Elasticsearch does not print events that match all conditions in a policy.
Each of the ignore filters uses a list of values or wildcards. Values are known data for the given type.
Information about the node can be included in each audit log event. Each of the following settings is used to turn on one of the pieces of information that are available. By default, all are excluded except the node id value. Optional node data includes the node name, the node IP address, the node’s host name, and the node id.
Elasticsearch audit events are logged into a single JSON file. Each audit event is printed on a single line with no end-of-line delimiter. The format of the file is similar to a CSV in that it was meant to have columns. There are fields within it that follow JSON formatting with an ordered dot notation syntax containing any non-null string. The purpose was to make the file more easily readable by people as opposed to machines.
An example of an Elasticsearch audit log is below. In it, there are several fields that are needed for analysis. For a complete list of the audit logs available, see the Elasticsearch documentation.
The event.type attribute shows the internal layer that generated the audit event. This may be rest, transport, ip_filter, or security_config_change. The event.action attribute shows what kind of event occurred. The actions available depend on the event.type value, with security_config_change types having a different list of available actions than the others.
The origin.address attribute shows the IP address at the source of the request. This IP address may be of the remote client, the address of another cluster, or the local node. In cases where the remote client connects to the cluster directly, you will see the remote IP address here. Otherwise, the address is listed with the first OSI layer 3 proxy in front of the cluster. The origin.type attribute shows the type of request made originally. This could be rest, transport, or local_node.
Where Elasticsearch Stores Audit Logs
A single log file is created for each node in your Elasticsearch cluster. Audit log files are written only to a local filesystem to keep the file secure and ensure durability. The default filename is <clustername>_audit.json.
You can configure Filebeat in the ELK stack to collect events from the JSON file and forward them to other locations, such as back to an Elasticsearch index or into Logstash. Filebeat replaced the older model of Elasticsearch, where audit logs were sent directly to an index without queuing. This model caused logs to be dropped if the index rate of the audit log index was lower than the rate of incoming logs.
This index ideally will be on a different node and cluster than where the logs were generated. Once the data is in Elasticsearch, it can be viewed on a Kibana audit logs dashboard or sent to another source such as the Coralogix full-stack observability tool, which can ingest data from Logstash.
Configuring Filebeat to Write Audit Logs to Elasticsearch
After the Elasticsearch audit log settings are configured, you can configure the Filebeat settings to read those logs.
Optionally customize the audit log paths in the elasticseach.yml file within the modules.d folder. This is necessary if you have customized the name or path of the audit log file and will allow Filebeat to find the logs.
Specify the Elasticsearch cluster to index your audit logs. Add the configuration to the output.elasticsearch section of the filebeat.yml file
Start Filebeat
Analysis of Elasticsearch Audit Logs
Elasticsearch audit logs hold information about who or what is accessing your Elasticsearch resources. This information is required for compliance through many government information standards such as HIPAA. In order for the data to be useful in a scalable way, analysis and visualization are also needed.
The audit logs include events such as authorization successes and failures, connection requests, and data access events. They can also include search query analysis when the emit_request_body setting is turned on. Using this data, professionals can monitor the Elasticsearch cluster for nefarious activity and prevent data breaches or reconstruct events. The completeness of the event type list means that with the analysis you can follow any given entity’s usage on your cluster.
If automatic streaming is available from Logstash or Elasticsearch, audit logs can be sent to other tools for analysis. Automatic detection of suspicious activity could allow companies to stop data breaches. Tools such as Coralogix’s log analysis can provide notifications for these events.
How does Coralogix fit in?
With Coralogix, you can send logs with our log analytics tool. This tool uses machine learning to find where security breaches are occurring in your system. You can also set up the tool to send notifications when suspicious activity is detected.
In addition, the Coralogix security platform allows users to bypass the manual setup of Elasticsearch audit logging by detecting the same access events. This platform is a Security as Code tool that can be linked directly to your Elasticsearch cluster and will automatically monitor and analyze traffic for threats.
Summary
Elasticsearch audit logs require a paid Elasticsearch subscription and manual setup. The logs will track all requests made against your Elasticsearch node and log them into a single, locally stored JSON file. Your configuration determines what is and is not logged into the audit file.
Your locally-stored audit file was formatted with the intention of being human-readable. However, reading this file is not a scalable or recommended security measure. You can stream audit logs to other tools by setting up Filebeat.
Elastic made their latest minor Elasticsearch release on May 25, 2021. Elasticsearch Version 7.13 contains the rollout of several features that were only in preview in earlier versions. There are also enhancements to existing features, critical bug fixes, and some breaking changes of note.
Three more patches have been released on the minor version, and more are expected before releasing the next minor version.
A quick note before we dive into the new features and updates: The wildcard function in Event Query Language (EQL) has been deprecated. Elastic recommends using like or regex keywords instead.
Users can find a complete list of release notes on the Elastic website.
New Features
Combined Fields search
The combined_fields query is a new addition to the search API. This query supports searching multiple text fields as though their contents were indexed in a single, combined field. The query automatically analyzes your query as individual terms and then looks for each term in any of the requested fields. This feature is useful when users are searching for text that could be in many different fields.
Frozen Tier
Elastic defines several data tiers. Each tier is a collection of nodes with the same role and typically the same hardware profile. The new frozen tier includes nodes that hold time-series data that are rarely accessed and never updated. These are kept in searchable snapshots. Indexed content generally starts in the content or hot tiers, then can cycle through warm, cold, and frozen tiers as the frequency of use is reduced over time.
The frozen tier uses partially mounted indices to store and load data from a snapshot. Storage and operating costs are reduced by this storage method but still allows you to search the data, albeit with a slower response. Elastic improves the search experience by retrieving minimal data pieces necessary for a query. For more information about the Frozen tier and how to query it, see this Elastic blog post.
IPv4 and IPv6 Address Matching
Painless expressions can match IPv4 and IPv6 addresses automatically against Classless Inter-Domain Routing (CIDR) ranges. When a range is defined, you can use the painless contains script to determine if the input IP address falls within the range. This is very useful for grouping and classifying IP addresses when using Elastic for security and monitoring.
Index Runtime Fields
Runtime fields are fields in your document that are formed based on the source context. These fields can be defined by the search query or by the index mapping itself. Defining the field in the index mapping will give better performance.
Runtime fields are helpful when you need to search based on some calculated value. For example, if you have internal error codes, you may want to return specific text related to the code. Without storing the associated text, a runtime field can be used to translate a numerical code to an associated text string with a runtime field.
Further, the runtime can be updated by reindexing the document with a newly formed runtime field. This makes updating much more straightforward than having to update each document with new text.
Aliases for Trained Models
Aliases for Elasticsearch indices have been present since version 1. They are a convenient way to allow functions to point to different data sets independent of the index name. For example, you may wish to have versions of your index. Using an alias, you can always fetch whatever version of the data has a logical value by assigning it an alias.
Aliases are now also available for trained models. Trained models are machine learning algorithms that have been run against a sample set. The existing, known data have trained the output algorithm to give some output. This algorithm can then be applied to new, unknown data, theoretically classifying it in the same way expected for known data. Standard algorithms may include classification analysis or regression analysis.
Elastic now allows you to apply an alias to your trained models like you could already do for indices. The new model_alias API, allows users to insert and update aliases on your trained models. This alias can make it easier to apply specific algorithms for data sets by allowing users to logically alias the machine learning algorithms.
Fields added to EQL search
Event Query Language (EQL) is a language explicitly used for searching event time-based data. Typical uses include log analytics, time-series data processing, and threat detection.
In Elasticsearch 7.13.0, developers added the fields parameter as an alternative to the _source parameter. The fields option extracts values from the index mapping while _source accesses the original data sent at index time. The fields option is recommended by Elastic because it:
returns values in a standardized way according to its mapping type,
accepts both multi-fields and field aliases,
formats dates and spatial types according to inputs,
returns runtime field values, and
can also return fields calculated by a script at index time.
Log analytics on Elastic can be tricky to set up. Third-party tools, like Coralogix’s log analytics platform, exist to help you analyze data without any complex setup.
Audit Events Ignore Policies
Elasticsearch can log security-related events if you have a paid subscription account. Audit events provide logging of different authentication and data access events that occur against your data. The logs can be used for incident responses and demonstrating regulatory compliance. With all the events available, the logs can bog down performance due to the volume of logs and amount of data.
In Elastic Version 7.13, Elastic introduced audit events ignore policies, so users can choose to suppress logging for certain audit events. Setting the ignore policies involves creating rules with match audit events to ignore and not print.
Enhancements
Performance: Improved Speed of Terms Aggregation
The terms aggregation speed has been improved under certain circumstances. These are common to time series and particularly when the data is in cold or frozen storage tiers. The following are cases where Elastic has improved aggregation speed:
The data has no parent or child aggregations
The indices have no deleted documents
There is no document-level security
There is no top-level query
The field has global ordinals (like keyword or ip field)
There are less than a thousand distinct terms.
Security: Prevention of Denial of Service Attack
The Elasticsearch Grok parser contained a vulnerability that nefarious users could exploit to produce a denial of service attack. Users with arbitrary query permissions could create Grok queries that would crash your Elasticsearch node. This security flaw is present in all Elasticsearch versions before 7.13.3.
Bug Fixes
Default Analyzer Overwrites Index Analyzer
Elasticsearch uses analyzers to determine when a document matches search criteria. Analyzers are used to search for text fields in your index. In version 7.12, a bug was introduced where Elasitcsearch would use the default analyzer (a standard analyzer) on all searches.
According to documentation, the analyzer configured in the index mapping should be used, with the default only being used if none was configured. In version 7.13, this bug was fixed, so the search is configured to use the index analyzer preferentially.
Epoch Date Timezone Formatting with Composite Aggregations
Composite aggregations are used to compile data into buckets from multiple sources. Typical uses of this analysis would be to create graphs from a compilation of data. Graphs may also include time as a method to collect data into the same set. If the user required a timezone to be applied, Elasticsearch behaved incorrectly when stored times were Epoch.
Epoch datetimes are always listed in UTC. Applying a timezone requires formatting the date which was not previously applied internally in Elasticsearch. This bug was resolved in version 7.13.3
Fix Literal Projection with Conditions in SQL
SQL queries can use literal selections in combination with filters to select data. For example, the following statement uses a literal selection genre and a filter record:
SELECT genre FROM music WHERE format = ‘record’
Elasticsearch was optimizing to use a local relation in error. This error caused only a single record to be returned even if multiple records match the filter. Version 7.13.3 fixed this issue which was first reported in November 2020.
Summary
Elastic pushed up many new features, bug fixes, and enhancements in version 7.13 and has continued to apply small changes through version 7.13.3. The significant new features of note support a frozen storage tier, including ignoring policies for audit events and index runtime fields.
Elasticsearch is a distributed search and analytics engine used for real-time data processing of several different data types. Elasticsearch has built-in processing for numerical, geospatial, and structured text values.
Unstructured text values have some built-in analytics capabilities, but custom text fields generally require custom analysis. Built-in text analysis uses analyzers provided by Elasticsearch, but customization is also possible.
Elasticsearch uses text analysis to convert unstructured text data into a searchable format. Analyzers and normalizers can be user-configurable to ensure users get expected search results for custom, unstructured text fields.
What is text analysis, and why is it important?
Text analysis provided by Elasticsearch makes large data sets digestible and searchable. Search engines use text analysis to match your query to thousands of web pages that might meet your needs.
Typical cases of text search in Elasticsearch include building a search engine, tracking event data and metrics, visualizing text responses, and log analytics. Each of these could require unstructured text fields to be gathered logically to form the final data used.
Elasticsearch has become a go-to tool for log storage since microservices have become popular. It can serve as a central location to store logs from different functions so that an entire system can be analyzed together.
You can also plug Elasticsearch into other tools that already have metrics and analytics set up to skip the need to do further analysis with your Elasticsearch query results. Coralogix provides an Elastic API to ingest Elasticsearch data for this purpose.
What is an Elasticsearch Analyzer?
An analyzer in Elasticsearch uses three parts: a character filter, a tokenizer, and a token filter. All three together can configure a text field into a searchable format. The text values can be single words, emails, or program logs.
Character Filter
A character filter will take the original text value and look at each character. It can add, remove or change characters in the string. These changes could be useful if you need to change characters between languages that have different alphabets.
Analyzers do not require character filters. You may also want to have multiple analyzers for your text which is allowed. Elasticsearch applies all character filters available in the order you specify.
Tokenizer
A token is a unit of text which is then used in searches. A tokenizer will take a stream of continuous text and break it up into tokens. Tokenizers will also track the order and position of each term in the text, start and end character offsets, and token type.
Position tracking is helpful for word proximity queries, and character offsets are used for highlighting. Token types indicate the data type of the token (alphanumeric, numerical, etc.).
Elasticsearch provides many built-in tokenizers. These include different ways to split phrases into tokens, partial words, and keywords or patterns. See Elasticsearch’s web page for a complete list.
Elasticsearch analyzers are required to use a tokenizer. Each analyzer may have only a single tokenizer.
Token Filter
A token filter will take a stream of tokens from the tokenizer output. It will then modify the tokens in some specific way. For example, the token filter might lowercase all the letters in a token, delete tokens specified in the settings, or even add new tokens based on the existing patterns or tokens. See Elasticsearch’s web page for a complete list of built-in token filters.
Analyzers do not require token filters. You could have no token filters or many token filters that provide different functionality.
What is an Elasticsearch Normalizer?
A normalizer works similarly to analyzers in that it tokenizes your text. The key difference is that normalizers can only emit a single token while analyzers can emit many. Since they only emit one token, normalizers do not use a tokenizer. They do use character filters and token filters but are limited to using those that work at a single character at a time.
What happens by default?
Elasticsearch applies no normalizer by default. These can only be applied to your data by adding them to your mapping before creating your index.
Elasticsearch will apply the standard analyzer by default to all text fields. The standard analyzer uses grammar-based tokenization. Words in your text field are split wherever a word boundary, such as space or carriage return, occurs.
Example of Elasticsearch Analyzers and Normalizers
Elasticsearch provides a convenient API to use in testing out your analyzers and normalizers. You can use this to quickly iterate through examples to find the right settings for your use case.
Inputs set up custom analyzers or normalizers, or you can use the current index configurations to test them out. Some examples of analyzers and normalizers are provided below to show what can be done in Elasticsearch. Outputs show what tokens are created with the current settings.
HTML Normalizers
Use the HTML Strip character filter to convert HTML text into plain text. You can optionally combine this with the lowercase token filter to not consider the casing in your search. Note that normalizers only output a single token using the filter and char_filter settings.
Email Analyzers
Use the built-in email tokenizer to create a token with type <EMAIL>. This can be useful when searching large bodies of text for emails. The following example shows an email token is present when only an email is used in the text. However, the same token is found when the email input is surrounded by other text. In that case, multiple tokens are returned, one of them being the email.
An Email analyzer can also be made with a custom filter. The filter in the following example will split your data on specific characters common to email addresses. This principle can be applied to any data with common characters or patterns (like data logs). A token is created for each section of text divided by the regex characters described in the filter.
Summary
Elasticsearch analyzers and normalizers are used to convert text into tokens that can be searched. Analyzers use a tokenizer to produce one or more tokens per text field. Normalizers use only character filters and token filters to produce a single token. Tokens produced can be controlled by setting requirements in your Elasticsearch mapping.
Elasticsearch indices become readily searchable when analyzers are appropriately used. A common use-case for Elasticsearch is to store and analyze console logs. Elasticsearch indices can be imported by tools like Coralogix’s log analytics platform. This platform can take logs stored in your index and convert them into user-readable and actionable insights that allow you to support your system better.
Consider for a moment that you are building a webpage that displays data stored in Elasticsearch. You have so much information in your index that your API Gateway cannot handle it all at once. What you’ll need to do is paginate your results so that the client can have a predictable amount of data returned each time.
Before paginating your results with your client, you will need to know how to paginate data in your backend storage. Most data storage solutions include functions enabling users to sort, filter, and paginate data. Elasticsearch is no different.
Your requirements and data structure will be crucial in deciding which method best suits your needs. Elasticsearch provides three ways of paginating data that are each useful:
From/Size Pagination
Search After Pagination
Scroll Pagination
Let’s look at how these different types of pagination work:
From/Size Pagination
This Elasticsearch query shows how you can get the third page of data using from/size pagination. Assuming all the pages are 25 documents long, this search will return documents starting at the 50 and going to the 75.
The example below uses Elasticsearch’s search API that will look at all documents in the index. You could also filter or sort the records to keep the results consistent for viewing.
The simplest method of pagination uses the from and size parameters available in Elasticsearch’s search API. By default, from is 0 and size is 10, meaning if you don’t specify otherwise, Elasticsearch will return only the first ten results from your index.
Change the from and size input values to get different pages of data. The from variable represents which document will start the page, and the size variable describes how many documents your search will return.
Great for Small Data Sets
If you have a large data set (more than 10,000 documents), from/size pagination is not ideal for you. You can use this up to 10,000 records without changes, and you can also increase this window to a higher number if you choose.
However, this value is used as a safeguard to protect against degraded performance or even failures. Elasticsearch must load all the data from the requested documents and any documents from previous pages behind the scenes. These documents can span multiple shards in your Elasticsearch cluster as well. As you get deeper into your data set, the operations must grow in size, causing issues.
May Miss Returning Documents
If you have a constantly or unpredictably changing dataset, you do not want to use this Elasticsearch pagination method to return all data. When you update a document, Elasticsearch will reindex it, potentially causing a change in documents’ order.
The addition or removal of a document will also change which hits are adjacent in the index. Since from/size pagination relies on documents’ location in an index, the reordering will mean returning duplicates of some documents and missing others. If you are displaying data on your webpage, the pages won’t always contain the same data, leading to a poor user experience.
Scroll Pagination
To perform scroll pagination, you must first perform a search using Elasticsearch’s search API. The first search includes a parameter indicating that a scroll will take place. The results will include a ‘scroll_id’ along with the results of the search request.
Send subsequent calls to a different Elasticsearch API called scroll. The input only includes the scroll_id and an optional time to keep the scroll index alive. This scroll will get the next page of data and return new scroll_id values as long as there are more pages to collect.
POSThttps://localhost:9200/_search/scroll{"scroll":"5m","Scroll_id":"scroll_id string returned from search"}
Preserves the Index State While You Search
The benefit to using scroll over From/size pagination is scroll’s ability to freeze or preserve the index in time for your search. The scroll API’s response includes a scroll_id. Subsequent calls to the search API use that identifier, so Elasticsearch returns only document versions existing when the scroll initialization occurred.
Freezing the index version fixes the issue seen in from/size pagination that can cause developers to miss data in their index.
Uses Significant Memory Resources
Background processes in Elasticsearch will merge smaller segments into larger ones to keep the index number relatively small. Elasticsearch deletes smaller segments after merging, and once the smaller segments are not needed. Open scrolls will block the smaller segments’ deletion since they are used to return the scroll data. Developers need to ensure they have adequate free file handles and disk space to support using the scroll API.
Elasticsearch must track which documents exist to return your data’s correct version when you use the scroll API. Saved versions are stored in the search context and need heap space. Elasticsearch sets a maximum number of open scrolls to prevent issues from arising with too many open scrolls. However, you will still need to ensure you manually close scrolls or allow them to timeout and delete automatically to preserve heap space.
Get All Documents From an Extensive Index
If you are doing some processing that requires you to get each document, the scroll API is an acceptable option. You will be able to loop through each document in your index and have confidence Elasticsearch will return all the existing documents.
Scroll pagination does not limit the number of documents like from/size pagination so that you can get more than the 10,000 document limit. Ensure you set a short timeout for your scroll, or manually remove it after your processing is complete to avoid memory issues.
Good Choice for AWS Elasticsearch Users
AWS’s integration with Elasticsearch only supports up to version 7.9. The now-recommended search_after using point-in-time integrations is a new feature available on Elasticsearch version 7.10.
Since the recommended Elasticsearch pagination method is not available, AWS users should use scroll instead since it was the recommended method for lower versions.
search_after Pagination
Two versions of search_after pagination exist. Both have similar requirements for the body of the search: the sort input is required. When you use a sort array in the input to the search API, the results will contain a sort value. This value should be used in the search_after value of the subsequent query to get the next page of results.
The search below shows how to get the second group of 25 hits in an index assuming an integer value testInt exists and is incremented by one in each document.
POST https://localhost:9200/test-index-v1/_search{"size":25,"query":{"match_all":{}},"sort":[{"testInt":"asc"}],"search_after":[25]}
Like with from/size pagination, if the index is refreshed during your search, the order of documents may change, leading to inconsistent viewing of data and possibly skipping over documents. New in Elasticsearch version 7.10 is a point in time (PIT) API to avoid this sissue.
To use it, first request a PIT using the command below. Then, add the returned PIT to your query.
POST https://localhost:9200/test-index-v1/_pit?keep_alive=1m
Use search_after Alone to Paginate Deeply
Use the search API with a sort input to paginate through indices, including those with more than 10,000 records. Use the sort response from the last hit as the search_after input to the next search API call. Elasticsearch will use the search_after input to find the following document in the index and return it first on the next page.
Elasticsearch does not freeze the index with this command. If your data is changing during your search, you may miss documents as you paginate through your index, or your pages will not contain consistent data.
Can Preserve the Index State Using Point In Time API
The point in time (PIT) API is available as of ELK version 7.10. By default, search requests will execute against the most recent data in your index. The PIT API will create a view of the index at a given time, which developers can search.
The PIT API is functionally similar to scroll, but it is much more lightweight, making it preferable to use. Using PIT means your pages will be consistent even if your data changes while you search.
Preferred Method of Pagination
Elasticsearch recommended using search_after with the PIT API for paginated searches that involve more than 10,000 documents and that preserve index state. Before version 7.10, the scroll API was the only method available that could do this. Be aware that AWS’s Elasticsearch implementation does not support Elasticsearch 7.10 yet, so developers will still need to use scroll for now.
Guidelines For Optimizing Elasticsearch Pagination
We have reviewed several limitations of the different available Elasticsearch pagination methods available. Which method you use depends on your requirements and your data.
Do you need to paginate over more than 10,000 documents? If so, you should use search_after or scroll.
Do you need to keep the page contents consistent? If so, use search_after with the point in time API.
Do you need to keep the page contents consistent but do not have access to ELK version 7.10? If so, use the scroll API.
Do you need to support multiple searches at once? If so, you should avoid using scroll because of its high memory requirements.
Developers may use these principles when using a SaaS API to Elasticsearch like Coralogix’s Elastic API. This service allows you to have direct access to your Elasticsearch data, but also integrate tools to analyze and troubleshoot your data.
Metricbeat, an Elastic Beat based on the libbeat framework from Elastic, is a lightweight shipper that you can install on your servers to periodically collect metrics from the operating system and from services running on the server. Everything from CPU to memory, Redis to NGINX, etc… Metricbeat takes the metrics and statistics that it collects and ships them to the output that you specify, such as Elasticsearch or Logstash.
In this post, we will cover some of the main use cases Metricbeat supports and we will examine various Metricbeat configuration use cases.
Metricbeat Installation
Metricbeat installation instructions can be found on the Elastic website.
Metricbeat Configuration
To configure Metricbeat, edit the configuration file. The default configuration file is called metricbeat.yml. The location of the file varies by platform. For rpm and deb, you’ll find the configuration file at this location /etc/metricbeat. There’s also a full example configuration file at /etc/metricbeat/metricbeat.reference.yml that shows all non-deprecated options.
The Metricbeat configuration file uses YAML for its syntax as it’s easier to read and write than other common data formats like XML or JSON. The syntax includes dictionaries, an unordered collection of name/value pairs, and also supports lists, numbers, strings, and many other data types.
All members of the same list or dictionary must have the same indentation level. Lists and dictionaries can also be represented in abbreviated form, which is somewhat similar to JSON using {} for dictionaries and [] for lists. For more info on the config file format.
The Modules configuration section can help with the collection of metrics from various systems.
The Processors section is used to configure processing across data exported by Metricbeat (optional). You can define a processor globally at the top-level in the configuration or under a specific module so the processor is applied to the data collected for that module.
The Output section determines the output destination of the processed data.
There are other sections you may include in your YAML such as a Kibana endpoint, internal queue, etc. You may view them and their different options at the configuring Metricbeat link. Each of the sections has different options and there are numerous module types, processors, different outputs to use, etc…
In this post, I will go over the main sections you may use and focus on giving examples that worked for us here at Coralogix.
Modules
The Modules section defines the Metricbeat input, the metrics that will be collected by Metricbeat, each module contains one or multiple metric sets. There are various module types you may use with Metricbeat, you can configure modules in the modules.d directory (recommended), or in the Metricbeat configuration file. In my examples, I’ll configure the module in the Metricbeat configuration file. Here is an example of the System module. For more info on configuring modules and module types.
#============================= Metricbeat Modules =============================
metricbeat.modules:
- module: system
  metricsets:
    - cpu # CPU usage
    - load # CPU load averages
    - memory # Memory usage
    - network # Network IO
    #- core # Per CPU core usage
    #- diskio # Disk IO
    #- filesystem # File system usage for each mountpoint
    #- fsstat # File system summary metrics
    #- raid # Raid
    #- socket # Sockets and connection info (linux only)
    #- service # systemd service information
  enabled: true
  period: 10s
There are some more options to this module type as you can observe in the full example config file. These are all the available metric sets with the system module type, the enable parameter is optional, by default if not specified it is set to true and the period parameter is setting how often the metric sets are executed. This setting is required for all module types. You may include multiple module types, all in the same YAML configuration. If you are working with Coralogix and wish to send your metrics to your Coralogix account you will have to include the fields parameter with our required fields, this is beside the fact you need to choose our Logstash endpoint in your config output, we will see a similar example later.
Processors
You can use Processors in order to process events before they are sent to the configured output. The libbeat library provides processors for reducing the number of exported fields, performing additional processing and decoding, etc… Each processor receives an event, applies a defined action to the event, and returns the event. If you define a list of processors, they are executed in the order they are defined in the configuration file. This is an example of several processors configured. For more information on filtering and enhancing your data.
# ================================= Processors =================================
# Processors are used to reduce the number of fields in the exported event or to
# enhance the event with external metadata. This section defines a list of
# processors that are applied one by one and the first one receives the initial
# event:
#
# event -> filter1 -> event1 -> filter2 ->event2 ...
#
# The supported processors are drop_fields, drop_event, include_fields,
# decode_json_fields, and add_cloud_metadata.
#
# For example, you can use the following processors to keep the fields that
# contain CPU load percentages, but remove the fields that contain CPU ticks
# values:
#
processors:
- include_fields:
fields: ["cpu"]
- drop_fields:
fields: ["cpu.user", "cpu.system"]
#
# The following example drops the events that have the HTTP response code 200:
#
processors:
- drop_event:
when:
equals:
http.code: 200
#
# The following example renames the field a to b:
#
processors:
- rename:
fields:
- from: "a"
to: "b"
#
# The following example enriches each event with the machine's local time zone
# offset from UTC.
#
processors:
- add_locale:
format: offset
#
# The following example enriches each event with host metadata.
#
processors:
- add_host_metadata: ~
#
# The following example decodes fields containing JSON strings
# and replaces the strings with valid JSON objects.
#
processors:
- decode_json_fields:
fields: ["field1", "field2", ...]
process_array: false
max_depth: 1
target: ""
overwrite_keys: false
#
# The following example copies the value of message to message_copied
#
processors:
- copy_fields:
fields:
- from: message
to: message_copied
fail_on_error: true
ignore_missing: false
#
# The following example preserves the raw message under event_original, which then cut at 1024 bytes
#
processors:
- copy_fields:
fields:
- from: message
to: event_original
fail_on_error: false
ignore_missing: true
- truncate_fields:
fields:
- event_original
max_bytes: 1024
fail_on_error: false
ignore_missing: true
#
# The following example URL-decodes the value of field1 to field2
#
processors:
- urldecode:
fields:
- from: "field1"
to: "field2"
ignore_missing: false
fail_on_error: true
#
# The following example is a great method to enable sampling in Metricbeat, using Script processor#
processors:- script:
lang: javascript
id: my_filter
source:>function process(event){if(Math.floor(Math.random()*100)<50){event.Cancel();}}
Metricbeat offers more types of processors as you can see here and you may also include conditions in your processor definition. If you use Coralogix, you have an alternative to Metricbeat Processors, to some extent, as you can set different kinds of parsing rules through the Coralogix UI instead. If you are maintaining your own ELK stack or other 3rd party logging tool you should check for processors when you have any need for parsing.
Output
You configure Metricbeat to write to a specific output by setting options in the Outputs section of the metricbeat.yml config file. Only a single output may be defined. In this example, I am using the Logstash output. This is the required option if you wish to send your logs to your Coralogix account, using Metricbeat. For more output options.
# ================================= Logstash Output =================================
output.logstash:
  # Boolean flag to enable or disable the output module.
  enabled: true

  # The Logstash hosts
  hosts: ["localhost:5044"]

  # Configure escaping HTML symbols in strings.
  escape_html: true

  # Number of workers per Logstash host.
  worker: 1

  # Optionally load-balance events between Logstash hosts. Default is false.
  loadbalance: false

  # The maximum number of seconds to wait before attempting to connect to
  # Logstash after a network error. The default is 60s.
  backoff.max: 60s

  # Optional index name. The default index name is set to filebeat
  # in all lowercase.
  index: 'filebeat'

  # The number of times to retry publishing an event after a publishing failure.
  # After the specified number of retries, the events are typically dropped.
  # Some Beats, such as Filebeat and Winlogbeat, ignore the max_retries setting
  # and retry until all events are published.  Set max_retries to a value less
  # than 0 to retry until all events are published. The default is 3.
  max_retries: 3

  # The maximum number of events to bulk in a single Logstash request. The
  # default is 2048.
  bulk_max_size: 2048

  # The number of seconds to wait for responses from the Logstash server before
  # timing out. The default is 30s.
  timeout: 30s
This example only shows some of the configuration options for the Logstash output, there are more. It’s important to note that when using Coralogix, you specify the following Logstash host: logstashserver.coralogixstg.wpengine.com:5044 under hosts and that some other options are redundant, such as index name, as it is defined by us.
At this point, we have enough Metricbeat knowledge to start exploring some actual configuration files. They are commented and you can use them as references to get additional information about different plugins and parameters or to learn more about Metricbeat.
Metricbeat Configuration Examples
Example 1
This example uses the system module to monitor your local server and send different metric sets. The Processors section includes a processor to drop unneeded beat metadata. The chosen output for this example is stdout.
This example uses the system module to monitor your local server and send different metric sets, forwarding the events to Coralogix’s Logstash server (output) with the secured connection option. The Processors section includes a processor to sample the events to send 50% of the data.
#============================= Metricbeat Modules =============================
metricbeat.modules:
- module: system
  metricsets:
    - cpu             # CPU usage
    - load            # CPU load averages
    - memory          # Memory usage
    - network         # Network IO
  enabled: true
  period: 10s
#============================= General =============================
fields_under_root: true
fields:
  PRIVATE_KEY: "XXXXXXXX-XXXX-XXXX-XXXX-XXXXXXXXXXXX"
  COMPANY_ID: XXXXX
  APP_NAME: "metricbeat"
  SUB_SYSTEM: "system"
#================================= Processors =================================
processors:
# The following example is a great method to enable sampling in Filebeat, using Script processor. This script processor drops 50% of the incoming events
  - script:
      lang: javascript
      id: my_filter
      source: >
        function process(event) {
            if (Math.floor(Math.random() * 100) < 50) {
              event.Cancel();
            }
        }
#================================= Logstash output =================================
output.logstash:
  enabled: true
  hosts: ["logstashserver.coralogixstg.wpengine.com:5015"]
  ssl.certificate_authorities: ["/var/log/metricbeat/ca.crt"]
Elastic is “an index”, “a search engine”, “a big data solution”, an analytics platform with advanced data visualizations and incredibly fast search capabilities. In short, it’s a solution for many problems.
The Elasticsearch platform provides a distributed search cluster that enables large amounts of data to be indexed and searched at scale. It has quickly become the perfect solution for e-commerce applications, dating apps, log collection, weather analysis, government planning, Cyber Security, IoT, and much much more.
The key features of Elasticsearch provide distributed advanced search and aggregation of data, whilst providing high availability, security, and other data management features.
In this intro to Elasticsearch tutorial, we are going to explore the power of Elasticsearch and cover the basics of how to use it.
Note: This tutorial will help you get started using Elasticsearch. It assumes that you’ve already weighed the pros and cons of using Elasticsearch in your particular instance, especially considering Elastic’s new SSPL license change.
Getting Started
Elastic hides the complex search and distribution infrastructure from beginners, allowing you to start with a basic understanding and gradually increase your knowledge to unlock additional benefits along the way.
This post will cover everything you need to know to get started, including:
Deploying Elastic with Docker
Creating and deleting indices
Editing documents
And more!
How does Elasticsearch work?
Elasticsearch operates by retrieving and managing semi-structured data and document-oriented objects. The internal workings of Elasticsearch use the “shared nothing” architecture. Elasticsearch uses Apache Lucene’s under the hood which is an inverted index as its primary data structure.
How is information stored in Elasticsearch?
In its rawest form, Lucene is a text search engine. It stores text in a custom binary format which is optimized for retrieval purposes. Lucene’s architecture is that of “indices containing documents”. Each index consists of several segments and these segments are saved in several files inside the Elasticsearch platform. Documents are split up into several lookup structures, which reside in the files.
If you browse the data folder on an elastic node you will see the above Lucene index and segment structure. Instead of storing JSON formatted data on the filesystem, the files contain optimized binary data which is accessed via the Elasticsearch API. This API provides the data as JSON.
How does Elasticsearch find information?
When it comes to searching the data in Elasticsearch, Elastic uses an inverted index. This in its most basic form provides a mapping of each unique ‘word’ to the list of documents containing that word. This process is what enables Elastic to locate documents with given keywords so quickly.
Can Elasticsearch work across multiple nodes?
Elastic is a distributed platform, meaning it’s designed to run across multiple nodes. Multiple nodes form a cluster. Each of the nodes in a cluster has Index information stored in one or more partitions, these are referred to as shards. The Elasticsearch platform is capable of dynamically distributing and allocating shards to nodes in the cluster. Elasticsearch also provides the capabilities to replicate shards to nodes for resilience.
This process and capability enable the platform to be highly flexible with data distribution, which provides great capabilities to protect data stored within an Elastic cluster.
Deploying Elasticsearch
For this post, we’ll set up and run a single node instance however in production the Elastic Stack can be deployed on-premises, in the cloud, in docker, and a number of other ways. The requirements for the base infrastructure remain mostly the same. Firstly, and most importantly, you are going to want a minimum of three nodes (Virtual Machines or Containers).
TIP – You should ideally design this to span multiple zones to build a fully resilient cluster. For example, in the Cloud, you want to ensure you have nodes sitting in different zones to mitigate risks of outages.
Prerequisites
For this tutorial, you will need to meet the following prerequisites:
Docker
1 GB of Storage
Knowledge of CURL
Knowledge of Terminal
We will use Docker to quickly get an Elasticsearch instance up and running. If you haven’t used Docker before, you can jump over to their website to get yourself familiar.
There are a number of ways to deploy Elasticsearch. The goal of this article is to get you up and working in the shortest possible time. We are going to build a single node cluster to demonstrate the power of Elastic, but this should only be used for development and testing environments.
TIP – Never run an Elastic cluster on a single node for production.
Deploying to Docker
Let’s get Elasticsearch deployed. As we are going to run this in docker jump into a terminal session and pull the Elastic image. In this tutorial, we are going to use version 7.9.3. To pull the images to your machine run the below:
docker pull elasticsearch:7.9.3
Pulling the image should look like this:
Now that you have the image it’s time to run the image in a container. Elasticsearch will need a few ports to be forwarded to our localhost so we can access the Elasticsearch services. We will forward port 9200 which is the Elasticsearch API. We also add the configuration for a single development node ‘-e discovery.type=single-node’
docker run -d --name elasticsearch -p 9200:9200 -e "discovery.type=single-node" elasticsearch:7.9.3
Running the container should look like this:
The returned string is the docker container id. This now means that the image is running. We can verify that this is the case by running docker ps.
docker ps
This will now list all running docker containers:
Great, so the image is now running as a container on your local machine. Let see if we can access the Elasticsearch API. A simple GET request to our localhost should connect to the Elasticsearch container when we use port 9200. Using curl lets see if our container is working:
curl localhost:9200/
You should receive the below from your GET request:
Nice! You now have a local container running Elasticsearch. You can now start and stop your Elastic container with the following:
To stop the container:
docker stop elasticsearch
To start the container:
docker start elasticsearch
Creating an Index
Now that we have a working Elasticsearch container it’s time to add some data to it. Adding data to Elasticsearch streams the data into an Apache Lucene Index under the hood. Elasticsearch then uses the Lucene indexes to search and retrieve data. Whilst it is not a requirement to know a lot about the working of Lucene, it most certainly helps when you start to get serious with Elasticsearch!
Elasticsearch is presented as a REST API. This means that you can either use POST or PUT methods to add data to the platform. The PUT method is used when you want to specify the id of the data item and POST is used when you want Elasticsearch to generate an id for the data item. You use the GET method to pull data back out of Elasticsearch. But more on that later!
Let’s add some data to Elasticsearch:
curl -XPOST 'localhost:9200/logs/test' -H 'Content-Type: application/json' -d'{ "timestamp": "2020-12-05 12:24:00", "message": "Adding data to Elasticsearch", "reason_code": "01", "username": "Deklan"}'
In this test example, we are using JSON to format our input. We are creating a record containing a timestamp, a message, a reason code, and a username. You can of course structure the data as required for your use case. Running the command results in the below:
We can see that the request was accepted and Elasticsearch returns information about the request that was processed.
Let’s take a look at using the PUT method to create a record with a specific ID. In this example, we are creating a reason code that will be used in our first record.
curl -X PUT 'localhost:9200/app/reason/1' -H 'Content-Type: application/json' -d '{ "id": 1, "details": "This is a test reason code", "created": "2020-12-05 12:24:00"}'
If all has gone well your response should look something like this:
So now we know how to put data into Elasticsearch. At this point, you might be asking yourself, how can we index the data if we didn’t define a data structure? Well, this is the magic of Elasticsearch, you don’t need to. Elasticsearch will pull everything together for you, but it is possible to tweak your indexes when you are looking to get the best possible performance out of Elasticsearch.
Let’s see what indices have been created in our Elasticsearch instance:
curl -XGET 'localhost:9200/_cat/indices?v&pretty'
Your response should look like this:
Great, so we can see that we have created one index called ‘app’ & one called ‘logs’. We can also see data relating to the indexes such as the number of documents and the store size.
Querying Elasticsearch
Things are starting to get exciting in this Elasticsearch tutorial now! We have data in our Elasticsearch instance and we are now going to explore how we can search and analyze it. The first method you should know is to fetch a single item. As discussed above we will now use the GET method to request data from the Elasticsearch API.
To request a single record we use the below.
Tip – The ‘?pretty’ at the end of the request will return the data in a more human understandable format.
curl -XGET 'localhost:9200/app/reason/1?pretty'
Your response should look like this:
Cool! So now we are able to get data back out of our Elasticsearch instance. The metadata of the item is presented in fields that start with an underscore. The _source field will contain the objects that we have created. Building on what we have learned, we can now explore how to use Elasticsearch for searching.
To search your Elasticsearch instance send the following request. In this search we are looking for any record containing ‘Deklan’:
curl -XGET 'localhost:9200/_search?q=Deklan'
Your response should look like this:
Let explore some of the extra metadata we got in the response from Elasticsearch. This can be found at the beginning of the response.
[table id=54 /]
Lucene queries
The searches we have just completed are called URI searches and they are the most basic way to query your Elasticsearch instances. Let’s build on this and look at how we can structure more advanced searches. For this, we need to use Lucene queries. Let’s take a look at some examples:
[table id=55 /]
Building on this, there are a number of ways to include boolean logic, the boosting of terms, and the use of fuzzy & proximity searches. It is also possible to use regular expressions.
Advanced Queries: DSL Queries in Elasticsearch
Expanding further into querying our Elasticsearch instance we are now going to explore how we can request a body search with a Query DSL for much more granular searches. There are a vast array of options that can be used to define the level of granularity provided by a search. Moreover, you can mix and match different options to create highly specialized searches.
A DSL query is built out of two kinds of clauses. The first is a leaf query clause that looks for a value in a specific field and the second is a compound query clause (This can contain one or multiple leaf query clauses).
Elasticsearch Query Types
There is a number of query types available in Elasticsearch including:
Geo queries
“More like this” queries
Scripted queries
Full-text queries
Shape queries
Span queries
Term-level queries
Specialized queries
Clauses in a filter context test documents in a boolean fashion: Does the document match the filter, “yes” or “no?” Filters are also generally faster than queries, but queries can also calculate a relevance score according to how closely a document matches the query. Filters do not use a relevance score. This determines the ordering and inclusion of documents:
Filters and Queries
Recently Elasticsearch has merged Elasticsearch queries and Elasticsearch filters, but these are still differentiated by context. The DSL is able to detect the difference between a filter and query context for query clauses. Filters are looped through in a boolean fashion. Elasticsearch will effectively filter based on Yes or No answers to the queries requested. Elasticsearch will then calculate the relevance score according to how closely the results match the query.
Deleting data is as simple as using the DELETE method on your HTTP requests. To try this out, let’s delete the reason code which we created at the beginning of this tutorial.
To delete the reason code we use the following request:
In this Elasticsearch tutorial, we have run through getting yourself up and working in Elasticsearch. You have learned how to spin up a Docker Elasticsearch instance, the basic steps of CRUD operations in Elasticsearch.
Our goal was to give you a solid foundation in which to expand your understanding of Elasticsearch. Elasticsearch is such a dynamic platform that has so many use cases. Hopefully, this will set you up so you can now start to explore just how powerful Elasticsearch is.
Recent changes to the Elasticsearch license could have consequences on your intellectual property. Elasticsearch and Kibana as recently published by Elastic will no longer be licensed under the OSS Apache license effective from Elasticsearch version 7.11.
There is a lot of false information out there regarding this move. We at Coralogix aren’t impacted by Elastic’s departure from the previous Open Source Apache V2 License. However, for many of our customers and industry peers the change might have real implications.
While we’re not making any changes to our own roadmap, we have concerns about ramifications for the wider community. As such, we’ve provided this honest outline of the new license and offered guidance for those of you uncomfortable working under a source available license.
Elastic – A Cornerstone of Modern Analytics
There is a reason any major changes to Elastic’s license terms create conversation. Passing the 100 million download milestone as far back as 2017, the ELK stack was an integral ingredient to most log analytics stacks in the last decade.
Elasticsearch, Logstash, and Kibana have become household names in analytics. It should be noted that the former two, Logstash and Kibana, were OSS until the top developers on the projects moved over to Elasticsearch. From that point the ELK stack became a unified force. Entire businesses are built on services that rely on the ELK stack. From humble beginnings as open-source projects, ELK is now a software name that is synonymous with monitoring, observability, and analytics.
However, the ELK stack’s open source roots are also the reason it was adopted and embraced so widely. Open-source licensing gave businesses access to cutting edge tools with no risk of a legal grey area around intellectual property ownership. The new dual Elastic and SSPL license adopted by Elastic affects this legal protection, and also seems to contradict the values that led to ELK’s popularity among engineers and businesses in the first place.
The New Elasticsearch SSPL License
Openness was at the heart of Elastic’s message during their rise to industry prominence. In the past, after changing some of their advanced features license, they have stated outright that they remained dedicated to the previous Apache 2.0 license. To quote Elastic directly:
“We did not change the license of any of the Apache 2.0 code of Elasticsearch, Kibana, Beats, and Logstash — and we never will.”
The reason for Elastic’s previous commitment to the Apache 2.0 license was simple. Apache 2.0 is an open-source license as recognized by the OSI (Open Source Initiative) that allows for commercial adoption and redistribution of ELK code as part of another platform, product, or service, without restriction.
ELK became a staple of analytics development and engineering partly because of Elastic’s outspoken championship of open source values and because of the legal freedom that came with them. These license changes have been seen by many as a move away from these values for a more commercial mindset.
What is the difference between open source and source available?
The new dual license gives users the choice between the Elastic license and SSPL, which is often falsely cited as an open-source license. SSPL has never been certified by the OSI as an open-source license, it’s actually a source available license.
Incorporating software distributed under an open-source license into your stack brings no redistribution restrictions. You hold full ownership of the code, and aren’t required to make it publicly available.
Under a source available license this is not the case. To quote the SSPL directly:
“13. Offering the Program as a Service.
If you make the functionality of the Program or a modified version available to third parties as a service, you must make the Service Source Code available via network download to everyone at no charge, under the terms of this License.”
Under SSPL licensing any product or service that makes use of ELK functionality must have its code made public. What is more, that code must be redistributed under the same SSPL license. This is the issue with the SSPL license – the definition of “making functionality available” is very loose.
What does this mean for my business?
The broad and vague language used by the license leaves much open to speculation. Potentially anything offered by your business to customers or clients that makes use of Elasticsearch and/or Kibana is at risk of having to be made readily available online, free of charge.
When you consider how sensitive some of the data handled by ELK-reliant systems can be, and how widespread the use of Elastic’s products has become, this could compromise entire businesses. Many managed Security Operations Centers rely on ELK to protect their customers and clients. Will managed SOC’s have to expose their code, leaving their clients vulnerable to attack?
This is only one of the many sectors at potential risk. The banking and finance sector relies on Elasticsearch for internal tools that allow their customers to find the best loan offers, etc. The code of these tools is business critical. Having better search tools than your competitor could be what moves customers from your rivals’ books to yours. It could be argued that this is offering Elastic functionality as a service. Does SSPL force the banks to put their trade secrets online as OSS?
So is ELK not open source anymore?
No.
This answer may seem blunt, but this isn’t as nuanced a question as many believe. The OSI has clearly stated that SSPL is not an open-source license. SSPL fails to match the criteria that open source licenses, like the previous Apache 2.0 license, meet. The OSI reached their decision and published the results precisely to make consumers and users aware of this fact.
Open-source isn’t a jargon blanket definition given to licenses that are loose around redistribution or sharing rights. It is a very specific legal term, one which cannot be applied to the SSPL license under which Elastic now distributes ELK.
With the previous license, ELK could be freely incorporated into your software. Now, under the new license, there is a real risk of you being forced to release all of your code. The legal and financial ramifications of this for your business cannot be overstated.
Every modern business has its competitive commercial edge, its unique selling point, baked into the code of its software, products, and services. Code is one of the most valuable pieces of intellectual property your business has. If you’ve integrated Elasticsearch, Logstash, or Kibana, the SSPL license could require that your code be made public and readily available to your own competitors.
Will it stop here?
There’s no real answer to that question. Adopting the SSPL license was a colossal change in direction for Elastic. As we’ve seen, it directly contradicts the values and vision for the future they previously espoused. If Elastic is capable of making such radical ideal shifts now, who can say with certainty what changes the coming years could bring?
If there is one thing this change has exposed, it’s that Elastic’s prevalence has led to what could be seen as an over-reliance on their software. Very rarely does a license change for a single piece of software generate so much genuine worry, let alone put so many businesses at risk of losing valuable intellectual property.
Could this be a wake-up call for the industry? Are we all now only one Elastic legal decision away from huge disruptions to the way we work, create, and do business?
How have users reacted to the new SSPL license?
On the whole, the news has not been well received by ELK users or the open-source community. Many have stated they are confused, upset, or even betrayed by the move.
Some see the move as a business ploy to undercut/outperform Elastic rivals such as AWS. As you can see by the colorful language this isn’t a move that many take lightly.
Some are openly advising businesses to move away from Elastic entirely, on a financial/contributory level too.
This Twitter user succinctly sums up the widely held community view that Elastic may be trying to impose partial ownership or control on users’ projects.
This user brings up another key concern with the license. The language used is incredibly broad. Any intellectual property lawyer will tell you that broad/vague language is often leveraged by license holders like Elastic in legal disputes.
Some have also seen material put out by Elastic to address key concerns as being thinly veiled marketing to ramp up competition against Amazon, instead of containing any helpful information.
Where to Go From Here
Even for those of us not in scope, this change will have significant ramifications. The integration of Elasticsearch, Logstash, and Kibana forcing businesses into binding redistribution terms has opened up broad conversations about open-source software. Not too long ago there was a security that came with using ELK. Almost overnight, that has proven itself to be an unreliable assumption.
What are your options with your ELK stack?
Continuing to run your ELK stack, as-is, could represent a business risk. While the present license change may not impact you, any corporate lawyer will be rightfully concerned about the legal traps that may await down the road. So what can you do to mitigate this risk?
One option is to cease hosting ELK yourself and purchase a managed ELK stack subscription. This has the benefit of shifting liability away from you, but it can come with a price tag.
How can Coralogix help?
As stated, the Coralogix platform doesn’t rely on Elastic. These licensing changes do not impact our platform or roadmap for the future. We still have the security and peace of mind these changes have taken from businesses the world over.
The Coralogix platform is available as a more-than-suitable alternative if Elastic and/or SSPL licensing aren’t compatible with the future of your business. Our platform can match and improve upon all the core features and functionality your business relies on. With Coralogix you can leverage industry defining alerting, metrics, and observability features powered by machine learning. Not only that, we also offer cost optimization using our own Streama technology.
We are providing free migrations from ELK to the Coralogix platform. Our team of experts can facilitate a smooth and swift transition, mitigating the disruption to your business and allowing you to focus on what matters most; developing and delivering great software products and services.
Syslog is a popular standard for centralizing and formatting log data generated by network devices. It provides a standardized way of generating and collecting log information, such as program errors, notices, warnings, status messages, and so on. Almost all Unix-like operating systems, such as those based on Linux or BSD kernels, use a Syslog daemon that is responsible for collecting log information and storing it.
They’re usually stored locally, but they can also be streamed to a central server if the administrator wants to be able to access all logs from a single location. By default, port 514 and UDP are used for the transmission of Syslogs.
Note: It’s recommended to avoid UDP whenever possible, as it doesn’t guarantee that all logs will be sent and received; when the network is unreliable or congested, some messages could get lost in transit.
For more security and reliability, port 6514 is often used with TCP connections and TLS encryption.
In this post, we’ll learn how to collect Syslog messages from our servers and devices with Logstash and send it to Elasticsearch. This will allow us to take advantage of its super-awesome powers of ingesting large volumes of data and then allowing us to quickly and efficiently search for what we need.
We’ll explore two methods. One involves using the Syslog daemon to send logs through a TCP connection to a central server running Logstash. The other method uses Logstash to monitor log files on each server/device and automatically index messages to Elasticsearch.
Getting Started
Let’s take a look at how typical syslog events look like. These are usually collected locally in a file named /var/log/syslog.
We can see the line starts with a timestamp, including the month name, day of month, hour, minute and second at which the event was recorded. The next entry is the hostname of the device generating the log. Next is the name of the process that created the log entry, its process ID number, and, finally, the log message itself.
Logs are very useful when we want to monitor the health of our systems or debug errors. But when we have to deal with tens, hundreds, or even thousands of such systems, it’s obviously too complicated to log into each machine and manually look at syslogs. By centralizing all of them into Elasticsearch, it makes it easier to get a birds-eye view over all of the logged events, filter only what we need and quickly spot when a system is misbehaving.
Collecting syslog Data with Logstash
In this post, we’ll explore two methods with which we can get our data into Logstash logs, and ultimately into an Elasticsearch index:
Using the syslog service itself to forward logs to Logstash, via TCP connections.
Configuring Logstash to monitor log files and collect their contents as soon as they appear within those files.
Forwarding Syslog Messages to Logstash via TCP Connections
The syslog daemon has the ability to send all the log events it captures to another device, through a TCP connection. Logstash, on the other hand, has the ability to open up a TCP port and listen for incoming connections, looking for syslog data. Sounds like a perfect match! Let’s see how to make them work together.
For simplicity, we will obviously use the same virtual machine to send the logs and also collect them. But in a real-world scenario, we would configure a separate server with Logstash to listen for incoming connections on a TCP port. Then, we would configure the syslog daemons on all of the other servers to send their logs to the Logstash instance.
Important: In this exercise, we’re configuring the syslog daemon first, and Logstash last, since we want the first captured logged events to be the ones we intentionally generate. But in a real scenario, configure Logstash listening on the TCP port first. This is to ensure that when you later configure the syslog daemons to send their messages, Logstash is ready to ingest them. If Logstash isn’t ready, the log entries sent while you configure it, won’t make it into Elasticsearch.
We will forward our syslogs to TCP port 10514 of the virtual machine. Logstash will listen to port 10514 and collect all messages.
Let’s edit the configuration file of the syslog daemon.
sudo nano /etc/rsyslog.d/50-default.conf
Above the line “#First some standard log files. Log by facility” we’ll add the following:
Specifically, we’re looking for the “Successfully started Logstash” message.
Let’s leave Logstash running in the background, collecting data. Leave its terminal window open (so you can see it catching syslog events) and open up a second terminal window to enter the next commands.
It’s very likely that at this point no syslog events have been collected yet, since we just started Logstash. Let’s make sure to generate some log entries first. A simple command such as
sudo ls
will ensure we’ll generate a few log messages. We’ll be able to see in the window where Logstash is running that sudo generated some log entries and these have been added to the Elasticsearch index.
Awesome! Everything worked perfectly. Now let’s test out the other scenario.
Monitoring syslog Files with Logstash
We’ll first need to stop the Logstash process we launched in the previous section. Switch to the terminal where it is running and press CTRL+C to stop it.
and also delete the directory where we placed our Logstash config files.
sudo rm -r /etc/logstash/conf.d/logstash-syslog
Conclusion
As you can see, it’s fairly easy to gather all of your logs in a single location, and the advantages are invaluable. For example, besides making everything more accessible and easier to search, think about servers failing. It happens a little bit more often than we like. If logs are kept on the server, once it fails, you lose the logs. Or, another common scenario, is that hackers delete logs once they compromise a machine. By collecting everything into Elasticsearch, though, you’ll have the original logs, untouched and ready to review to see what happened before the machine experienced problems.
The default Elasticsearch setup is pretty good. You can get running from scratch to use as a simple log storage solution. However, as soon as you begin to rely on your default cluster, problems will inevitably appear.
Configuring elasticsearch is complex, so we’ve compiled useful configurations and the most common mistakes. Armed with these key tips, you’ll be able to take control of your Elasticsearch cluster and ship your logs with confidence.
Key Elasticsearch Configurations To Apply To Your Cluster
Get your naming right
Make sure your nodes are in the same cluster!
Nodes in the same cluster share the same cluster.name. Out of the box, your nodes will have the name “elasticsearch”. The cluster name is configured in the elasticsearch.yml file specific to each environment.
cluster.name: my-custom-cluster-name
TIP: Be careful with sharing cluster names across environments. You may end up with nodes in the wrong cluster!
Wait, which node is ‘ec2-100.64.0.0-xhdtd’ again?
When you spin up a new EC2 instance in your cloud provider, it often has a long and unmemorable name. Naming your nodes allows you to give them a meaningful identifier.
By default, the node name will be the hostname of the machine. You can configure the elasticsearch.yml to set the node name to an environment variable.
node.name:my-node-123
Write to a safe location!
By default, Elasticsearch will write data to folders within $ES_HOME. The risk here is, during an upgrade, these paths may be overwritten.
In a production environment, it is strongly recommended you set the path.data and path.logs in elasticsearch.yml to locations outside of $ES_HOME.
TIP: The path.data setting can be set to multiple paths.
Make sure your network configurations are rock solid
The network.host property sets both the bind host and the publish host. For those of you who aren’t familiar with these terms, they’re quite straightforward. The bind host is what Elasticsearch listens to for requests. The publish host, or IP address, is what Elasticsearch will use to communicate with other nodes.
TIP: You can put in some special values into this field, such as _local_, _site_ and modifiers like :ip4.
Be prepared for some start up issues!
As soon as you set a value for network.host, you’re signaling to Elasticsearch that you’re now ready for a production setup. A number of system startup checks graduate from warnings to exceptions. This may introduce some teething issues as you get started.
Tell your nodes who is who with discovery settings
Elasticsearch nodes need to be able to find out about other nodes in the cluster. They also need to be able to determine who will be the master node. We can do this with a few discovery settings.
‘discovery.seed_hosts’ declares who can be a master node
The discovery.seed_hosts provides a list of nodes that can become a master node.
TIP: Each item should be formatted as host:port or host on its own. If you don’t specify a port, it will default to the value of transport.profiles.default.port
What if you’re starting a brand new cluster?
When starting an Elasticsearch cluster for the very first time, use the cluster.initial_master_nodes setting. When starting a new cluster in production mode, you must explicitly list the nodes that can become master nodes. Under the hood, you’re telling Elasticsearch that these nodes are permitted to vote for a leader.
Check your JVM Configuration
Elasticsearch is underpinned by the Java Virtual Machine (JVM). It is easy to forget about this critical component, but when you’re running a production Elasticsearch cluster, you need to have a working understanding of the JVM.
Allocating Heap Space
The size of your JVM heap determines how much memory your JVM has to work with.
Give your JVM Heap some padding, beyond what you’re expecting to use, but not too much. A large JVM Heap can run into problems with long garbage collection pauses, which can dramatically impact your cluster performance.
At most, your Xms and Xmx values should be 50% of your RAM. Elasticsearch requires memory for purposes other than the JVM heap and it is important to leave space for this. On top of this, don’t set your heap to greater than 32 GB, otherwise you lose the benefit of compressed object pointers.
The 9 Most Common Elasticsearch Configuration Mistakes
To follow are nine of the most common Elasticsearch configuration mistakes when setting up and running an Elasticsearch instance and how you can avoid making them.
Bootstrap checks inspect various settings and configurations before Elasticsearch starts to make sure it will operate safely. If bootstrap checks fail, they can prevent Elasticsearch from starting in production mode or issue warning logs in development mode. It is recommended to familiarize yourself with the settings enforced by bootstrap checks, noting that they are different in development and production modes.
By setting the system property of ‘enforce bootstrap checks’ to true, you can avoid bootstrap checks altogether.
2. Oversized Templating
Large templates are directly related to large mappings. Large mappings create syncing issues in your cluster.
One solution is dynamic templates. Dynamic templates can automatically add field mappings based on your predefined mappings for specific types and names. However, you should always try to keep your templates small in size.
3. Elasticsearch Configuration for Capacity Provisioning
Provisioning can help to equip and optimize Elasticsearch for operational performance. The question that needs to be asked is ‘How much space do you need?’ You should first simulate your use-case. This can be done by booting up your nodes, filling them with real documents, and pushing them until the shard breaks. You can then start defining a shard’s capacity and apply it throughout your entire index.
It’s important to understand resource utilization during the testing process. This allows you to reserve the proper amount of RAM for nodes, configure your JVM heap space, configure your CPU capacity, provision through scaling larger instances with potentially more nodes, and optimize your overall testing process.
4. Not Defining Elasticsearch Mappings
Elasticsearch relies on mapping, also known as schema definitions, to handle data properly according to its correct data type. In Elasticsearch, mapping defines the fields in a document and specifies their corresponding data types, such as date, long, and string.
In cases where an indexed document contains a new field without a defined data type, Elasticsearch uses dynamic mapping to estimate the field’s type, converting it from one type to another when necessary.
You should define mappings, especially in production-based environments. It’s a best practice to index several documents, let Elasticsearch guess the field, and then grab the mapping it creates. You can then make any appropriate changes that you see fit without leaving anything up to chance.
5. Combinable Data ‘Explosions’
Combinable Data Explosions are computing problems that can cause an exponential growth in bucket generation for certain aggregations and can lead to uncontrolled memory usage. Elasticsearch’s ‘terms’ field builds buckets according to your data, but it cannot predict how many buckets will be created in advance. This can be problematic for parent aggregations that are made up of more than one child aggregation.
To overcome this, collection modes can be used to help to control how child aggregations perform. By default, Elasticsearch uses ‘depth-first’ aggregation, however you can also use the breadth-first collection mode.
6. Search Timeout Errors
Search timeouts are common and can occur for many reasons, such as large datasets or memory-intensive queries.
To eliminate search timeouts, you can increase the Elasticsearch Request Timeout configuration, reduce the number of documents returned per request, reduce the time range, tweak your memory settings, and optimize your query, indices, and shards. You can also enable slow search logs to monitor search run time and scan for heavy searches.
7. Process Memory Locking Failure
To ensure nodes remain healthy in the cluster, you must ensure that none of the JVM memory is ever swapped out to disk. You can do this by setting the bootstrap memory lock to true. You should also ensure that you’ve set up memory locking correctly by consulting the Elasticsearch configuration documentation.
8. Shards are Failing
When searching in Elasticsearch, you may encounter ‘shards failure’ error messages. This happens when a read request fails to get a response from a shard. This can happen if the data is not yet searchable because the cluster or node is still in an initial start process, or when the shard is missing, or in recovery mode and the cluster is red.
To ensure better management of shards, especially when dealing with future growth, you are better off reindexing the data and specifying more primary shards in newly created indexes. To optimize your use case for indexing, make sure you designate enough primary shards so that you can spread the indexing load evenly across all of your nodes. You can also factor disabling merge throttling, increasing the size of the indexing buffer, and refresh less frequently by increasing the refresh interval.
9. Production Fine Tuning
By default, the first cluster that Elasticsearch starts is called ‘elasticsearch’. If you are unsure about how to change an Elasticsearch configuration, it’s best to stick to the default. However, it’s good practice to rename your production cluster to prevent unwanted nodes from joining your cluster.
Any applied changes result in recovery settings affecting how nodes recover when clusters restart. Elasticsearch allows nodes that belong to the same cluster to join that cluster automatically whenever a recovery occurs. Some nodes within a cluster boot up quickly after recovery. However, others may take a bit longer at times.
It is important to configure the number of nodes that will be in each cluster, as well as the amount of time that it will take for them to boot up in Elasticsearch.
Avon and Family Tree aren’t companies you would normally associate with cybersecurity, but this year, all three were on the wrong side of it when they suffered massive data breaches. At Avon 19 million records were leaked, and Family Tree had 25GB of data compromised. What do they have in common? All of them were using Elasticsearch databases.
These are just the latest in a string of high profile breaches that have made Elasticsearch notorious in cybersecurity. Bob Diachenko is a cybersecurity researcher. Since 2015, he’s been investigating vulnerabilities in NoSQL databases.
He’s uncovered several high profile cybersec lapses including 250 million exposed Microsoft records. Diachenko’s research suggests that 60% of NoSQL data breaches are with Elasticsearch databases. In this article, I’ll go through five common causes for data breaches and show how the latest Elastic Stack releases can actually help you avoid them.
1. Always Secure Your Default Configuration Before Deploying
According to Bob Diachenko, many data breaches are caused by developers forgetting to add security to the default config settings before the database goes into production. To make things easier for beginner devs, Elasticsearch traditionally doesn’t include security features like authentication in its default configuration. This means that when you set up a database for development, it’s accessible to anyone who knows the IP address.
Avoid Sitting Ducks
The trouble starts as soon as a developer pushes an Elasticsearch database to the internet. Without proper security implementation, the database is a sitting duck for cyberattacks and data leaks. Cybersecurity professionals can use search engines like Shodan to scan for open IP ports indicating the presence of unsecured Elasticsearch databases. As can hackers. Once a hacker finds such a database, they can freely access and modify all the data it contains.
Developers who set up Elasticsearch databases are responsible for implementing a secure configuration before the database goes into production. Elasticsearch’s official website has plenty of documentation for how to secure your configuration and developers need to read it thoroughly.
Elasticsearch to the Rescue
That being said, let’s not put all the blame on lazy programmers! Elasticsearch acknowledges that the fast-changing cybersecurity landscape means devs need to take their documentation with a pinch of salt. Users are warned not to read old blogs as their advice is now considered dangerous. In addition, Elasticsearch security can be difficult to implement. Developers under pressure to cut times to market won’t necessarily be incentivised to spend an extra few days double checking security.
To combat the threat of unsecured databases, Elasticsearch have taken steps to encourage secure implementation as a first choice. Elastic Stack 6.8 and 7.1 releases come with features such as TLS encryption and Authentication baked into the free tier. This should hopefully encourage “community” users to start focussing on security without worrying about bills.
So why are so many devs spinning up unauthenticated Elasticsearch databases? On the internet! In the past, the default configuration didn’t include authentication. Devs used the default configuration because it was convenient and free.
To rub salt on the wound, Elasticsearch told users to implement authentication by placing a Nginx server between the client and the cluster. This approach had the downside that many programmers found setting up the correct configuration much too difficult for them.
Recognising the previous difficulties, Elasticsearch has recently upgraded the free configuration. It now includes native and file authentication. The authentication takes the form of role based access control.
Elasticsearch developers can use Kibana to create users with custom roles demarcating their access rights. This tutorial illustrates how role based access control can be used to create users with different access rights.
In 2018, Sebastien Kaul found an exposed database containing millions of text messages containing plain text passwords.
Both of these are comparatively benign compared to Dianchenko’s most recent find, a leaked database containing 1 billion plain text passwords. With no authentication protecting it, this data was ripe for hackers to plunder. Access to passwords would allow them to commit all kinds of fraud, including identity theft.
Even though storing passwords in plain text is seriously bad practice, many companies have been caught doing it red handed. This article explains the reasons why.
Cybersecurity is No Laughing Matter
In a shocking 2018 twitter exchange, a well-known mobile company admitted to storing customer passwords in plain text. They justified this by claiming that their customer service reps needed to see the first few letters of a password for confirmation purposes.
When challenged on the security risks of this practice, the company rep gave a response shocking for its flippancy.
“What if this doesn’t happen because our security is amazingly good?”
Yes, in a fit of poetic justice, this company later experienced a major data breach. Thankfully, such a cavalier attitude to cybersecurity risks is on the wane. Companies are becoming more security conscious and making an honest attempt to implement security best practice early in the development process.
Legacy Practices
A well-known internet search engine stored some of it’s account passwords in plain text. When found out, they claimed the practice was a remnant from their early days. Their domain admins had the ability to recover passwords and for this to work, needed to see them in plain text.
Although company culture can be slow to change, many companies are undertaking the task of bringing their cybersecurity practices into the 21st century.
Logging Sensitive Data
Some companies have found themselves guilty of storing plain text passwords by accident. A well-known social media platform hit this problem when it admitted it had been storing plain text passwords. The platform’s investigation concluded:
“…we discovered additional logs of [the platform’s] passwords being stored in a readable format.”
They had inadvertently let their logging system record and store usernames and passwords as users were typing the information. Logs are stored in plain text, and typically accessible to anyone in the development team authorised to access them. Plain text user information in logs invited malicious actors to cause havoc.
On this point, make sure to use a logging system with strong security features. Solutions such as Coralogix are designed to conform to the most up to date security standards, guaranteeing the least risk to your company.
Hashing and Salting Passwords
In daily life we’re warned to take dodgy claims “with a pinch of salt” and told to avoid “making a hash of” something. Passwords on the other hand, need to be taken with more than a pinch of salt and made as much of a hash of as humanly possible.
Salting is the process of adding extra letters and numbers to your password to make it harder to decode. For example, imagine you have the password “Password”. You might add salt to this password to make it “Password123” (these are both terrible passwords by the way!)
Once your password has been salted, it then needs to be hashed. Hashing transforms your password to gibberish. A company can check the correctness of a submitted password by salting the password guess, hashing it, and checking the result against the stored hash. However, cybercriminals accessing a hashed password cannot recover the original password from the hash.
4. Don’t Expose Your Elasticsearch Database to the Internet
Bob Diachenko has made it his mission to find unsecured Elasticsearch databases, hopefully before hackers do! He uses specialised search engines to look for the IP addresses of exposed databases. Once found, these databases can be easily accessed through a common browser.
Diachenko has used this method to uncover several high profile databases containing everything from financial information to tech support logs. In many instances, this data wasn’t password protected, allowing Diachenko to easily read any data contained within. Diachenko’s success dramatically illustrates the dangers of exposing unsecured databases to the internet.
Because once data is on the web, anyone in the world can read it. Cybersecurity researchers like Bob Diachenko and Sebastien Kaul are the good guys. But the same tools used by white-hat researchers can just as easily be used by black-hat hackers.
If the bad guys find an exposed database before the good guys do, a security vulnerability becomes a security disaster. This is starkly illustrated by the shocking recent tale of a hacker who wiped and defaced over 15000 Elasticsearch servers, blaming a legit cybersecurity firm in the process.
The Elasticsearch documentation specifically warns users not to expose databases directly to the internet. So why would anyone be stupid enough to leave a trove of unsecured data open to the internet?
In the past, Elasticsearch’s tiering system has given programmers the perverse incentive to bake security into their database as late as possible in the development process. With Elastic Stack 6.8 and 7.1, Elasticsearch have included security features in the free tier. Now developers can’t use the price tag as an excuse for not implementing security before publishing, because there isn’t one.
5. Stop Scripting Shenanigans
On April 3 2020, ZDNet reported that an unknown hacker had been attempting to wipe and deface over 15,000 Elasticsearch servers. They did this using an automated script.
Elasticsearch’s official scripting security guide explains that all scripts are allowed to run by default. If a developer left this configuration setting unchanged when pushing a database to the internet, they would be inviting disaster.
Two configuration options control script execution, script types and script contexts. You can prevent unwanted script types from executing with the command script.allowed_types: inline.
To prevent risky plugin scripts from running, Elasticsearch recommends modifying the script contexts option using script.allowed_contexts: search, update. If this isn’t enough you can prevent any scripts from running you can set script.allowed_contexts to “none”.
Elasticsearch takes scripting security issues seriously and they have recently taken their own steps to mitigate the problem by introducing their own scripting language, Painless.
Previously, Elasticsearch scripts would be written in a language such as JavaScript. This made it easy for a hacker to insert malicious scripts into a database. Painless brings an end to those sorts of shenanigans, making it much harder to bring down a cluster.
Summary
Elasticsearch is one of the most popular and scalable database solutions on the market. However, it’s notorious for its role in data breaches. Many of these breaches were easily preventable and this article has looked at a few of the most common security lapses that lead to such breaches.
We’ve seen that many cases of unsecured databases result from developers forgetting to change Elasticsearch’s default configuration before making the database live. We also looked at the tandem issue of unsecured databases being live on the web, where anyone with the appropriate tools could find them.
Recently, Elasticsearch have taken steps to reduce this by including security features in their free tier so programmers are encouraged to consider security early. Hopefully this alone provides developers a powerful incentive to address the above two issues.
Other issues we looked at were the worryingly common habit of storing passwords as plain text instead of salting and hashing them and the risks of not having a secure execution policy for scripts. These two problems aren’t Elasticsearch specific and are solved by common sense and cybersecurity best practice.
In conclusion, while Elasticsearch has taken plenty of recent steps to address security, it’s your responsibility as a developer to maintain database security.
Mapping is an essential foundation of an index that can generally be considered the heart of Elasticsearch. So you can be sure of the importance of a well-managed mapping. But just as it is with many important things, sometimes mappings can go wrong. Let’s take a look at various issues that can arise with mappings and how to deal with them.
Before delving into the possible challenges with mappings, let’s quickly recap some key points about Mappings. A mapping essentially entails two parts:
The Process: A process of defining how your JSON documents will be stored in an index
The Result: The actual metadata structure resulting from the definition process
The Process
If we first consider the process aspect of the mapping definition, there are generally two ways this can happen:
An explicit mapping process where you define what fields and their types you want to store along with any additional parameters.
A dynamic mapping Elasticsearch automatically attempts to determine the appropropriate datatype and updates the mapping accordingly.
The Result
The result of the mapping process defines what we can “index” via individual fields and their datatypes, and also how the indexing happens via related parameters.
It’s a very simple mapping example for a basic logs collection microservice. The individual logs consist of the following fields and their associated datatypes:
The actual log Message mapped as text to enable full-text searching
More… As we have not disabled the default dynamic mapping process so we’ll be able to see how we can introduce new fields arbitrarily and they will be added to the mapping automatically.
The Challenges
So what could go wrong :)?
There are generally two potential issues that many will end up facing with Mappings:
If we create an explicit mapping and fields don’t match, we’ll get an exception if the mismatch falls beyond a certain “safety zone”. We’ll explain this in more detail later.
If we keep the default dynamic mapping and then introduce many more fields, we’re in for a “mapping explosion” which can take our entire cluster down.
Let’s continue with some interesting hands-on examples where we’ll simulate the issues and attempt to resolve them.
Hands-on Exercises
Field datatypes – mapper_parsing_exception
Let’s get back to the “safety zone” we mentioned before when there’s a mapping mismatch.
We’ll create our index and see it in action. We are using the exact same mapping that we saw earlier:
Great! It worked without throwing an exception. This is the “safety zone” I mentioned earlier.
But what if that service logged a string that has no relation to numeric values at all into the Port field, which we earlier defined as an Integer? Let’s see what happens:
curl --request POST 'https://localhost:9200/microservice-logs/_doc?pretty'
--header 'Content-Type: application/json'
--data-raw '{"timestamp": "2020-04-11T12:34:56.789Z", "service": "XYZ", "host_ip": "10.0.2.15", "port": "NONE", "message": "I am not well!" }'
>>>
{
 "error" : {
   "root_cause" : [
     {
       "type" : "mapper_parsing_exception",
       "reason" : "failed to parse field [port] of type [integer] in document with id 'J5Q2anEBPDqTc3yOdTqj'. Preview of field's value: 'NONE'"
     }
   ],
   "type" : "mapper_parsing_exception",
   "reason" : "failed to parse field [port] of type [integer] in document with id 'J5Q2anEBPDqTc3yOdTqj'. Preview of field's value: 'NONE'",
   "caused_by" : {
     "type" : "number_format_exception",
     "reason" : "For input string: "NONE""
   }
 },
 "status" : 400
}
We’re now entering the world of Elastisearch mapping exceptions! We received a code 400 and the mapper_parsing_exception that is informing us about our datatype issue. Specifically that it has failed to parse the provided value of “NONE” to the type integer.
So how we solve this kind of issue? Unfortunately, there isn’t a one-size-fits-all solution. In this specific case we can “partially” resolve the issue by defining an ignore_malformed mapping parameter.
Keep in mind that this parameter is non-dynamic so you either need to set it when creating your index or you need to: close the index → change the setting value → reopen the index. Something like this.
curl --request POST 'https://localhost:9200/microservice-logs/_close'

curl --location --request PUT 'https://localhost:9200/microservice-logs/_settings'
--header 'Content-Type: application/json'
--data-raw '{
   "index.mapping.ignore_malformed": true
}'

curl --request POST 'https://localhost:9200/microservice-logs/_open'
Now let’s try to index the same document:
curl --request POST 'https://localhost:9200/microservice-logs/_doc?pretty'
--header 'Content-Type: application/json'
--data-raw '{"timestamp": "2020-04-11T12:34:56.789Z", "service": "XYZ", "host_ip": "10.0.2.15", "port": "NONE", "message": "I am not well!" }'
Checking the document by its ID will show us that the port field was omitted for indexing. We can see it in the “ignored” section.
The reason this is only a “partial” solution is because this setting has its limits and they are quite considerable. Let’s reveal one in the next example.
A developer might decide that when a microservice receives some API request it should log the received JSON payload in the message field. We already mapped the message field as text and we still have the ignore_malformed parameter set. So what would happen? Let’s see:
curl --request POST 'https://localhost:9200/microservice-logs/_doc?pretty'
--header 'Content-Type: application/json'
--data-raw '{"timestamp": "2020-04-11T12:34:56.789Z", "service": "ABC", "host_ip": "10.0.2.15", "port": 12345, "message": {"data": {"received":"here"}}}'
>>>
{
...
       "type" : "mapper_parsing_exception",
       "reason" : "failed to parse field [message] of type [text] in document with id 'LJRbanEBPDqTc3yOjTog'. Preview of field's value: '{data={received=here}}'"
...
}
We see our old friend, the mapper_parsing_exception! This is because ignore_malformedcan’t handle JSON objects on the input. Which is a significant limitation to be aware of.
Now, when speaking of JSON objects be aware that all the mapping ideas remains valid for their nested parts as well. Continuing our scenario, after losing some logs to mapping exceptions, we decide it’s time to introduce a new payload field of the type object where we can store the JSON at will.
Remember we have dynamic mapping in place so you can index it without first creating its mapping:
It was mapped as an object with (sub)properties defining the nested fields. So apparently the dynamic mapping works! But there is a trap. The payloads (or generally any JSON object) in the world of many producers and consumers can consist of almost anything. So you know what will happen with different JSON payload which also consists of a payload.data.received field but with a different type of data:
Engineers on the team need to be made aware of these mapping mechanics. You can also eastablish shared guidelines for the log fields.
Secondly you may consider what’s called a Dead Letter Queue pattern that would store the failed documents in a separate queue. This either needs to be handled on an application level or by employing Logstash DLQ which allows us to still process the failed documents.
Limits – illegal_argument_exception
Now the second area of caution in relation to mappings, are limits. Even from the super-simple examples with payloads you can see that the number of nested fields can start accumulating pretty quickly. Where does this road end? At the number 1000. Which is the default limit of the number of fields in a mapping.
Let’s simulate this exception in our safe playground environment before you’ll unwillingly meet it in your production environment.
We’ll start by creating a large dummy JSON document with 1001 fields, POST it and then see what happens.
To create the document, you can either use the example command below with jq tool (apt-get install jq if you don’t already have it) or create the JSON manually if you prefer:
curl --location --request PUT 'https://localhost:9200/big-objects'
And if we then POST our generated JSON, can you guess what’ll happen?
curl --request POST 'https://localhost:9200/big-objects/_doc?pretty'
--header 'Content-Type: application/json'
--data-raw "$thousandone_fields_json"
>>>
{
 "error" : {
   "root_cause" : [
     {
       "type" : "illegal_argument_exception",
       "reason" : "Limit of total fields [1000] in index [big-objects] has been exceeded"
     }
...
 "status" : 400
}
… straight to the illegal_argument_exception exception! This informs us about the limit being exceeded.
So how do we handle that? First, you should definitely think about what you are storing in your indices and for what purpose. Secondly, if you still need to, you can increase this 1,000 limit. But be careful as with bigger complexity might come a much bigger price of potential performance degradations and high memory pressure (see the docs for more info).
Changing this limit can be performed with a simple dynamic setting change:
 The new standard of observability is here. Discover Olly, the industry’s first


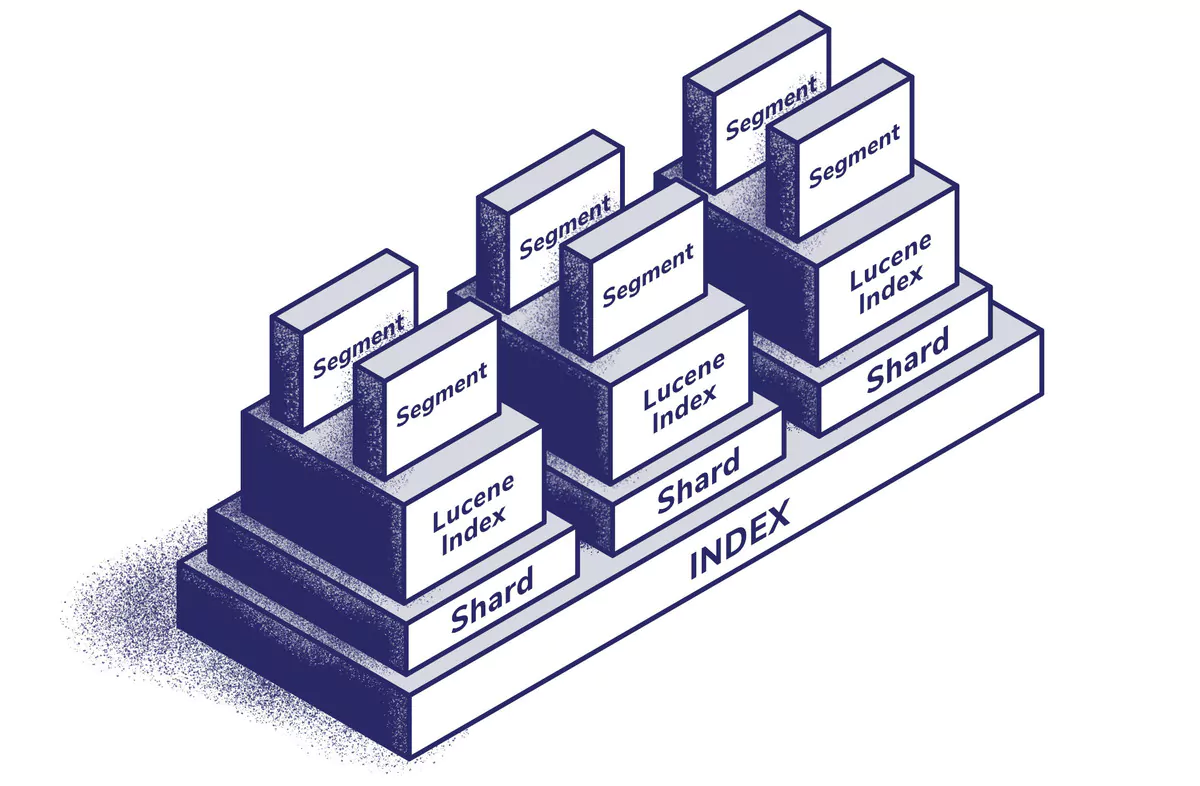
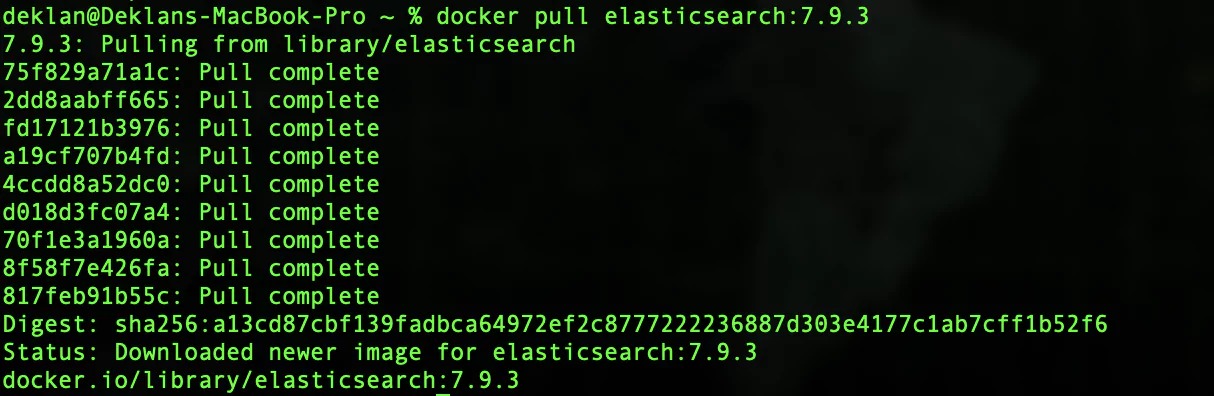


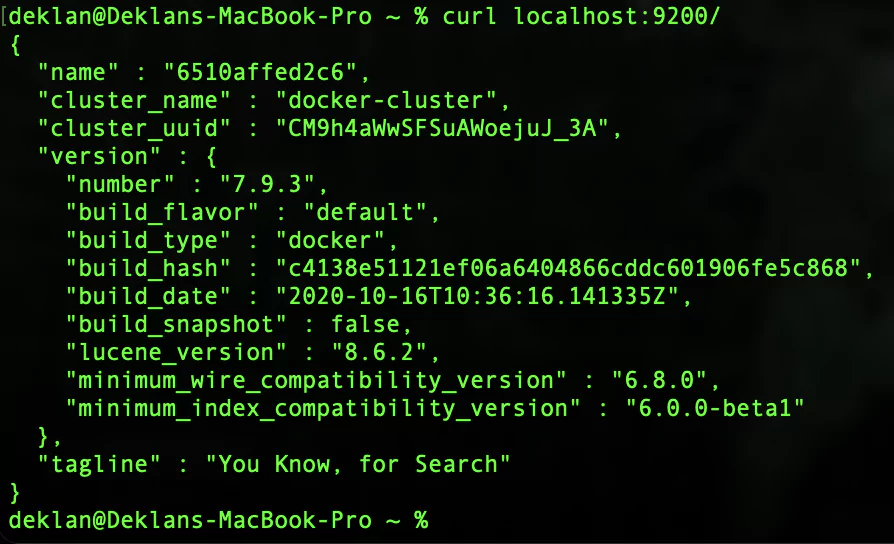
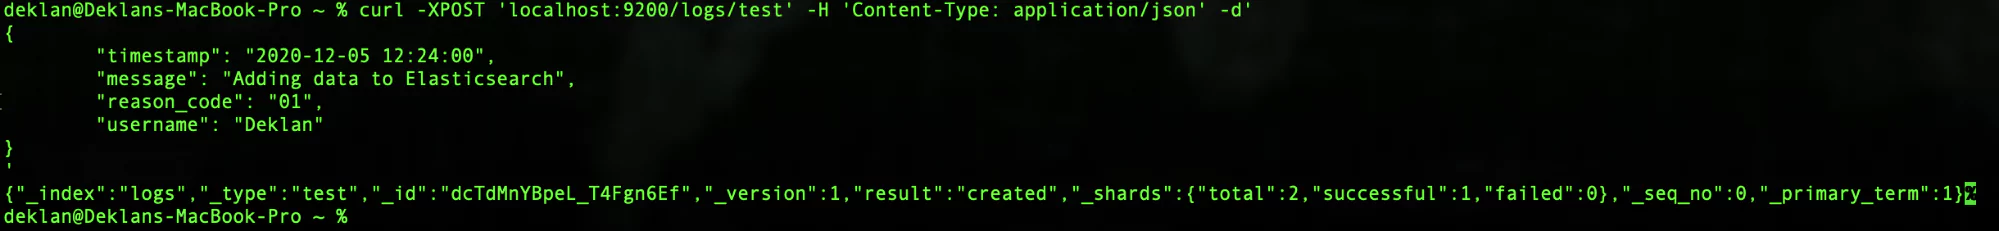
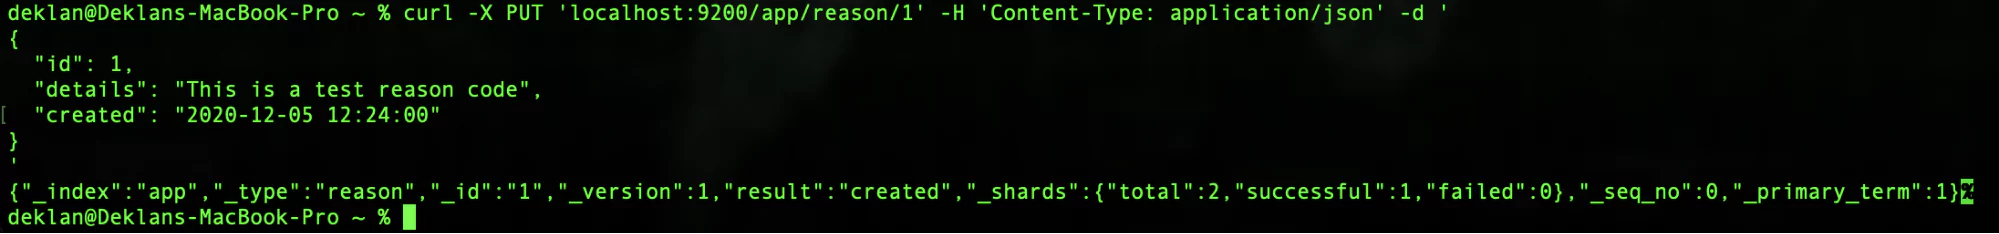
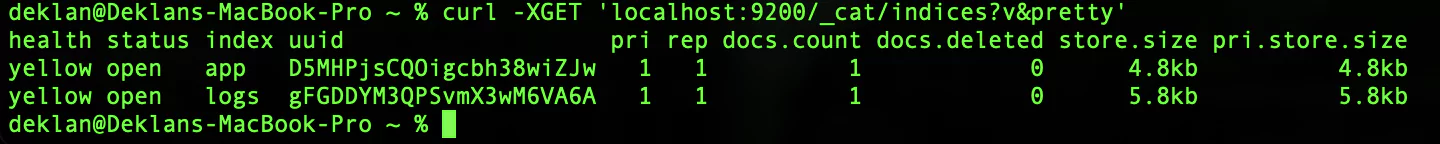
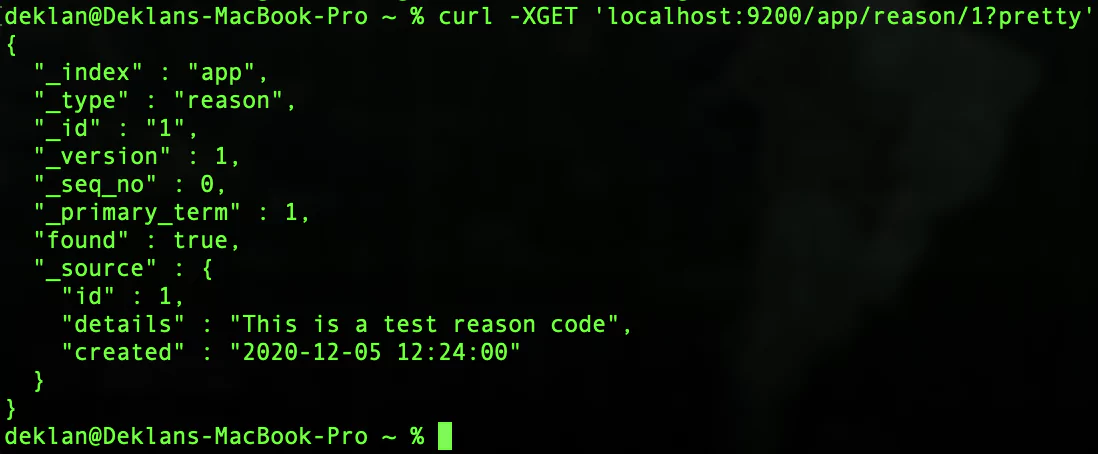
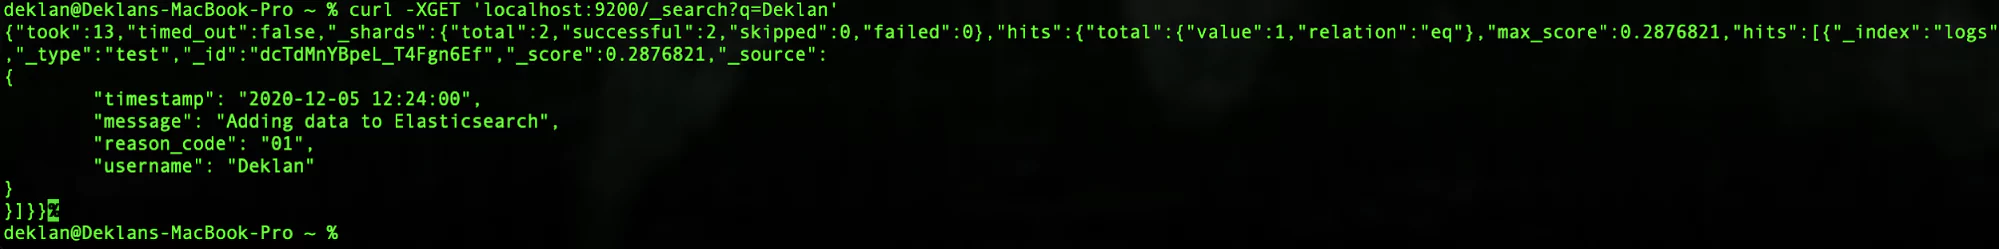
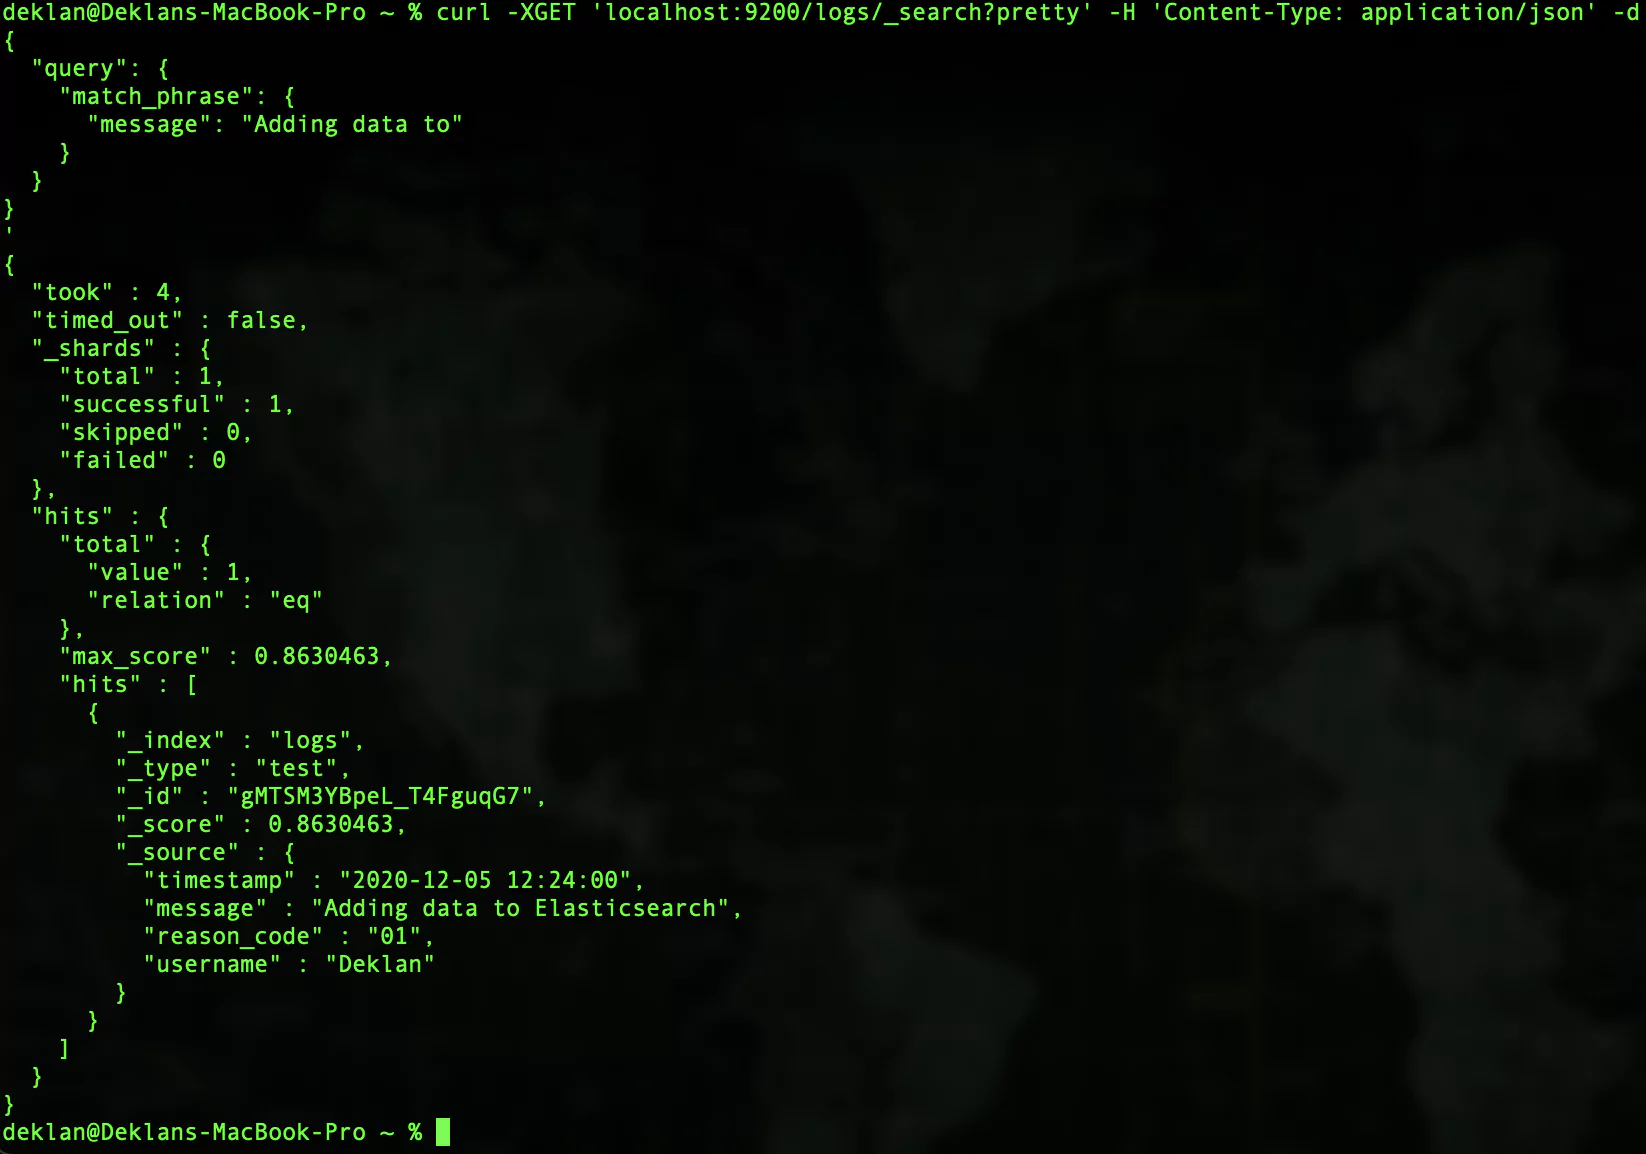
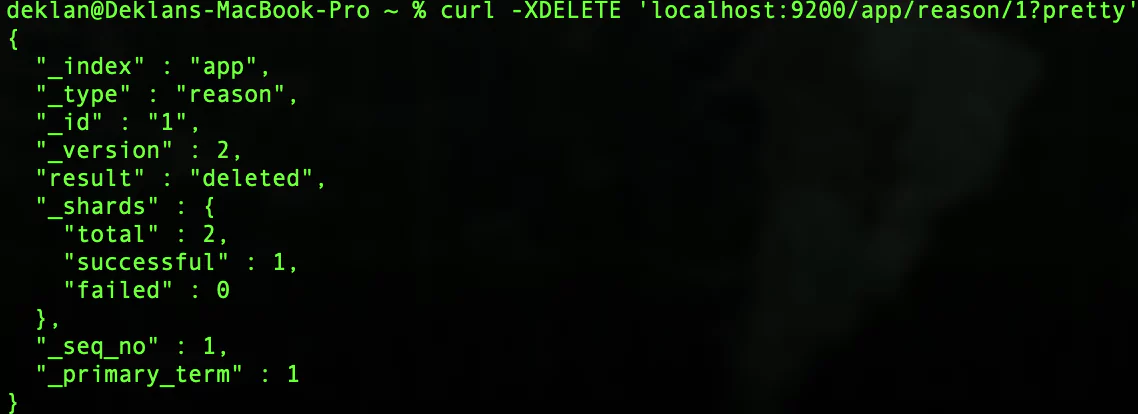
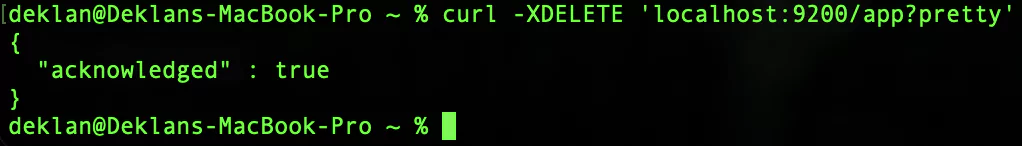
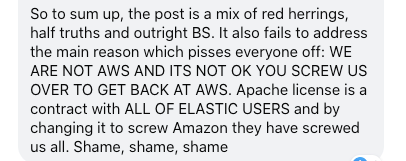


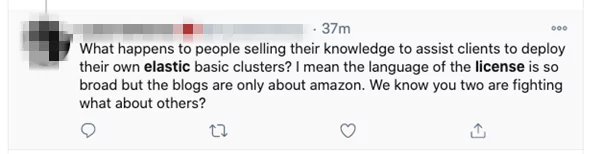

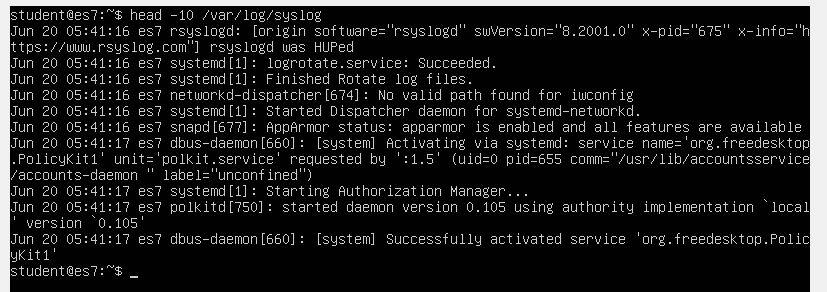
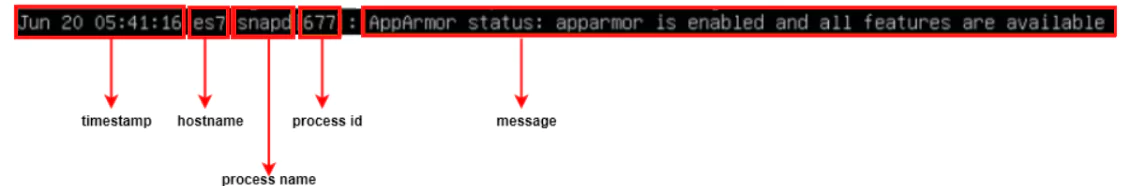
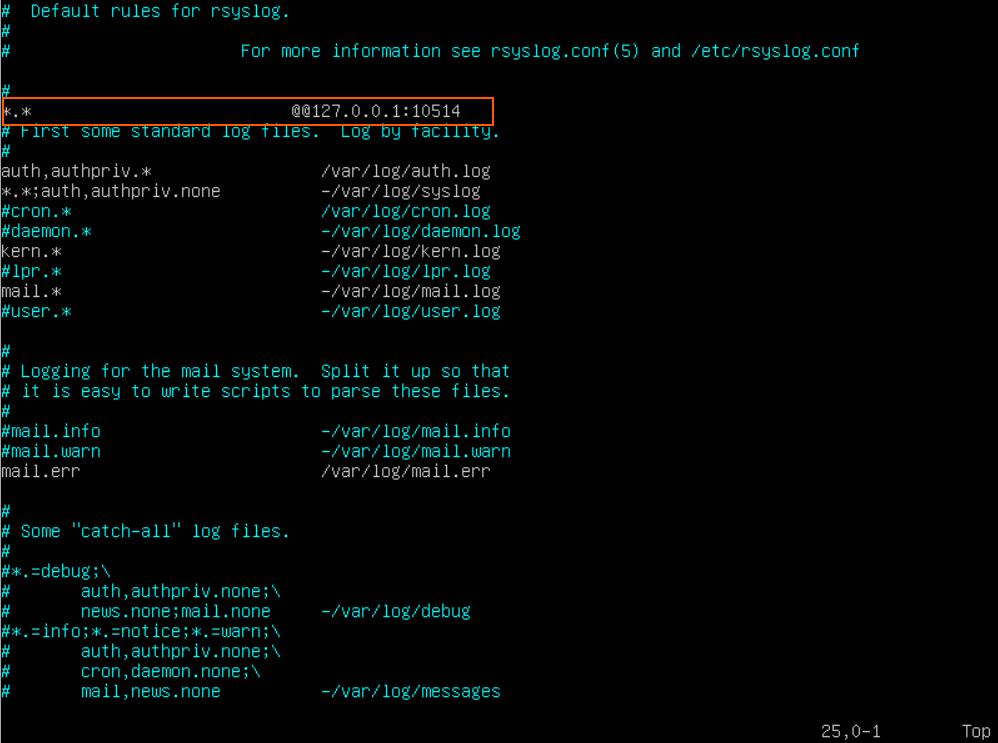
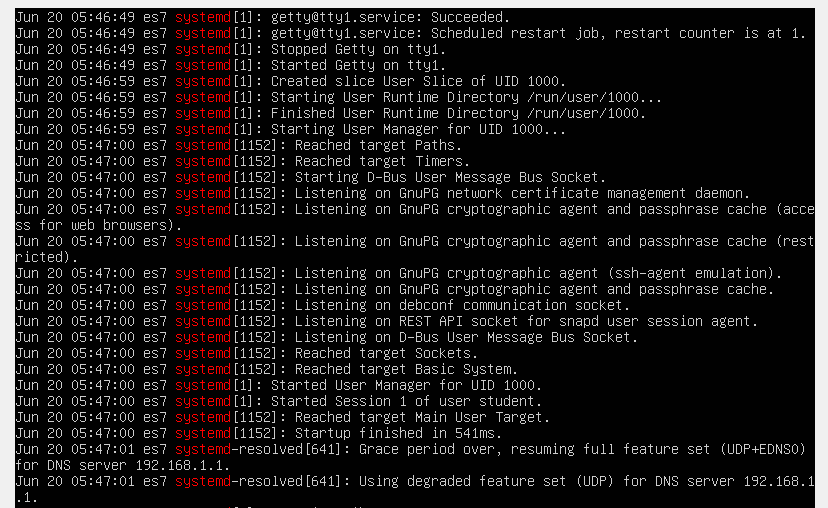
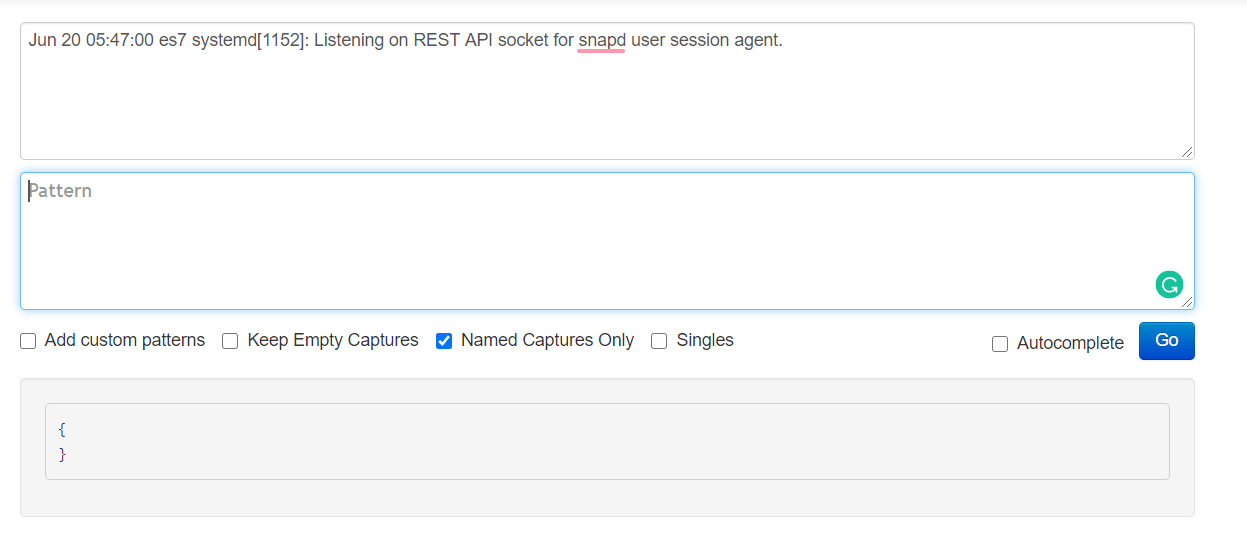
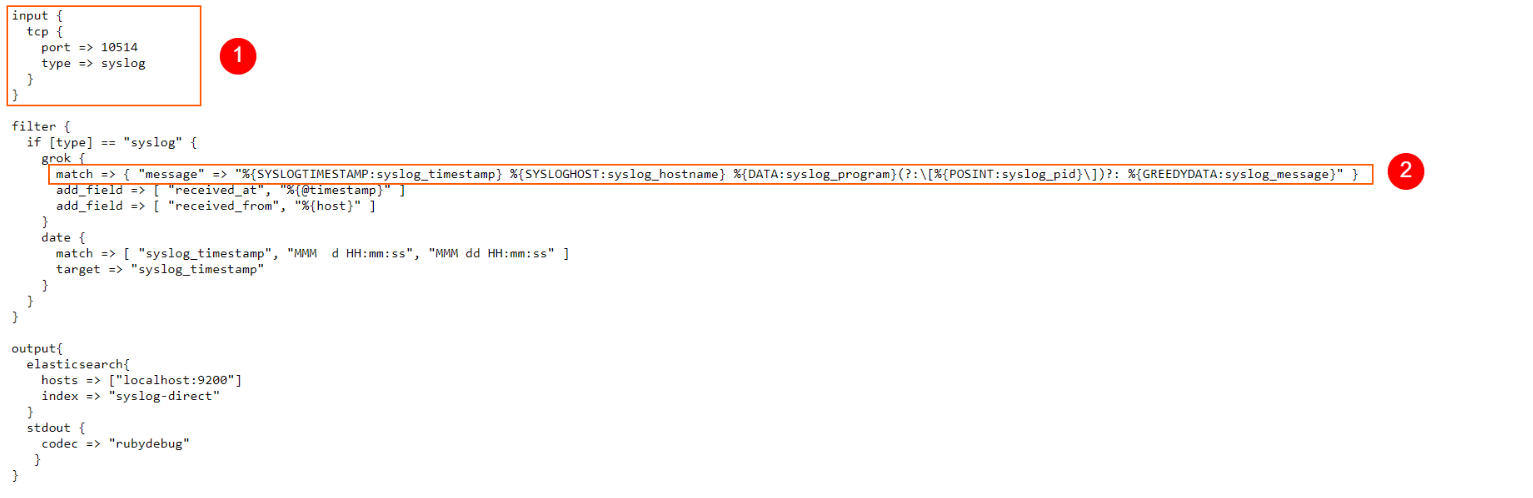
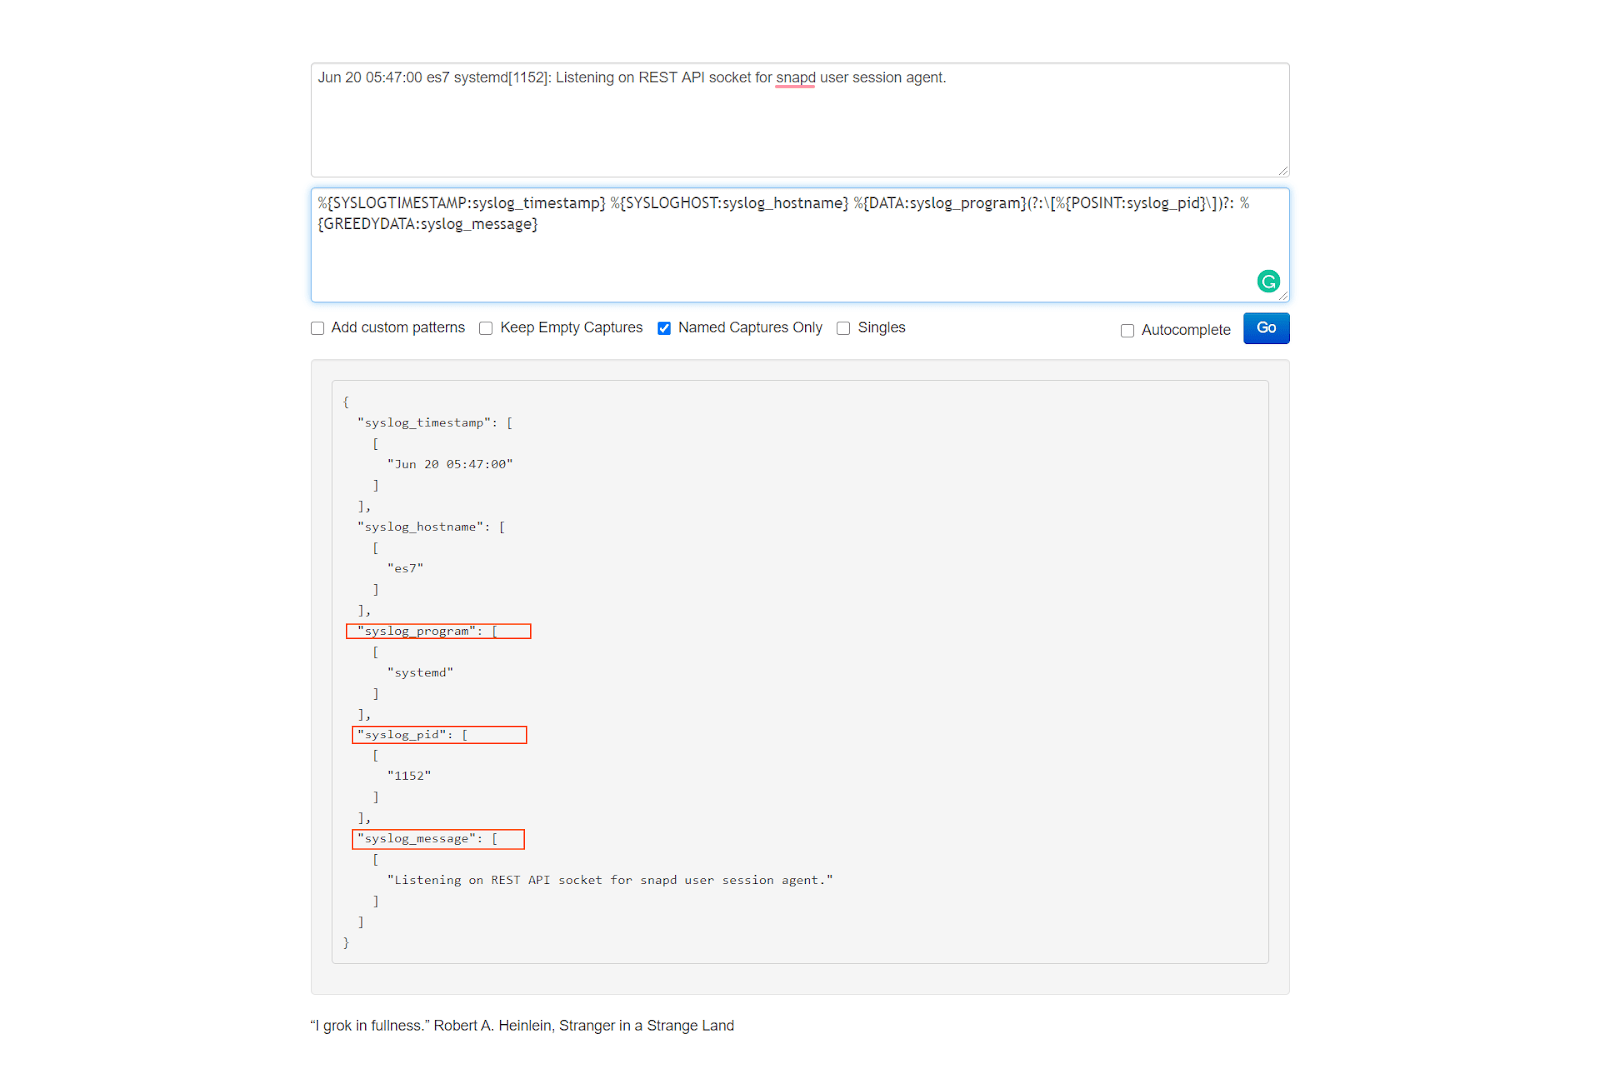
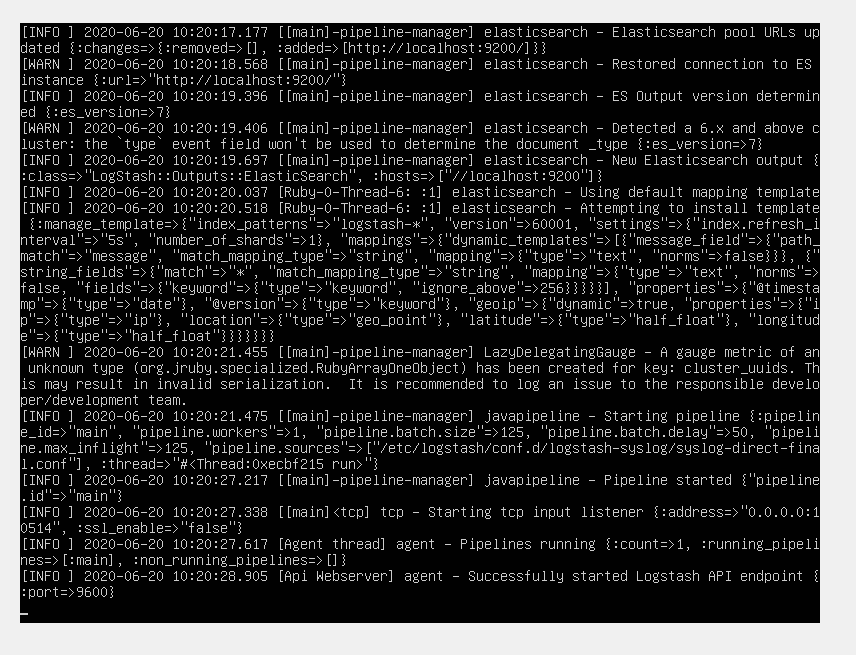
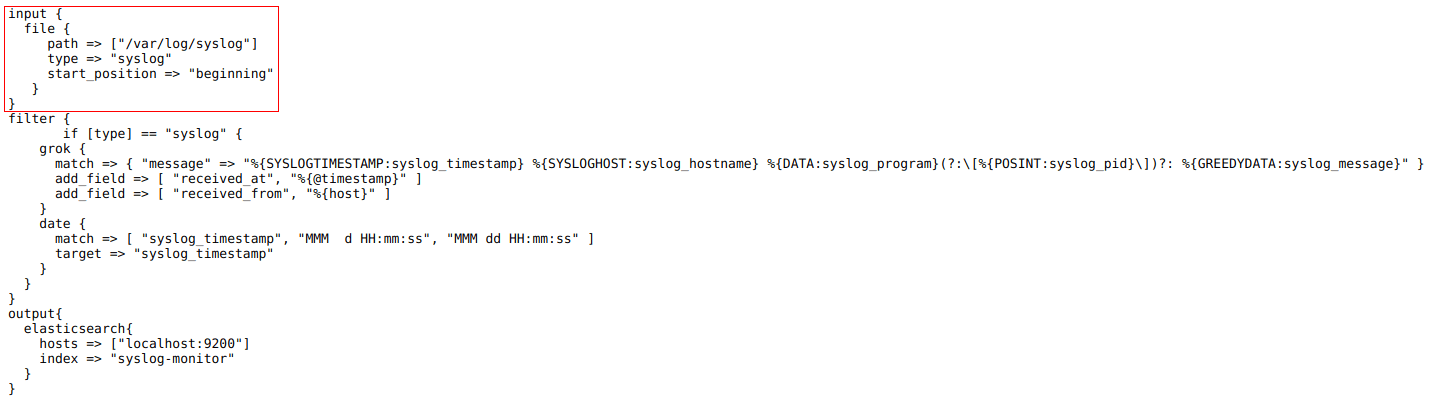


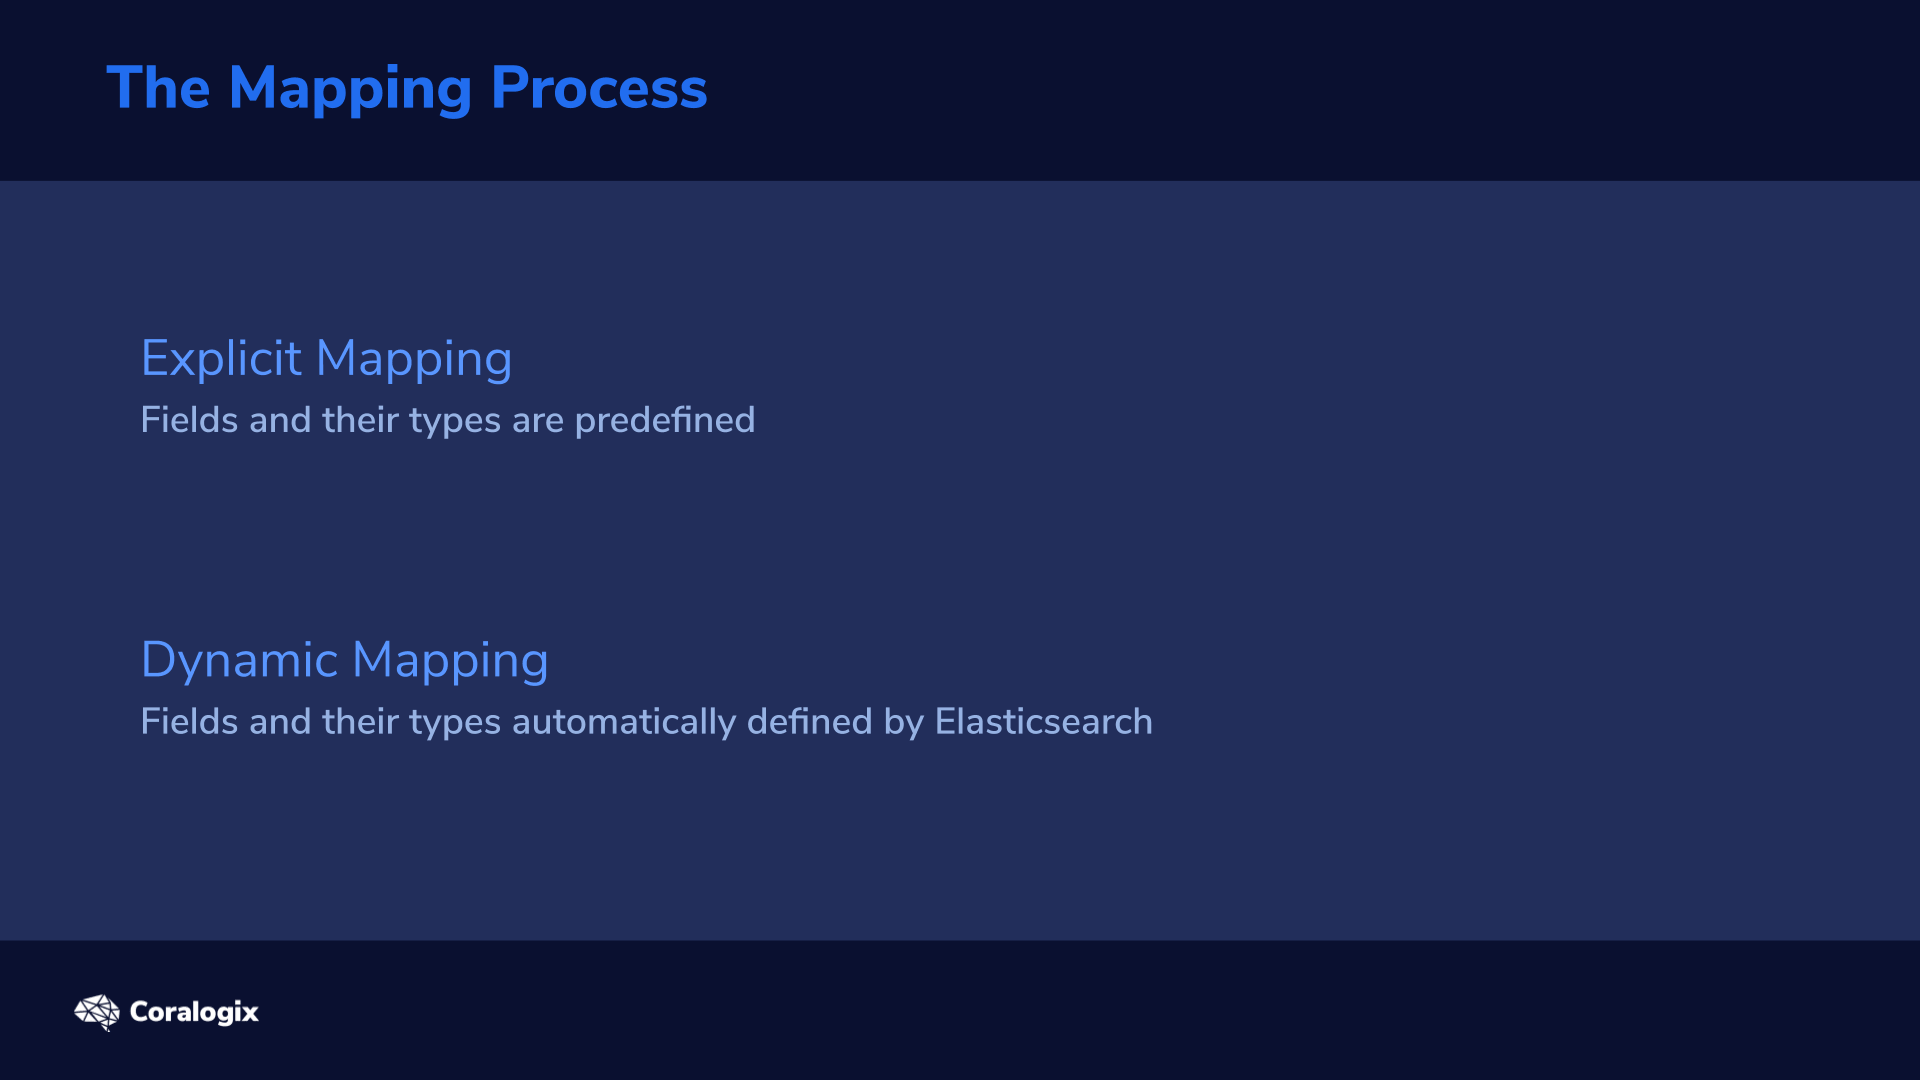
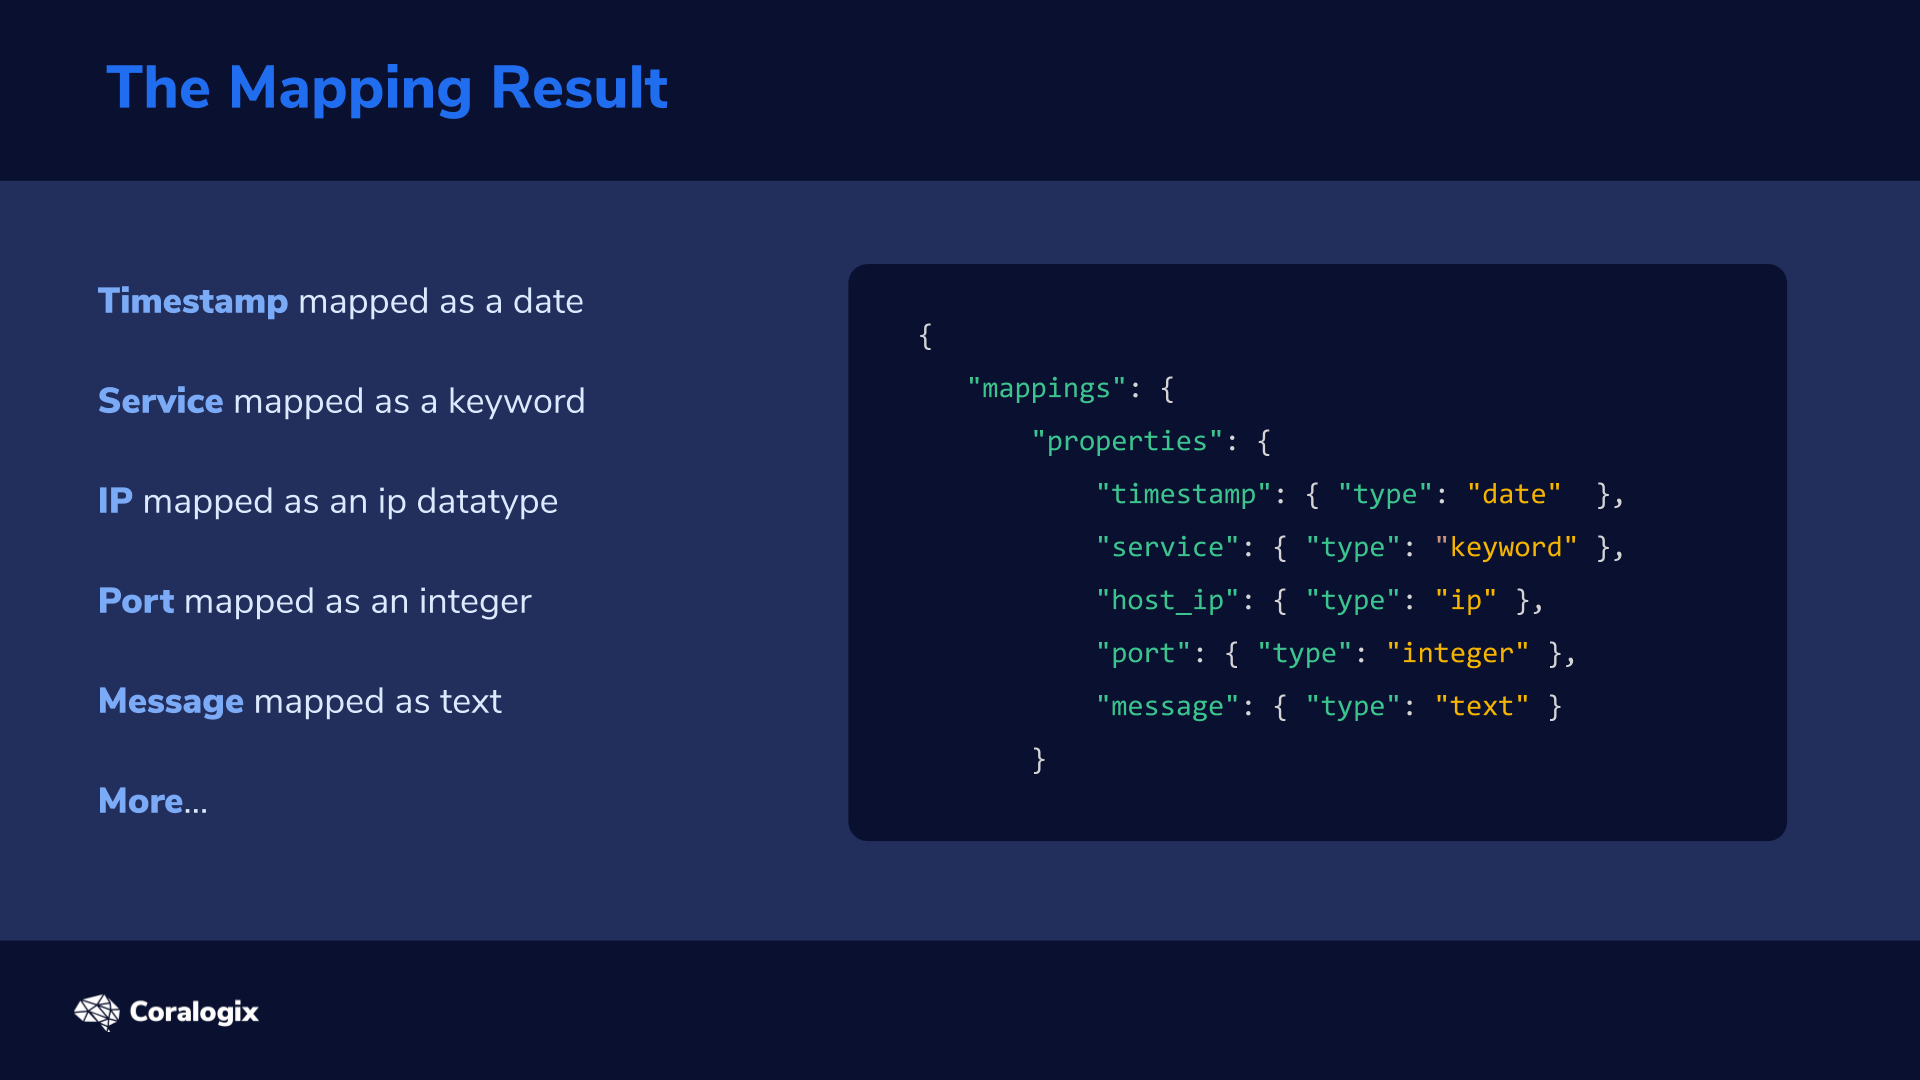
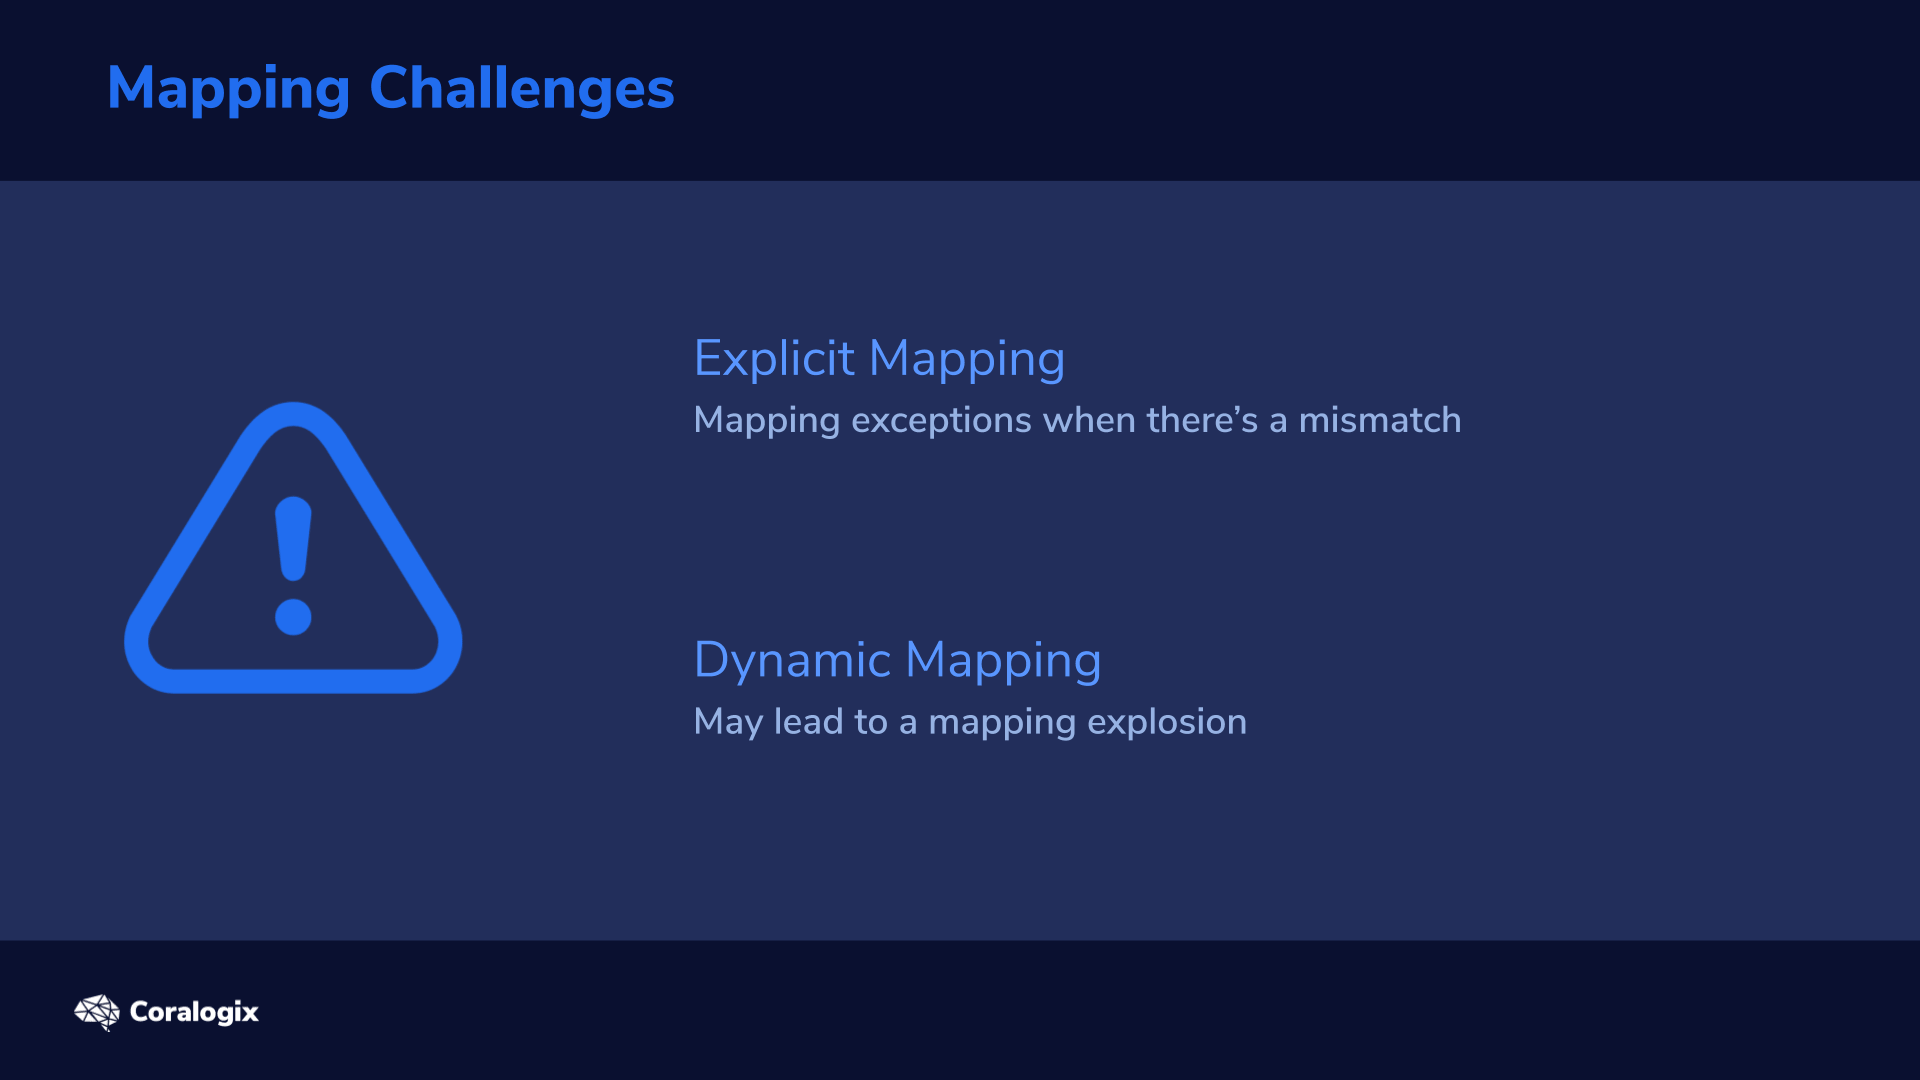