Extracting insights from log and security data can be a slow and resource-intensive endeavor, which is unfavorable for our data-driven world.
Fortunately, lookup tables can help accelerate the interpretation of log data, enabling analysts to swiftly make sense of logs and transform them into actionable intelligence.
This article will examine lookup tables and their relationship with log analysis. We’ll explore how lookup tables, in conjunction with a full-stack observability platform, extracts insights from logs, as well as dive into several practical use cases.
What are lookup tables?
A lookup table, or a reference table, is a specific type of data structure used to simplify data lookup operations. Lookup tables contain a set of values or information that can be used to quickly find corresponding values in another dataset.
They are especially useful for mapping one value to another, such as converting a code to a meaningful description. When it comes to log analysis, lookup tables can add relevant context to your logs, enhancing the efficiency, accuracy, and consistency of log analysis. This is particularly valuable when dealing with obscure or unclear log data that requires contextual information for users to understand any given situation and to take appropriate action.
Here’s several use cases where lookup tables can be applied for greater business efficiency and compliance.
Error code interpretation for faster root cause analysis and time to resolution
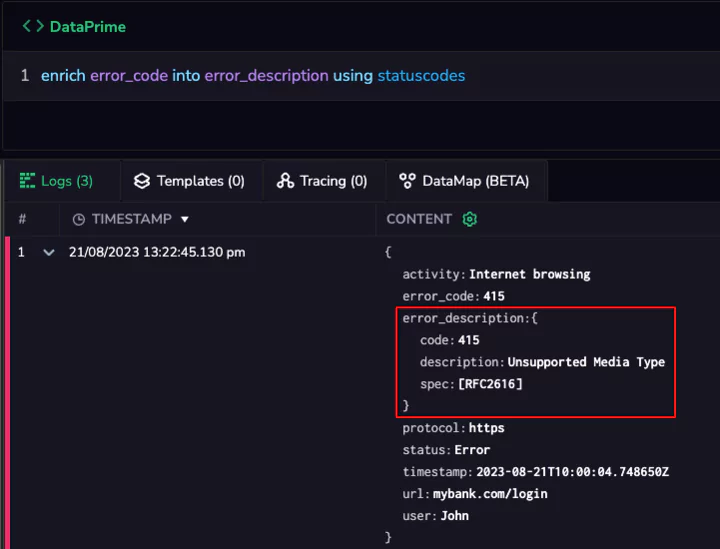
Logs often contain error codes or status indicators that need interpretation. With lookup tables, you can translate these codes into meaningful explanations to boost your observability, such as
enhanced troubleshooting, reduced downtime and improved system reliability.
Lookup tables also reduce the time and effort required for manual code interpretation. Furthermore, clear error code translations enable quicker time to resolution, leading to lower operational costs and enhanced customer experience.
In cloud environments, multiple users, teams, and applications interact with a diverse range of resources. These resources can include databases, VMs, storage buckets, and more.
Ensuring that only authorized users access specific resources is crucial for maintaining data integrity and security. Detecting unauthorized access quickly is paramount, as it can prevent potential data breaches, financial losses, and reputational damage.
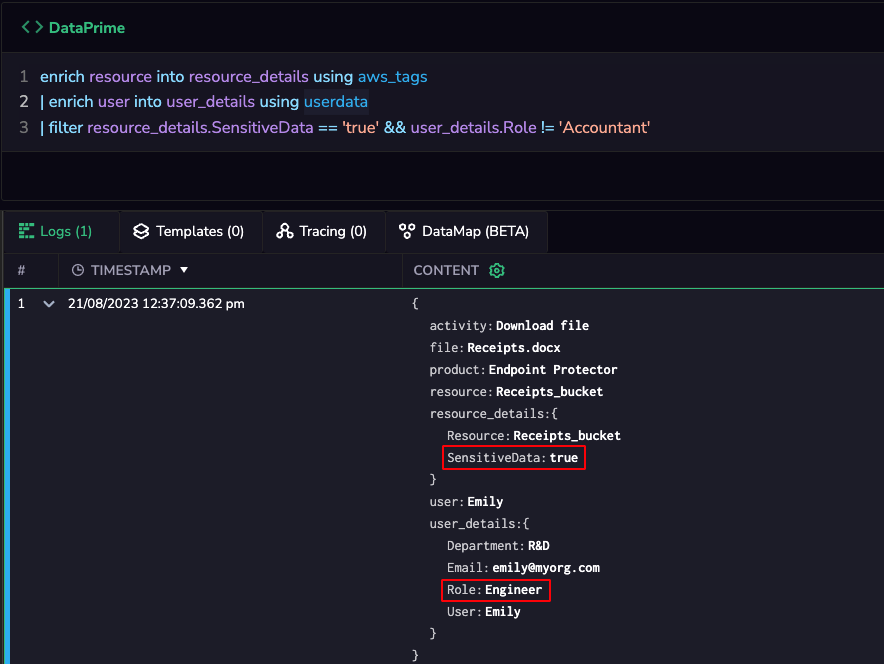
By incorporating information from lookup tables directly into log entries, you can provide analysts with more context, making it easier for them to identify and respond to unauthorized access attempts. For instance, if an analyst is reviewing log entries related to user interactions with cloud resources, the lookup table can bring context on the user role (e.g. based on identity store) and the sensitivity level of the cloud resource (e.g. based on AWS resource tags).
You’ll be able to quickly identify unauthorized access to sensitive data, improve your organization’s security posture and adhere to compliance requirements.
User behavior profiling for better product development and targeted marketing
Analyzing user behavior through logs can reveal patterns and preferences that guide product development and marketing efforts. Lookup tables can match user IDs with customer profiles, enabling deeper analysis and personalization – without wasting any time searching through extensive databases for each log entry.
By enhancing user behavior understanding, you can develop targeted and cost-effective campaigns while improving customer satisfaction.
Product SKU mapping for better inventory management and increased sales
E-commerce businesses can analyze log data to track product popularity, availability and customer buying patterns. Lookup tables that map SKU codes to product names enable efficient product performance analysis.
With instant access to product names based on SKUs, you can eliminate the need to query product databases repeatedly. As a result, you’ll be able to optimize inventory management, pricing strategies, and marketing campaigns, which can help increase revenue and reduce inventory costs.
Enhanced log analysis with Coralogix Lookup Tables
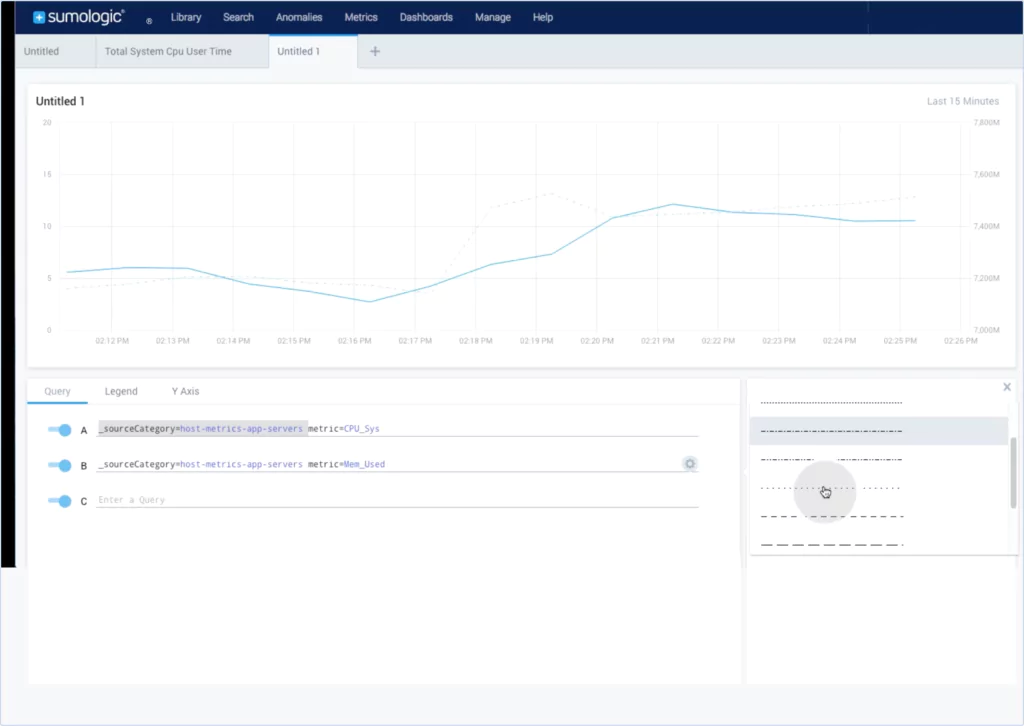
Coralogix’s next-generation query language, DataPrime provides users with a unique way to describe event transformations and aggregations.
Using DataPrime, map your logs dynamically to the relevant lookup table for any on-the-fly query. The lookup and enrichment can be done as part of your query even on logs that have already been ingested and stored.
The added fields can be used to further filter within the DataPrime query. For example, say you added a “Department” key. You can then filter the results by a specific value of “Department,” e.g. Finance.
Furthermore, with Coralogix Lookup Tables, the on-demand enrichment is available while viewing the specific query results or visualization without affecting the original log size. This helps optimize your overall observability costs.
Coralogix also offers log enrichment where during ingestion, the logs are automatically looked up, enriched and stored, for easy consumption anytime and anywhere (by any query and by third-party products that read the logs from the S3 bucket).
From production monitoring to security concerns, businesses need to know how to analyze logs on a daily basis to make sure their system is up to par. Here are the reasons why analyzing your log data is so important.According to Security Metrics, by performing log analysis and daily logging monitoring, you’ll be able to “demonstrate your willingness to comply with PCI DSS and HIPAA requirements, (and) it will also help you defend against insider and outsider threats.”
If you landed here, chances are you probably know what logs are, but we’ll start off with a short explanation of what it is. Typically, application logs capture timestamped data related to actions serviced by applications, decisions taken by applications, actions initiated by applications, and runtime characteristics of applications.
The analysis of log data, also known as data logging, is a process of making sense of computer-generated records (logs). This process helps businesses comply with security policies, audits or regulations, comprehend system troubleshoots as well as understand online user behavior. Businesses must review their logs daily to search for errors, anomalies, or suspicious activity that deviates from the norm. In fact, log analysis needs to interpret messages within the context of an application or system and map varying terminologies from log sources. It then turns them into a uniform terminology that sees to it that reports and statistics are clear.
So why is data logging analysis necessary? Well, here are some examples that will prove to you that it is not just important, but it is actually vital for any business that is looking to succeed, no matter the industry.
For Production Monitoring and Debugging:
Apps and systems are constantly growing in both size and complexity, and the use of logging platforms is now becoming a must for any growing business. By analyzing your key trends across your different systems, debugging as well as troubleshooting you’ll be able to create opportunities for improved operations on a smaller budget as well as new revenues. This is what Coralogix is all about: shortening the time a business needs to detect and solve production problems. The data, after all, is all there. It all depends on the ways in which organizations decide to utilize them to their advantage.
For Resource Usage:
When it comes to your system performance, often your software is not at fault, but rather your requests of the server are those that cause an overload your system has trouble dealing with. Tracking your resource usage will enable you to understand when the system is close to overload, so you’ll be able to prevent it from happening by adding additional capacity when needed.
For HTTP Errors:
A common use of log analysis is searching for HTTP errors. Through your analysis, you’ll be able to understand your HTTP errors, and on what pages they occurred so you can fix the problem and essentially prevent yourself from losing potential clients.
For Slow Queries:
By analyzing your log data, you’ll be able to detect when users are not getting the information they need or if this data is taking too long to load. By tracking slow queries, you’ll be able to see how your DB queries are performing and guarantee your user’s experience is up to par.
For Rogue Automated Robots:
If you’re under a DNS attack in which someone hammers your site to break your servers, your log data analysis will reveal a lot of useful information regarding your attackers. Your analysis will even be able to assist you in blocking them from accessing your site by their IP address. Search engine spiders are able to discover many errors that may not be noticed by your users but need to be promptly addressed.
“Logging can be a security administrator’s best friend. It’s like an administrative partner that is always at work, never complains, never gets tired, and is always on top of things. If properly instructed, this partner can provide the time and place of every event that has occurred in your network or system.”
Analyzing your logs regularly will allow your business a quicker response time to security threats and better security program effectiveness.
For Tracking Your Site’s/Platform’s Visitors:
Log data analysis will help you understand not only how many visitors have entered your site.platform, but on what pages they spent the most time, what they were doing on your site.platform, why there are changes in the number of visitors, etc. Trends and patterns like this will help you identify opportunities. As stated by Dave Talks, “examples include when to release a new version or product, when to send out a mailing or announcement, when to take down your website to test your new shopping cart, when to offer discounts, and much more.”
In short, analyzing your log data means you’ll be able to catch errors before your users have discovered them. Since your business is dealing with a vast amount of log data generated by your systems, using an ML-powered log analytics software is the best solution you could make if you don’t want to spend your time reviewing logs manually.
It’s been an exciting year here at Coralogix. We welcomed our 2,000th customer (more than doubling our customer base) and almost tripled our revenue. We also announced our Series B Funding and started to scale our R&D teams and go-to-market strategy.
Most exciting, though, was last September when we launched Streamaⓒ – our stateful streaming analytics pipeline.
And the excitement continues! We just raised $55 million for our Series C Funding to support the expansion of our stateful streaming analytics platform and further our storage-less vision.
Streamaⓒ technology
Streamaⓒ technology allows us to analyze your logs, metrics, and security traffic in real-time and provide long-term trend analysis without storing any of the data.
The initial idea behind Streamaⓒ was to support our TCO Optimizer feature which enables our customers to define how the data is routed and stored according to use case and importance.
“We started with 3 very big international clients spending half a million dollars a year for our service, and we reduced that to less than $200,000. So, we created massive savings, and that allowed them to scale,” CEO Ariel Assaraf explains. “Because they already had that budget, they could stop thinking about whether or not to connect new data. They just pour in a lot more data and get better observability.”
Then we saw that the potential of Streama goes far beyond simply reducing costs. We are addressing all of the major challenges brought by the explosive growth of data. When costs are reduced, scale and coverage are more attainable. Plus, Streamaⓒ is only dependent on CPU and automatically scales up and down to match your requirements so we can deliver top-tier performance in the most demanding environments.
What’s next for Coralogix
Moving forward, our goal is to advance our storage-less vision and use Streamaⓒ as the foundation for what we call the data-less data platform.
There are two sides to this vision. On the one hand, we have our analytics pipeline which is providing all of the real-time and long-term insights that you need to monitor your applications and systems without storing the data. On the other hand, we’re providing power query capabilities for archived data that hasn’t ever been indexed.
So, imagine a world where you can send all of your data for analysis without thinking about quotas, without thinking about retention, without thinking about throttling. Get best-in-class analytics with long-term trends and be able to query all the data from your own storage, without any issues of privacy or compliance.
With this new round of funding, we’re planning to aggressively scale our R&D teams and expand our platform to support the future of data.
Thank you to our investors!
We’re proud to partner with Greenfield Partners, who led this round, along with support from our existing investors at Red Dot Capital Partners, StageOne Ventures, Eyal Ofer’s – O.G. Tech, Janvest Capital Partners, Maor ventures, and 2B Angels.
We have a lot of ambitious goals that we expect to meet in the next few quarters, and this funding will help us get there even faster.
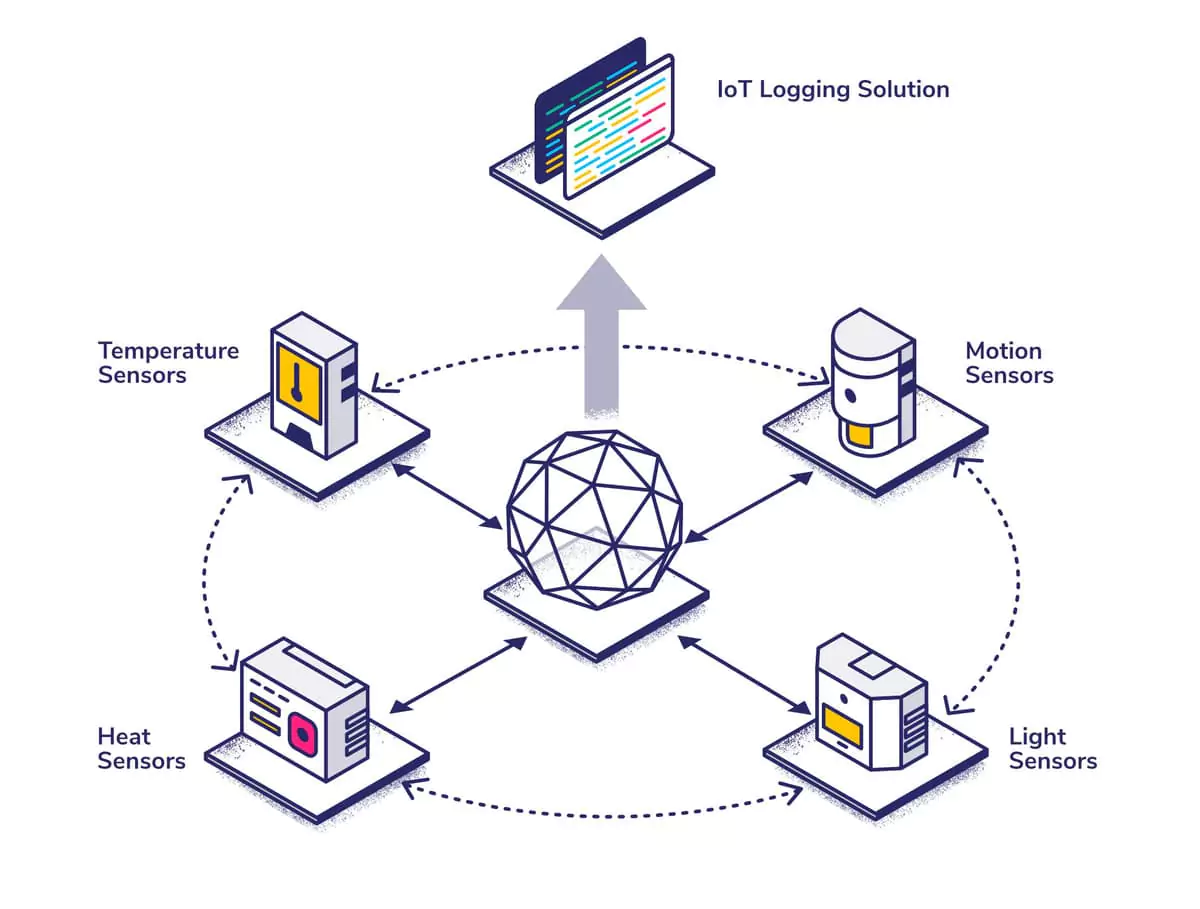
The Internet of Things (or, IoT) is an umbrella term for multiple connected devices sharing real-time data, and IoT logging is an important part of this. Troubleshooting bug fixes, connection problems, and general malfunctions rely heavily on logs, making them an invaluable asset not only in designing systems but also in system maintenance.
To maximize system potential, this plethora of generated data needs to be managed efficiently. In this post, we’ll look at the different types of logs involved in IoT logging, different storage options and some common issues you may face.
Types of Logs
IoT logging has many different flavors. Some are asynchronous and need to be stored only periodically whereas others need to be synchronous to ensure device uptime. Below are some of the many types of logs involved in IoT logging.
Status Log
Status logs show the state of the device and whether it is online, offline, transmitting, or in an error state. They are important to give the user a holistic picture of the general state of the device(s). They’re usually stored and sent in frequent and regular intervals.
Error Log
Error logs are more specific than the status log and should generally trigger an alert for monitoring purposes. Errors mean downtime and that should be avoided. A good error log should provide contextual information such as what caused the error and where it occurred (a particular line of code, for instance). Error logs are usually asynchronous and sent whenever there is an error (provided internet connectivity has not been hindered).
Authentication Log
Authentication logs enable you to see if a registered user(s) is logged in or not. It may be unfeasible to store each login attempt (as end-users might log in multiple times a day), but unsuccessful login attempts can be monitored to determine who is trying to gain access to the system/device.
Configuration Log
Device attributes are pertinent to keep track of in case of future updates and bug fixes. A configuration log helps track all the different attributes for various IoT devices. This may not be useful for the end-user but it could be of vital importance for developers. If the configuration only really changes with a software update then it is worth storing and retrieving configuration logs asynchronously (i.e., with each update or downgrade).
Memory Dump
If you have a software crash, a memory dump or crash dump is particularly useful to determine what went wrong and where. In Microsoft Windows terminology, a memory dump file contains a small amount of information such as the stop message and its data and parameters, a list of loaded drivers, the processor context for the processor which stopped, and so on.
IoT Logging Storage
Given that many of these IoT logging types are needed retroactively, the next question is about where the logs will be stored. You have two options here, local (on-device) storage or cloud storage. Both have their own merits and may be more or less suitable depending on the situation.
On-Device Storage
On-device storage of logs is a highly scalable approach, only in as far as the number of devices is concerned. It is not affected by the number of devices as each device saves its own logs on local storage. This also means that each device will need manual intervention if there is downtime or if it runs out of memory for log storage.
Furthermore, storing logs locally requires a physical connection to a remote computer or bridge for download/upload of data. This may impact user perception of the device and may not be possible if devices cannot be accessed easily or if there are many devices.
Cloud Storage
Cloud storage is the preferred option if you want immediate feedback and timely information about device status and performance. This approach is more scalable but relies on the existence of a fully functional log management system.
The log management system should be able to aggregate data from many heterogeneous devices transmitting in real-time and process, index, and store them in a database that facilitates visualization through charts, dashboards, or other means.
Common Problems with IoT Logging
With many devices transmitting data over potentially unstable connections, guaranteeing a certain level of Quality of Service (QoS) becomes a real challenge. If you cannot get vital information about device downtime promptly, then the QoS rapidly declines. Below are some commonly encountered logging issues that arise with IoT devices.
Network Dropping
Lack of internet connectivity is among the most commonly encountered IoT logging issues. There could be many reasons for this including network congestion, lack of bandwidth, poor connection with wireless devices, and firewall issues. Moving the device to an area with better Wi-Fi strength, an antenna upgrade, and limiting the simultaneous number of connections (MAC address filtering) can help solve some of these issues.
Log Buffering
Log buffering for IoT devices is important, especially in instances when the network drops. Determining the right size for your log buffer is just as important, as it can have serious implications when issues arise. A smaller log buffer saves storage, but will contain fewer log messages which can impact your ability to troubleshoot network issues.
Latency
Latency can have far-reaching consequences, especially when it comes to system maintenance. In cases where a cyclic status message is received a few hours late, it can impact your ability to correctly troubleshoot an issue. To get around this, the device latency can be calculated by subtracting the server latency from end-to-end latency. This can help illustrate if the problem is with the device or with the server.
Conclusion
IoT logging is a vital part of any system. Its function in system development and debugging cannot be understated. Using a centrally managed logging system for IoT devices has many advantages and can go a long way towards ensuring device downtime is kept to a minimum.
Coralogix provides a fully managed log analytics solution for all of your IoT logging requirements. Tools like Loggregation for log clustering, benchmark reporting for build quality, and advanced anomaly detection alerts are all features to help you run an efficient and stable IoT system.
Minimal downtime is one of the hallmarks of a great product/service and a functioning and Coralogix can help achieve it.
Log scaling is something that should be top of mind for organizations seeking to future-proof their log monitoring solutions. Logging requirements will grow through use, particularly if not maintained or utilized effectively. There are barriers to successful log scaling, and in this post we’ll be discussing storage volume problems; increased load on the ELK stack, the amount of ‘noise’ generated by a growing ELK stack, and the pains of managing burgeoning clusters of nodes.
Growing Storage Requirements
Capacity is one of the biggest considerations when looking at scaling your ELK stack. Regardless of whether you are looking at expanding your logging solution, or just seeking to get more out of your existing solution, storage requirements are something to keep in mind.
If you want to scale your logging solution, you will increasingly lean on your infrastructure engineers to grow your storage, better availability and provisioning backups – all of which are vital to support your ambitions for growth. This is only going to draw attention away from their primary functions, which include supporting the systems and products which are generating these logs! You may find yourself needing to hire or train staff specifically to support your logging aspirations – this is something to avoid. Log output volumes can be unpredictable, and your storage solution should be elastic enough to support ELK stack scaling.
If you’re reading this then it is likely you are looking at log scaling to support some advanced analytics, potentially using machine learning (ML). For this to be effective, you need the log files to be in a highly available storage class. To optimize your storage provisioning for future ELK stack requirements, look at Coralogix’s ELK stack SaaS offering. Coralogix’s expertise when it comes to logging means that you can focus on what you want to do with your advanced logging, and we will take care of the future proofing.
Increased noise in the logs
So you want to scale your log solution? Well you need to prepare for the vast volume of logs that a scaled ELK stack is going to bring with it. If you aren’t sure exactly how you plan to glean additional insights from your bigger and better ELK stack deployment, then it most certainly isn’t of much use.
In order to run effective machine learning algorithms over your log outputs, you need to be able to define what is useful and what is not. This becomes more problematic if you have yet to define what is a “useful” log output, and what is not. The costs associated with getting your unwieldy mass of logs into a workable database will quickly escalate. Coralogix’s TCO calculator (https://coralogix.com/tutorials/optimize-log-management-costs/) will give you the ability to take stock over what is useful now, and help you to understand what outputs will be useful in the future, making sure that your scaled log solution gives you the insights you need.
Load on the ELK Stack
Optimizing the performance of each of the constituent parts of the ELK stack is a great way of fulfilling future logging-related goals. It isn’t quite as easy as just “turning up” these functions – you need to make sure your ELK stack can handle the load first.
The Load on Logstash
You can adjust Logstash to increase parsing, but this increases the ingestion load. You need to ensure that you have allocated sufficient CPU capacity for the ingestion boxes, but a common Logstash problem is that it will hoover up most of your processing capacity unless properly configured. Factor in your ingestion queue and any back pressure caused by persistent queues. Both of these issues are not only complex in resolution, but will hamper your log scaling endeavours.
The Load on Elasticsearch
The load on Elasticsearch when scaled can vary greatly depending on how you choose to host it. With Elasticsearch scaling on-prem, failure to properly address and configure the I/O queue depth will grind your cluster to a total standstill. Of bigger importance is the compressed object pointer – if you approach its 32GB heap limit (although Elastic still isn’t certain that the limit isn’t even lower, elastic.co/blog/a-heap-of-trouble) then performance will deteriorate. Both of these Elasticsearch concerns compound with the volume or extent of ELK stack scaling you are attempting, so perhaps you should delegate this out to Coralogix’s fully managed ELK stack solution.
The Configurational Nuances of Log Scaling
Whilst forewarned is forearmed when it comes to these log scaling problems, you’re only well prepared if you have fully defined how you plan to scale your ELK stack solution. The differences and considerations for a small architecture logging solution scaling upward are numerous and nuanced: discrete parsing tier or multiple parsing tier; queue mediated ingestion or multiple event stores represent just a few of the decisions you have to make when deciding to scale. Coralogix have experience in bringing logging scalability to some of the industry’s biggest and most complex architectures. This means that whatever future proofing issues may present themselves, Coralogix will have seen them before.
Increased cluster size
The last tenet of log scaling to be mindful of is the implication of having larger clusters with bigger or more nodes. This brings with it a litany of issues guaranteed to cause you headaches galore if you lack some serious expertise.
Every time you add a node to a cluster, you need to ensure that your network settings are (and remain) correct, particularly when running Logstash, Beats or Filebeats on separate ELK and client servers.. You need to ensure that both firewalls are correctly configured, and this becomes an enterprise-sized headache with significant log scaling and cluster augmentation. An additional networking trap is the maintenance of Elasticsearch’s central configuration file. The larger the ELK stack deployment, the greater the potential for mishap in the config of this file, where the untrained or unaware will get lost in a mess of ports and hosts. At best, you have the possibility of networking errors and a malfunctioning cluster, but at worst, you will have an unprotected entrypoint into your network.
Scaling isn’t as easy as it sounds
Adding more nodes, if done correctly, will fundamentally make your ELK stack more powerful. This isn’t as simple as it sounds as every node needs to be balanced to run at peak performance. Whilst Elasticsearch will try and balance shard allocation for you, this is a “one size fits all” configuration, and may not get the most out of your cluster. Shard allocation can be manually defined, but this is an ongoing process that changes with new indices, new clusters and any network changes.
Where does Coralogix come in?
Coralogix are experts when it comes to log scaling and future proofing ELK stack deployments, dealing with shards, nodes, clusters and all of the associated headaches on a daily basis. The entire Coralogix product suite is designed to make log scaling, both up and down, headache free and fully managed.
Continuous Integration and Continuous Delivery (CI/CD) delivers services fast, effectively, and accurately. In doing so, CI/CD pipelines have become the mainstay of effective DevOps. But this process needs accurate, timely, contextual data if it’s to operate effectively. This critical data comes in the form of logs and this article will guide you through optimizing logs for CI/CD solutions.
Logs can offer insight into a specific event in time. This data provides a metric that can be used to forensically identify any issue that could cause problems in a system. But logs, especially in modern, hyperconnected ecosystem-based services, require appropriate optimization to be effective. The development of logging has generated a new approach, one that works to optimize the data delivered by logs and in turn, create actionable alerts.
Structured Logs Are Actionable
JSON effectively adds “life to log data”. It’s an open-standard file format that allows data to be communicated across web interfaces. Data delivered using JSON makes it easy to visualize and easy to read.
It can be filtered, grouped, tagged by type, and labeled. These features make JSON perfect for building focused queries and filtering based on two or more fields or zeroing in on a range of values within a specific field. At the end of the day, this saves developers. Also, it’s straightforward to transform legacy data into JSON format, so it really is never too late.
The Importance of Log Severity
A definition of the severity of a log is important to standardize across the organization. These levels act as a baseline for understanding what actions should be taken. Typical levels of severity for logs are:
Debug: describes a background event. These logs are not usually needed except to add context and analysis during a crisis. These logs are also useful when tuning performance or debugging.
Info: logs that represent transaction data, e.g. a transaction was completed successfully.
Warning: these logs represent unplanned events, for example, they may show that an illegal character for a username was received but is being ignored by the service. These are useful to locate possible flaws in a system over time and allow changes to improve system usability, etc.
Error: represent failures in processes that may not materially affect the entire service. These logs are useful when aggregated and monitored to look for trends to help improve service issues.
Critical: these logs should trigger an immediate alert to take action. A fatal log implies a serious system failure that needs immediate attention. Typically, in a day, 0.01% of logs would be defined as high severity.
5 Logging Best Practices
Once severity definition is resolved there are a number of best practices that further enhance the effectiveness of logging. These best practices facilitate the optimization of a CI/CD pipeline.
Log communication between components
Services are often ecosystems of interconnected components. All events in the system, including those that happen across the barrier between components, should be logged. The event lifecycle should be recorded, that is what happens at each component as well as during communication between components.
Log communications with external APIs
The API economy has facilitated the extended service ecosystem. But API events often happen outside your own organization. Optimized logging records what is communicated across the API layer. For example, if your offering uses a service such as SendGrid to send out communication emails to users, you need to know if critical alert emails are being sent? If not, this would need to be addressed. Log everything up to the point of sending to an API as well as logging the response from the other component to achieve a comprehensive view.
Add valuable metadata to your log
Modern service ecosystems, many stakeholders need access to logs. This includes Business Intelligence teams, DevOps, Support engineers, etc. Logs should include rich metadata, e.g. location, service name, version, environment name, and so on.
Log accessibility
You may not be the only one reading the logs. As companies scale, often access is needed by other stakeholders to change code, etc. Centralizing the log data becomes a necessity.
Combine textual and metric fields
Improve snapshot understanding of logs by having explanatory text (e.g., “failed to do xxx”) combined with metadata fields to provide more actionable insights. This offers a way to look at logs to see an at-a-glance view of the issue before drilling into performance data.
The Art and Science of Alerts
Logs are a leading indicator of issues and can be used for more than a postmortem analysis. Whilst metrics for infrastructure only presents an outcome of problematic code/performance, logs are the first encounter with code in use. As such, logs offer an easy way to spot things before they are felt at the user end. This is key to CI/CD enhancement.
Logs need to be accurate and have context (unlike metrics). Being able to make alerts specific and contextual is a way to tease out greater intelligence from the alert. Classification of alerts is a way to ensure that your organization gets the most from alerts and does not overreach.
Types of logging alerts:
Immediate alert: These alerts point to a critical event and are generated from critical and fatal logs. They require immediate attention to fix a critical issue.
“More than” alert: Sent out if something happens more than a predefined number of times. For example, less than 1 in 1000 people are failing to pay; if greater than 10 users are failing to pay the alert is generated. If these types of alerts are properly defined and sent to the right channel they can be acted upon and be highly effective.
“Less than” alert: These tend to be the most proactive alert type. They are sent when something is NOT happening.
If these alerts are channeled correctly, have context, and can be interpreted easily, they will be actionable and useful.
Coralogix goes further and adds further granularity to alerts:
Dynamic alert: Set a dynamic threshold for criteria.
Ratio alert: Allows an alert based on a ratio between queries
Alert Structure
Classification of alerts is one criterion; another is the alert structure. This ensures that alerts go to the right person(s). For example, is using Slack to collate alerts, a dedicated area can be set up to collate logging and metrics. The alerts can be then be directed to specific teams – this technique also helps alleviate alert fatigue.
To Push or Not to Push an Alert
The decision to push, or not, an alert, is an important aspect of creating an effective ‘alert culture’. Ask yourself certain questions: How would you feel if you received a specific type of alert at 2 am? What would you do? If you would be angered by getting this alert at that time, don’t push it. If, instead, your reaction is to say, “I must look at this tomorrow”, define the alert on your dashboard, but DO NOT push it. If the reaction is to stop what you are doing and respond – push the alert.
This simple logic can go a long way to making alerts actionable and workable and ends up reducing alert fatigue and keeping the team happy.
Summary
Coralogix is a full-stack observability platform that will drastically reduce logging costs but also improve your ability to query, monitor, manage log data, and to extend the log data value even further by turning logs into long-term metrics. Start a conversation with our logging experts today by clicking on the chat button on the bottom right corner, or start a free trial.
In this survey of over 200 CIOs in the US, the IDC analyses the critical role played by Log Analytics in any modern infrastructure.
IDC Opinion
To effectively manage modern IT environments, organizations are reliant on their ability to gain actionable insight from machine-generated data. Log monitoring, collection and analysis of log data has long been a common practice for achieving operational visibility. However, traditional log analytics solutions were not designed to handle the huge volume and variety of log data generated by enterprises today, driven by the massive adoption of cloud, mobile, social media, IoT devices, AI, machine learning, and other data-intensive technologies. Thus, organizations are faced with challenges such as mounting costs of log data storage, integration difficulties, multiple false positives, the need for customizations, and manual querying and correlation.
According to a recent IDC survey, 50% of all organizations process more than 100GB of log data of different formats per day, and the numbers continue to rise. Given that, IDC believes that the next generation of log analytics should offer advanced analytics and correlation capabilities as well as improved performance to keep up with scaling demands, leveraging the cloud to provide access to innovative technologies in a cost-effective manner. Based on these capabilities, log management can have a pivotal role in streamlining modern software development practices such as DevOps and CI/CD.
Methodology
This study examines the role of log management and analytics in modern IT environments. To gain insight into log management requirements, preferences, priorities, and challenges, IDC conducted a survey with 200 IT decision makers in enterprises of all sizes in key industries in the U.S.
Situation Overview
Since the very early days of computing, organizations have used log data generated from their IT environments for various operational needs such as monitoring and troubleshooting application performance and network problems, investigating security incidents, improving customer experience, and more. While log data plays an increasingly important role across a range of use cases, capturing and acting upon it has become a significant challenge.
Traditionally, the collection of log data was done using homegrown scripts, which involved time- and labor-intensive manual processes. With the transition from monolithic applications to distributed multi-tiered architectures, this approach became practically infeasible.
In response, the first generation of log management tools emerged to automate the processes of collecting, storing and managing logs. Still, making sense out of the data remained an issue. Users had to know exactly what to look for and make their own correlations to get the results they wanted. As IT environments continued to grow in scale and complexity, log management solutions offered new functionalities such as the ability to run queries to retrieve events based on keywords, specific values or values within a specific range, visualization of data to facilitate search, and more. Although early log management solutions required specialized skills such as knowledge of vendor-specific search languages and techniques for framing log-specific inquiries, they were very useful in times when IT environments used to consist of systems developed by a relatively small number of suppliers.
Today, to keep up with the ongoing transformation of the IT industry, log management should take another leap forward.
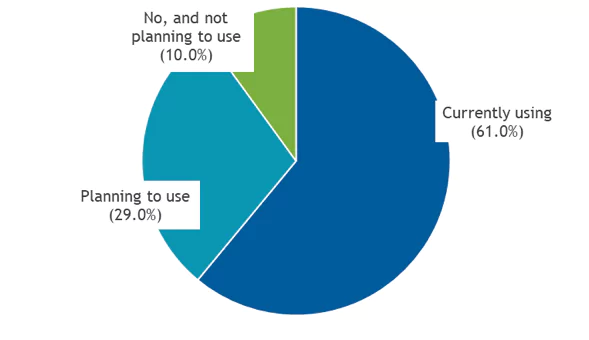
Over the years, log management achieved mainstream adoption. According to a recent IDC survey, 90% of organizations of all sizes are either using or planning to use a log management solution. Adoption is particularly strong among software vendors (around 98% are currently using or planning to use) and financial services companies (90%).
Figure 1
Log Management and Analytics Adoption
Does your organization use, or is it planning to use, any tool or solution to manage log data?
Note: N = 180 Source: IDC, 2019
Log Management and Analytics Challenges
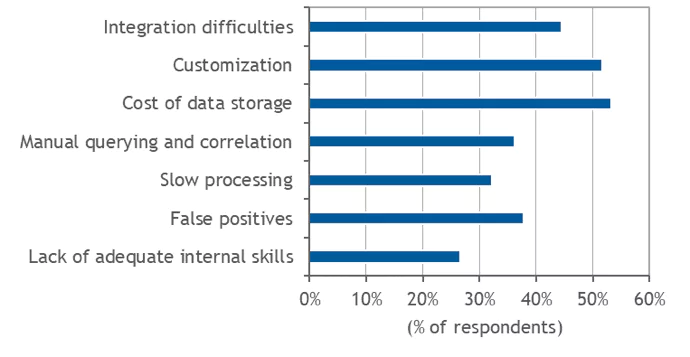
Despite the extensive use of log management, IDC’s survey revealed that many organizations are still struggling with different issues that compromise their ability to convert log data into actionable insights. In particular, the participants in the survey highlighted cost of data storage (mentioned by 53.33% of respondents), customization (51.67%) and integration (44.44%) as top concerns.
Figure 2
Log Management Challenges
What are the biggest challenges related to effective use of log management across your organization?
Note: N = 180 Source: IDC, 2019
The challenges experienced by the survey participants reflect the difficulties of operating modern IT infrastructures that continue to grow in scale and complexity. Moreover, the emergence of containers, microservices and serverless computing architectures that are based on autonomous interactions between independent single-function modules via APIs, is drastically increasing the number of moving parts that must be constantly monitored.
Traditional log management solutions were not designed to handle the huge amounts of log data flowing in from these chaotic IT environments, which can explain the above mentioned difficulties. For example, lack of effective scaling leads to mounting storage costs; and manual-intensive efforts are made to compensate for the lack of automation and integration capabilities. Other challenges mentioned by a relatively high proportion of respondents – including high rate of false positives, the need for manual querying and correlation, and slow processing – provide further evidence of the technical shortcomings of traditional solutions.
How Much is Too Much Data?
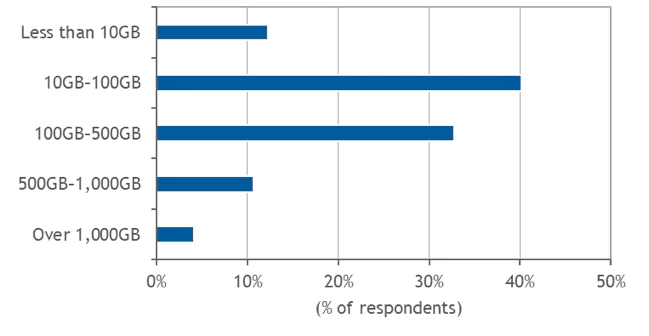
The amounts of log data collected and managed by organizations are overwhelming. According to IDC’s survey, nearly 50% of all organizations process more than 100GB of log data per day. In some industries, and especially in highly regulated sectors where data must be retained and protected for compliance purposes, data volumes are significantly higher. For example, 15.15% of financial services companies process more than 1,000GB (1TB) of log data per day.
Figure 3
Amount of Log Data Processed per Day
How much log data does your log management solution process per day?
Note: N = 180 Source: IDC, 2019
Log Diversity in the Workplace
Unlike structured data – such as data kept in relational databases or contained within enterprise applications like ERP and CRM – log data is mostly unstructured. As each system or application generates logs in its own format, and often uses its own time format, data must be transformed into a common structured format before it can be queried and analyzed. Driven by the proliferation of intelligent, sensor-based systems and IoT devices, new types of log data are constantly being added to this mix.
The diversity of log data often leads to operational issues. For example, due to the difficulty of achieving a unified view of logs collected from multiple different sources using traditional solutions, organizations are often required to manually search and correlate disparate data sets – an error-prone and labor-intensive process.
Log Analysis Paralysis:
While collecting and searching through logs is more difficult due to the increased size and diversity of datasets, organizations have become dependent on their ability to analyze operational data.
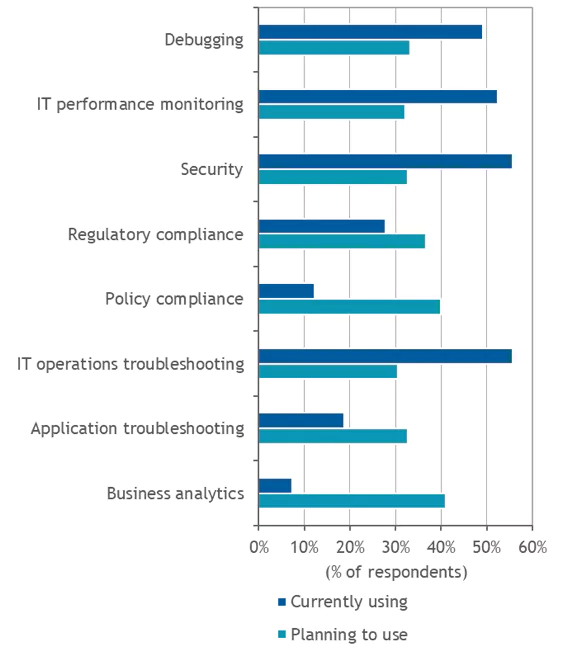
IDC’s survey provided a clear indication of the growing importance of log analytics. While IT operations troubleshooting and security remain the most common use case for log management, business analytics was the primary use case for companies that plan to use a log management solution in the next 12 months. The growing reliance on log analytics puts more emphasis on the need to automatically integrate and correlate different types of data from different sources to achieve comprehensive and accurate visibility, and the ability to detect and resolve problems quickly.
Figure 4
Log Management Use Cases
What are the use cases for your organization’s log management solution?
Note: N = 180 Source: IDC, 2019
Next-Generation Log Management and Analytics
IDC’s survey demonstrated the importance of gaining real-time operational intelligence from machine-generated data. To address this need, log management solutions should evolve to tackle the above mentioned challenges of scalability, format diversity, lack of automation, and perhaps most importantly – offer advanced analytics capabilities.
In this regard, Artificial intelligence (AI) machine learning (ML) analytics are key technologies that can be used to identify anomalies, help teams focus on what matters most, optimize processes such as log clustering (the grouping together of related logs to facilitate search), correlation and alerting, and more. As depicted above, integration with other IT management systems is also essential for log management solutions in order to achieve comprehensive visibility across different environments and uses cases.
Log management is seeing rising demand from organizations of all sizes and industries. Cloud deployment options are therefore required to provide organizations – and particularly ones that lack the expertise or resources to implement and maintain complex in-house systems – with access to advanced functionalities. At the same time, given the amounts of log data delivered over the cloud, next-generation solutions should be designed to scale on-demand to avoid network congestion and data access latency.
Log Analytics Across the CI/CD Pipeline
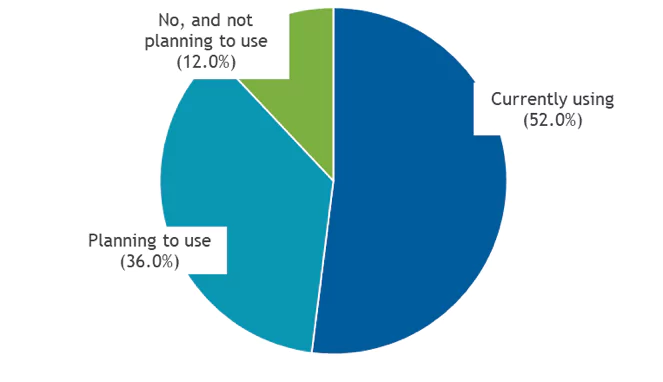
Another important requirement of next-generation solutions is the incorporation of log management and analytics into continuous integration/continuous deployment (CI/CD) processes. CI/CD is now a common method for bridging once-siloed development and operations teams and processes, creating streamlined delivery pipelines that support the rapid pace of changes. In accordance, 52% of the participants in IDC’s survey are already using CI/CD methodologies, while additional 36% are planning to use CI/CD in the near future.
Figure 5
CI/CD Adoption
Does your organization use, or is it planning to use CI/CD methodology?
Note: N = 200 Source: IDC, 2019
While having a CI/CD pipeline is a growing necessity in today’s dynamic, software-driven IT environments, it also introduces new challenges. As things get more complex, gaining insight into every stage of the delivery pipeline – for every version release – is more difficult. To measure the quality of software versions in a more accurate and timely manner, organizations often combine log data analysis with other methods including, test automation and metrics.
Metrics allow for measuring the functionality and performance of applications or services, typically through the establishment of thresholds for operational indicators such as CPU and memory utilization, transaction throughput, application response time, errors, etc.; as well as various business indicators. Continuously collected at regular intervals, metrics can be used for identifying trends and potential issues over time, as well as events, i.e. deviations from thresholds that point to unusual occurrences at specific time that need further investigation or analysis.
The combination of open source log analysis with different monitoring methods can help development, application support, site reliability engineering (SRE), DevOps and operations teams address various issues across all stages of the CI/CD pipeline, from design to release. Next-generation log management and analytics solutions can play a key role here, enabling organizations to make sense of huge amounts of operational data in various formats and obtain a unified and comprehensive view of the IT environment.
Coralogix Company Overview
Coralogix is a full-stack observability platform provider that aims to facilitate log data management and accelerate problem resolution with automation tools and machine learning algorithms. The solution, which launched the first version in 2015, is based on the open source ELK stack coupled with proprietary algorithms and advanced enterprise features.
To reduce the time wasted searching through logs to solve issues, Coralogix automatically clusters multiple logs are into a handful of shared templates without the need for configurations. The company has developed ML capabilities in order to model the normal behavior of environments and services and the flows in between, to automatically alert users to unnatural deviations.
For example, new errors are automatically identified as soon as they appear for the first time, or when a combination of logs that are expected to arrive in a particular sequence deviates from the expected flow. These capabilities should result in less time spent creating and managing alerts manually. The ML-assisted approach also has the effect of surfacing otherwise unknown issues before they drastically affect the customer experience.
To support the increased velocity of releases in CI/CD practices, Coralogix automatically generates version benchmark reports upon every release or environmental change. These reports let teams know how the software quality compares to previous versions in terms of new errors, higher error ratios, or new broken flows.
Coralogix is available as software-as-a-service with licensing based on the size of daily logs ingested and the retention period chosen. It includes quick integrations with the majority of clouds, servers, applications, frameworks, log files, platforms, containers, systems and databases available.
Coralogix has introduced several new features over the past 12 months, including threat intelligence by enriching logs based on reputational IP blacklists, quota usage management tools to save on cost, and volume anomaly detection which triggers an alert when a trend of errors or bad API responses is detected in one of the system components.
Coralogix is a good option to consider for midsize and enterprise businesses requiring a scaled and secure centralized logging solution for log management and analytics, compliance, and monitoring, as well as white glove support services which comes handy when facing more complicated integrations and setups.
Essential Guidance
The results from IDC’s survey demonstrate that despite the mass-scale adoption of log management solutions, organizations struggle to extract insight from the ever-increasing amount and diversity of machine-generated data. The survey highlighted customer concerns over cost of data storage, the need for customizations and integrations and other challenges that point to the limitations of traditional solutions. To tackle these issues and obtain continuous and comprehensive monitoring of modern IT environments, organizations should seek to leverage advanced log analytics across various use cases and as part of their CI/CD and DevOps pipelines.
International Data Corporation (IDC) is the premier global provider of market intelligence, advisory services, and events for the information technology, telecommunications, and consumer technology markets. IDC helps IT professionals, business executives, and the investment community make fact-based decisions on technology purchases and business strategy. More than 1,100 IDC analysts provide global, regional, and local expertise on technology and industry opportunities and trends in over 110 countries worldwide. For 50 years, IDC has provided strategic insights to help our clients achieve their key business objectives. IDC is a subsidiary of IDG, the world’s leading technology media, research, and events company.
From production monitoring to security concerns, it’s critical for businesses to analyze and review their log data. This is particularly true for large and enterprise companies, where the sheer amount of data makes log analysis the most efficient way to track key indicators. CTOs, in particular, are dealing with the challenges of this massive amount of data flowing through their organization, including how to harness it, gather insights from it, and secure it.
When it comes to the best platforms for log analysis and security information and event management (SIEM) solutions, 3 trivial Elk Stack alternatives come up: Splunk, Sumo Logic, and ELK.
Choosing which of these big guns to go with is no easy task. We’ll look at these top three platforms, including their advantages and disadvantages, and see who comes out the winner.
What is Splunk?
Splunk Enterprise is a platform to aggregate and analyze data. With Splunk, you can automate the collection, indexing, monitoring, and alerting functions when it comes to your data to control and leverage the information flowing into your business.
Scheduled searches let you create real-time dashboards and visualizations (offering both XML and drag-and-drop style customization options for visualization), while scheduled reports enable you to run and share reports at various intervals. In terms of support and community, Splunk hosts Splunkbase, which has thousands of apps and add-ons.
The platform has the functionality to be used by experts as well less technically-inclined users. It scales well – with the ability to scale up to unlimited amounts of data per day – and has built-in failover and disaster recovery capabilities.
In addition to the self-hosted Splunk Enterprise, there is also the Splunk Cloud option, where Splunk is deployed and managed as a service.
The pros of Splunk
Splunk is good at what it does, which is primarily fast consolidation of logs to be able to search data and find insights.
The cons of Splunk
The biggest concern with Splunk is the complexity of setting it up and maintaining it. It has a relatively steep learning curve and can take time to get going properly and manage on an ongoing basis. The other major issue to be aware of is pricing, which can be quite high.
Understanding Splunk’s pricing
Splunk Enterprise starts at $173 per ingested GB, is quoted per month. It is billed annually, and includes standard (not premium, though this is available) support.
What is Sumo Logic?
Sumo Logic is a cloud-native, machine data analytics service for log management and time series metrics. With the service, you can build, run and secure your AWS, Azure, Google Cloud Platform, or hybrid applications.
How does Sumo Logic compare with Splunk?
The biggest difference when compared with Splunk is that Sumo Logic is built for the cloud; even though Splunk now offers its Splunk cloud option, Sumo Logic’s architecture is built around cloud usage.
This means integrations are smoother, particularly when it comes to platforms such as AWS; scalability is built-in, there is no need for constant updates, and getting started is quicker and easier than with Splunk.
The pros of Sumo Logic
Sumo Logic is easy to use and has all the advantages of being a SaaS solution, such as scalability, getting up and running quickly, and so on. Some people like the UI, while others prefer the other offerings’ look and feel.
The cons of Sumo Logic
Sumo Logic lacks some of the extended features of Splunk, particularly when it comes to the Splunk Enterprise offering. There have been complaints about Sumo Logic’s speeds when searching older data, its customer service, and its pricing being on the expensive side. Sumo Logic also lacks some of the community support of Splunk and particularly ELK.
Understanding Sumo Logic pricing
The Sumo Logic Enterprise platform starts at $150 per GB per month, with an annual commitment required. If you want the full support package, it’s an optional add-on to this package.
What is ELK?
ELK is the world’s most popular log management platform. The ELK Stack is made up of three different solutions, all of them open-source: Elasticsearch, Logstash, and Kibana.
Elasticsearch is a search engine based on Lucene that provides a distributed, multitenant-capable full-text search engine with an HTTP web interface and schema-free JSON documents. Logstash collects, parses, and stores logs, and Kibana is a data visualization tool. Also included as part of the stack is Beats, a platform for lightweight shippers that sends data from edge machines to Logstash and Elasticsearch. With the addition of Beats, ELK Stack became known as the Elastic Stack.
With ELK, you can reliably and securely ingest data from any source, in any format and search, analyze, and visualize it in real-time. Being open source, it’s been rigorously tested by the large ELK community and is trusted by companies such as Sprint, Microsoft, eBay, and Facebook.
The pros of ELK
ELK consolidates three mature components to form one powerful solution. Being an open source tool, there are numerous benefits that come with the adoption of ELK. In general, there has been a tremendous movement towards open source, particularly for enterprises.
Open source solutions come with a lot of control, where you aren’t tied to a rigid way of doing things, and open source tools, especially ones like ELK/Elastic Stack, bring with them a vibrant community of contributors, testers, and fellow users who can contribute to your success.
The cons of ELK
If you are setting up yourself, it can be challenging to set up and maintain. Most users go with a solution that handles the setup for them.
Understanding ELK’s pricing
ELK is free (if you are using the open source version without X-pack).
Which platform is the best?
Given our significant combined experience with all of these platforms, deciding which one to pick had to be carefully weighed up. The functionality and feature set of Splunk, the simplicity and cloud-native advantages of Sumo Logic, and the open source design and robust nature of ELK.
A winner had to be chosen, and based on all of our research and experience, it had to be ELK – thanks to its vibrant community, the fact that it’s constantly improving and evolving faster than its competitors, has better JSON format support, is easier to use and get started with, and of course, comes in at a much lower price.
This is despite its drawbacks – the standard versions of it lack alerting, anomaly detection, and integrations into the development lifecycle – overall, however, it stands above the others as an all-round tool.
Being on top of your logs is critical, whether it’s for production monitoring and debugging, security purposes, resource usage, or any other of the multitude of key business functions log analysis supports.
With Coralogix’s platform, you can know when your flows break, automatically cluster your log data back into its original patterns so you can view hours of data in seconds, see all of your organization’s key indicators at a glance, and a whole lot more.
Interested in finding out more about how your organization can benefit? Check out Coralogix to see how we can help.
Long gone are the days were software companies released a version every six months, after rigorous planning, testing and stress runs (AKA the waterfall model). Today, agile companies release versions on a daily basis, to numerous servers, deployed on the cloud. Their software is composed out of many open source technologies and often supports a large customer base which keeps growing and challenging the production.
The main challenge of today’s agile software companies is to maintain a high level of quality to their application, despite the fact that they continuously add new code to their production which most often than not will not be tested on a live stream of data.
One of the best ways to understand what your production is doing is the application logs that your software emits, due to that reason, many companies arose to the challenge and offered a log monitoring service which allow companies to sift through their log entries and investigate problems.
The real problem begins when you have dozens of servers emitting millions of records, from different data sources. Sure, you’ll be able to view, search and query the data, but what should you search for? How can you be alerted on problems you never thought about? How can you view millions of logs in the limited time you have? Your code and logs are changing constantly, your production deals with an ever changing work load and the app logic is getting ever more complexed.
We already concluded that an old fashion QA will not help with the above case; too many tests to define, too many code changes, too many live servers, too many logs to sift through and so little time. To deal with this problem, one needs to approach the issue in a whole different mindset, we at Coralogix defined this mindset as Delivery Assurance – DA.
Delivery Assurance
‘Delivery assurance’ is a concept which incorporates the entire application delivery lifecycle, including the Build cycles, continuous integration, version release and production monitoring. The concept mandates that all the building blocks of the application’s lifecycle send event data to a centralized hub, once the data is collected, the hub is required to learn the normal behavior of the application delivery lifecycle, and alert when something goes out of bounds.
The described Hub is exactly what we at Coralogix are striving to build: A service which taps into various data sources, whether it’s log data, pipeline events, configuration management events, or APM insights, and automatically understands the application’s baseline.
That way, Coralogix can provide automatic insights in the context of versions or other external events without the need to define any rules or static thresholds.
Moreover, Coralogix helps companies understand their version’s health immediately after they were released and compare any two versions or points of time in order to find discrepancies between them.
To summarize; Today’s agile software world is filled with new and exciting technologies, but it comes with a price, this price is an ever growing complexity of systems and amount of data, one needs to change his mind set in order to truly deliver quality products to their customers, we believe that ‘Delivery Assurance’ is that change in mindset.
Whether your team is currently using an Agile approach to manage its enterprise monitoring software development or has yet to institute a formal project management system, implementing enterprise DevOps solutions is a necessary step to take if maximizing the efficiency of your operations and development teams is a priority for your organization.
Knowing where to begin, however, can be a challenge.
This is particularly true when it comes to implementing major organizational changes in the enterprise environment. To help you get started, here are the key steps your organization needs to take to take the leap towards becoming a ‘DevOps shop’.
Essential components for implementing enterprise DevOps
Core to these is provisioning tools, at all levels of the IT stack, to support the modular deployment of software to the production environment. DevOps builds on Agile’s central tenant of encouraging the quick deployment of modular development iterations, but places its central emphasis on removing constraints between the development and system administration/operations functions.
Matching the development and production build environments and ensuring that they operate cohesively rather than as silos allows for the continual updating of the code-base with far greater efficiency than would be possible if the philosophy were not implemented. Ensuring this, however, relies largely on streamlined workflows and automated processes, such as those designed by popular tools such as Puppet and Chef, being instituted between the two teams.
Some essential tools from the extensive DevOps landscape that should form part of this effort include infrastructure monitoring tools, such as Nagios, a log analytics platform, and automation servers such as Jenkins.
Ensure buy-in
Ensuring buy-in among the technical team, from CIO level downwards, is critical to ensure that the transition to a continuous delivery is a successful one.
Coordination must take place not only between development and operations (the latter is often concerned that the process will simply result in more buggy code being passed on to them), but also between the technical team and other business functions such as management and executive leadership.
Through providing for the continuous delivery of updates, DevOps should ensure the speedy adaptability and pivot-ability of the software being developed. The changes being queued for implementation can be driven, and re-prioritized, by everybody from senior management to the customer success team. It’s important to have the entire organization at least aware of what the new philosophy means in practical terms for the product’s life-cycle and evolution.
Commit for the long haul
Achieving DevOps is a long term process. Although certain metrics and KPIs can be monitored, assessing progress towards a full or at least satisfactory implementation of the philosophy takes time to measure and achieve.
Setting expectations on both the development and operations teams ahead of the initiation of the process is also fundamental to preempting any surprises that may arise as the teams move towards working in closer unison and aligning their work practices.
Operations team-members will have to provide developers with frequent updates as to how their code is performing under real-world operating conditions as encountered by end users.
Developers, in turn, will have to pay closer attention to how their output will function in a Cloud-based, distributed environment. Certain skills, such as logging analyzing log data, may for the first time become a shared concern.
Implementing DevOps change management methodologies is a significant undertaking that requires making extensive changes to an organization’s development structure. Executed correctly, however, the benefits of embracing this new way of performing version delivery are impossible to deny and result in significantly improved delivery of updated software to end-users.
With all the data available today, it’s easy to think that tracking website performance is as simple as installing a few tools and waiting for alerts to appear. Clearly, the challenge to site performance monitoring isn’t a lack of data. The real challenge is understanding what data to look at, what data to ignore, and how to interpret the data you have. Here’s how.
There are five common mistakes that administrators make when tracking website performance. Avoiding these mistakes does not require purchasing any new tools. In order to efficiently avoid these mistakes, you simply need to learn how to work more intelligently with the data visualization tools you already have.
Mistake #1 – Not Considering the End-User Experience
When it comes to things like response times, it’s easy to rely on “objective” speed tests and response logs to determine performance, but that can be a mistake. The speed that is often more important is the perceived speed performance, or how fast an end-user thinks the site is.
Back in 1993, usability expert, Jakob Nielsen pointed out that end users think a 100 millisecond response time is instantaneous and that a one-second response time is acceptable. These are the kinds of measurements you must make, to accommodate end-users, and not rely solely on “backend” data.
Mistake # 2 – Letting Common Errors Obscure New Errors
Common errors, by definition, make up the bulk of the weblog data. These errors occur so often that it’s easy to ignore them. The problem occurs when among a large number of common errors hides a new, unique error that gets missed because of all of the “noise” around it.
It is important that your website performance monitoring tool has the ability to quickly identify these “needles in a haystack.” Short of that, it is essential that the long trail of common errors be mined for new errors. This can give valuable clues to forthcoming performance problems.
Mistake # 3 – Ignoring Old Logs
It’s easy for IT folks to not want to go back and investigate older logs, say greater than one year, but that can be a mistake. Being able to go back and evaluate large quantities of older data, using simplifying techniques such as log patterns or other graphical means, can give great insight. It can also help highlight a slow-developing problem that could easily get missed by strictly focusing on the most recent results.
When establishing site performance monitoring policies, make sure they specify enough historical data to give you the results you need. Assuming you use a site management tool that can accommodate large data sets, it’s better to err on the side of too much data than not enough.
Mistake # 4 – Setting the Wrong Thresholds
Website performance tracking is only as good as the alert thresholds set. Set them too high and you miss a critical event. Set them too low and you get a bunch of false positives which eventually lead to ignoring them.
The reality is that some servers or services being monitored are more prone to instantaneous or temporary performance degradation. This is enough to trigger an alert, but not sufficient to bring it down, and could be due to traffic load or a routing issue. Whatever the reason, the only way around this is trial and error. Make sure you spend the time to optimize the threshold levels for all your systems to give you the actionable information you need.
Mistake #5 – Only Paying Attention to Critical Alerts
The sheer volume of site performance data makes it natural to want to ignore it all until a critical alert appears, but that can be a mistake. Waiting for a critical alert may result in a system outage, which could then impact your ability to meet your Service Level Agreements, and possibly even lead to liquidated damages.
Rarely do systems fail without giving some clues first. It is imperative that you mine your existing data to develop a predictive ability over time. You also need to understand which site performance metrics are worth paying attention to before it costs you any money.
There you have it. Five mistakes to avoid when monitoring website performance. Not more data, but more intelligent use of existing data.
Machine data is growing at a fast pace, which presents significant problems. By definition, it is not readily available to be analyzed, but we are here to help you out and fix that problem. First, let’s see what the 4 main issues are:
Logging Problem #1 – You just can’t analyze!
Logs to almost everyone are a pile of Crap Big Data that nobody wants to touch, and everyone hopes will magically analyze themselves. But it just doesn’t work that way. Extracting key metrics or trends in your system is like finding a needle in a haystack if you don’t have the right log monitoring tools.
In the past tools have tried to help Mr. IT get a grip on the behemoth of Data, but he only usually got a simple or very complex search and retrieved query, which is great, if you know what you are looking for. You often don’t even know something is wrong. What about troubleshooting? Let’s take this one step further – what about troubleshooting before the problem arises? The answer, soon…
Logging Problem #2 – Key Events, Where are you???
As mentioned above, knowing what to look for is the issue, if not the biggest problem in log management. You can be the king of all query languages but if you don’t know what you are looking for you might as well throw darts at a wallpaper of printed out logs. Even if you do have alerts it wouldn’t matter because they were created by someone that found a bug once a million years ago, but what about the one that is happening right now? (Relax, there aren’t any bugs in your system right now… or are there?) Again, the answer will soon be revealed.
Logging Problem #3 – Correlating your Data
Correlation is a Log management nightmare. Splunk, Elastic, and other log management companies shove everything into one big pile, and you are expected to know how to navigate between an immense amount of data. Rainbows and unicorns, yeah right… There is a solution that finds correlations for you, even if you didn’t even know one existed. Read a little more, and you’ll get there (Yes we know we are repeating ourselves).
Logging Problem #4 – Data Normalization at Collection stage
A lot of log data is unstructured or maybe if you are lucky, is somewhat structured. The challenge of creating a system, or using one, which normalizes and analyzes in a way that anybody can read is not only impossible but seems like it can’t exist.
Well, I hate to bust your bubble, but the solution doesn’t only exist, but you are actually reading this blog post on a company blog that takes care of all these issues and more.
If you are looking for a Log management solution that aggregates, analyzes and uses AI to find and solve data related problems, you’ve come to the right place. The problems below won’t be an issue for you anymore:
Being notified in real time on suspicious log flows
Analyzing and querying huge amounts of data in seconds
Automatic clustering of logs back into their patterns
Correlation of logs from various sources
To learn more about making your life or your IT’s life much easier saving time and money, join us!
Be Our Partner
Complete this form to speak with one of our partner managers.
Thank You
Someone from our team will reach out shortly. Talk to you soon!
 The new standard of observability is here. Discover Olly, the industry’s first


![Optimizing logs for a more effective CI/CD pipeline [Best Practices]](https://coralogix.com/wp-content/webp-express/webp-images/doc-root/wp-content/uploads/2025/06/146.png.webp)