
The Coralogix blog
Expert insights, bold ideas, and company news
All Articles
- All
- Alerts
- OpenTelemetry
- Olly
- Uncategorized
- Software development
- AI
- Cases
- AWS
- Product
- CDN monitoring
- CloudWatch
- Logging
- Real user monitoring
- SIEM
- Data
- Gaming
- APM
- Explore
- Cloud
- Fintech
- FinOps
- Data Engine
- Kubernetes
- Microservices
- Compliance
- Dataspaces & Datasets
- Observability
- Metrics
- Security advisory
- Tracing
- CI/CD
- Java
- IaC
- Elasticsearch
- Migrations
- DevOps & IT operations
- Troubleshooting
- Service Management
- Company news
- Case studies
- MDR
- Security
- Performance
- Extensions
- Tutorials
- Audit logs
- Infrastructure monitoring
- Logs
- Application performance monitoring
- SRE
- Monitoring
- Log analytics
- DataPrime

5 Cybersecurity Tools to Safeguard Your Business
With the exponential rise in cybercrimes in the last decade, cybersecurity for businesses is no longer an option — it’s a necessity. Fuelled by the forced shift to...

How to Setup AWS CloudWatch Agent Using AWS Systems Manager
AWS Systems Manager and CloudWatch Agent provide an integrated approach to observability and managing your...

What is scripting?
Like all programming, scripting is a way of providing instructions to a computer so you can tell it what to do and when to do it. Programs can...

Using Lambda Extensions to Streamline Observability
Lambda Observability Lambda is a top-rated compute service available on the AWS cloud service network. Its popularity largely derives from its ease of use, allowing users to run...

IoT Security: How Important are Logs for System?
IoT has rapidly moved from a fringe technology to a mainstream collection of techniques, protocols, and applications that better enable you to support and monitor a highly distributed,...

Cyber Security in 2021 – What Happened?
2021 was quite a year. Some things changed, and some things very much stayed the same. The world of cyber security was not immune to this zeitgeist, with...

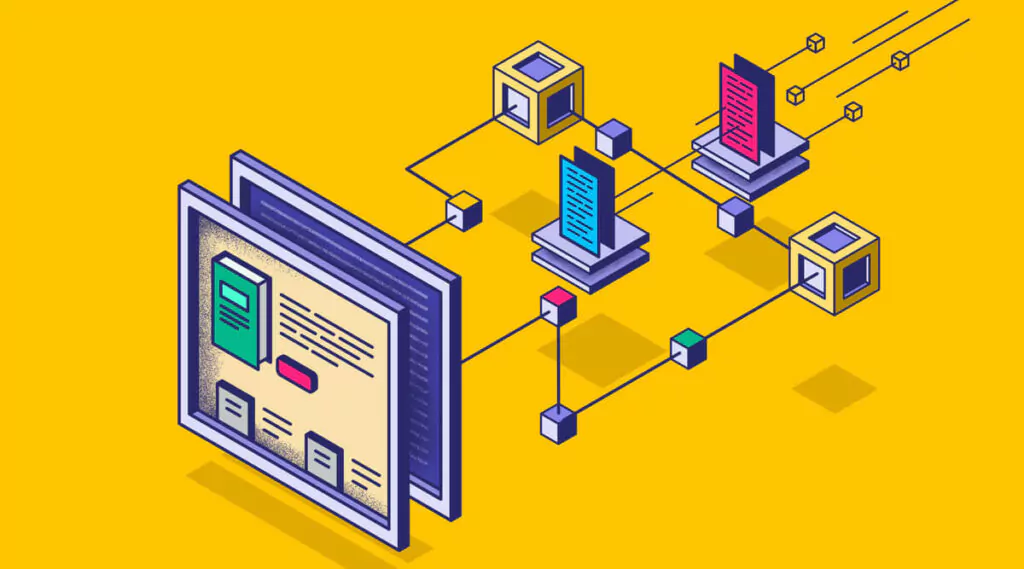
Optimized Traffic Mirroring Examples – Part 2
In a previous post, we looked at an example of a fictional bookstore company and recommended mirroring strategies for that specific scenario. In this post, we’ll be looking...

DDOS Attacks: How to Protect Yourself from the Political Cyber Attack
In the past 24 hours, funding website GiveSendGo has reported that they’ve been the victim...
5 Ways Scrum Teams Can Be More Efficient
With progressive delivery, DevOps, scrum, and agile methodologies, the software delivery process has become faster and more collaborative than ever before. Scrum has emerged as a ubiquitous framework...
Optimized Security Traffic Mirroring Examples – Part 1
You have to capture everything to investigate security issues thoroughly, right? More often than not,...

JSON Logging: What, Why, How, & Tips
When you’re working with large data sets, having that data structured in a way that means you can use software to process and understand it will enable you...
Five Tricks that Senior Engineers Use When They’re Debugging
Debugging is a fundamental skill in the arsenal of any engineer. Mistakes happen, and bugs...