President Joe Biden recently signed an executive order which made adhering to cybersecurity standards a legal requirement for federal departments and agencies.
The move was not a surprise. It comes after a string of high-profile cyber-attacks and data breaches in 2020 and 2021. The frequency and scale of these events exposed a clear culture of lax cybersecurity practices throughout both the public and private sectors.
President Biden’s order brings into law many principles which have long been espoused by cybersecurity advocacy groups, such as the National Institute of Standards and Technology (NIST)’s Five Functions. It is the latest legislation in a trend towards greater transparency and regulation of technology in the US.
The Executive Order on Improving the Nation’s Cybersecurity puts in place safeguards that have until now been lacking or non-existent. While regulations are only legally binding for public organizations (and their suppliers), many see it as a foreshadowing of further regulation and scrutiny of cybersecurity in the private sector.
Despite not being directly impacted, a memo was sent out from the White House to corporate leaders urging them to act as though regulations are legally binding. It’s clear that businesses must take notice of Biden’s drive to safeguard US national infrastructure against cyber threats.
What’s in the Executive Order on Improving the Nation’s Cyber Security
The order spans almost sections and covers a range of issues, but there are several which stand out as likely to become relevant to the private sector.
Chief of these is a requirement for IT and OT providers who supply government and public bodies to store and curate data in accordance with new regulations. They must also report any potential incidents and cooperate with any government operation to combat a cyber threat.
The order also implies future changes for secure software development, with the private sector encouraged to develop standards and display labels confirming their products’ security and adherence to regulatory standards. Some also theorize that government-only mandates for two-factor authentication, encryption, and cloud security, could include private organizations soon.
The key takeaway for businesses is that, whether it’s next year or a decade from now, it’s likely they’ll be required by law to maintain secure systems. If your security, logging, or systems observability are lacking, Biden’s executive order could be your last warning to get them up-to-scratch before regulations become legally binding.
How does this affect my systems?
Many enterprises are acting as though the executive order is legally binding. This is in no small part due to the White House’s memo urging businesses to do so. A common view is that it won’t be long before regulations outlined in the EO are expanded beyond government.
For suppliers to the government, any laws passed following Biden’s order immediately apply. This even extends to IT/OT providers whose own customers include the government as their customers. In short, if any part of your system(s) handles government data, you’ll be legally required to secure them according to the regulatory standards.
Data logging and storage regulations
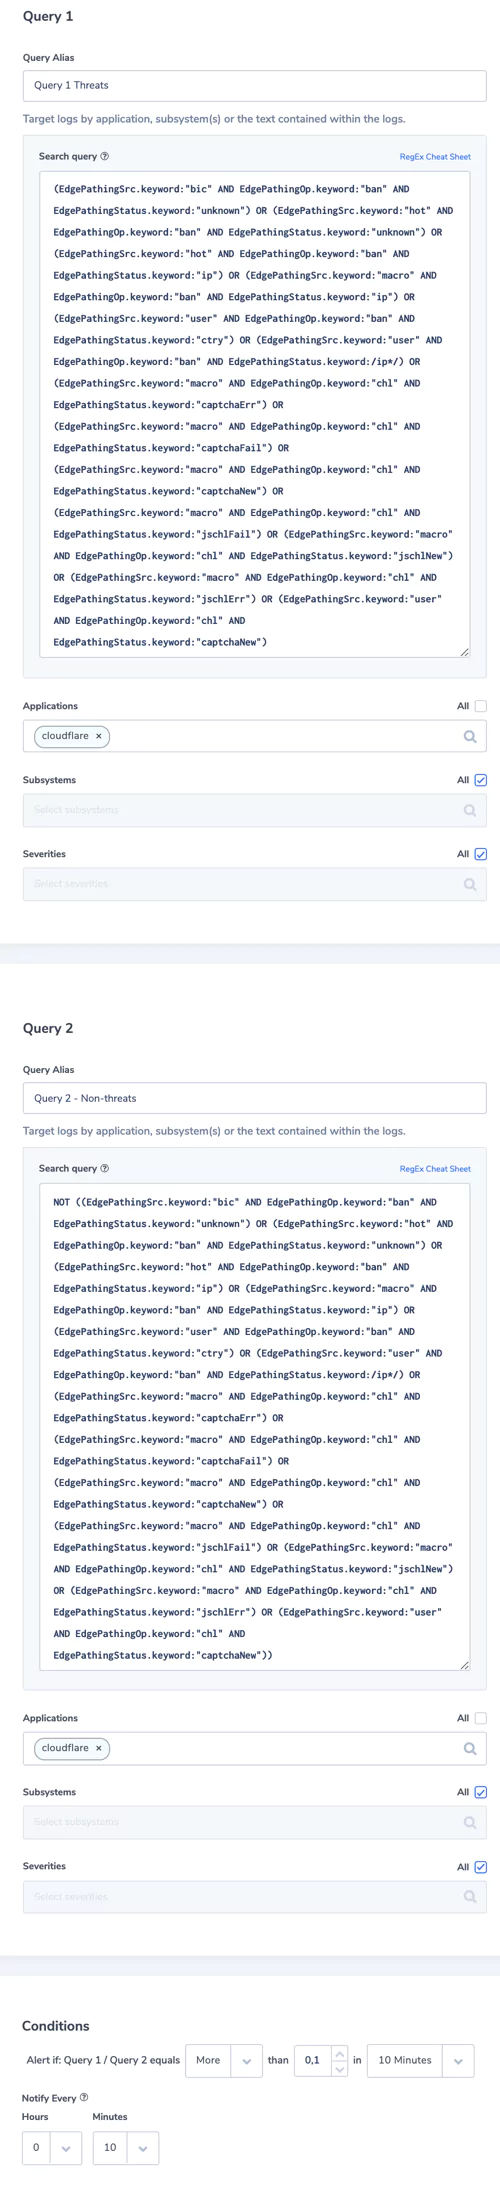
Logging and storage is a key EO focal point. Compliant businesses will have system logs properly collected, maintained, and ready for access should they be required as part of an intelligence or security investigation.
This move is to enhance federal abilities to investigate and remediate threats, and covers both internal network logs and logging data from 3rd party connections. Logs will have to, by law, be available immediately on request. Fortunately, many end-to-end logging platforms make compliance both intuitive and cost-effective.
System visibility requirements
Under the EO, businesses will be required to share system logs and monitoring data when requested. While there aren’t currently legal mandates outlining which data this includes, a thorough and holistic view of your systems will be required during any investigation.
With the order itself stating that “recommendations on requirements for logging events and retaining other relevant data” are soon to come, and shall include “the types of logs to be maintained, the time periods to retain the logs and other relevant data, the time periods for agencies to enable recommended logging and security requirements, and how to protect logs”, it’s clear that future cybersecurity legislation won’t be vague. Compliance requirements, wherever they’re applied, will be specific.
In the near future, businesses found to have critical system visibility blind spots could face significant legal ramifications. Especially if said blind spots become an exploited vulnerability in a national cybercrime or cybersecurity incident.
The legal onus will soon be on businesses to ensure their systems don’t contain invisible back doors into the wider national infrastructure. Your observability platform must provide full system visibility.
Secure services
The EO also included suggestions for software and service providers to create a framework for advertising security compliance as a marketable selling point.
While this mainly serves to create a competitive drive to develop secure software, it’s also to encourage businesses to be scrupulous about 3rd parties and software platforms they engage.
In the not-too-distant future, businesses utilizing non-compliant or insecure software or services will likely face legal consequences. Again, the ramifications will be greater should these insecure components be found to have enabled a successful cyberattack. Moving forward, businesses need to show 3rd party services and software they deploy unprecedented levels of scrutiny.
Security should always be the primary concern. While this should have been the case anyway, the legal framework set out by Biden’s executive order means that investing in only the most secure 3rd party tools and platforms could soon be a compliance requirement. How does this affect my systems?
Many enterprises are acting as though the executive order is legally binding. This is in no small part due to the White House’s memo urging businesses to do so. A common view is that it won’t be long before regulations outlined in the EO are expanded beyond government.
For suppliers to the government, any laws passed following Biden’s order immediately apply. This even extends to IT/OT providers whose own customers include the government as their customers. In short, if any part of your system(s) handles government data, you’ll be legally required to secure them according to the regulatory standards.
Data logging and storage regulations
Logging and storage is a key EO focal point. Compliant businesses will have system logs properly collected, maintained, and ready for access should they be required as part of an intelligence or security investigation.
This move is to enhance federal abilities to investigate and remediate threats, and covers both internal network logs and logging data from 3rd party connections. Logs will have to, by law, be available immediately on request. Fortunately, many end-to-end logging platforms make compliance both intuitive and cost-effective.
System visibility requirements
Under the EO, businesses will be required to share system logs and monitoring data when requested. While there aren’t currently legal mandates outlining which data this includes, a thorough and holistic view of your systems will be required during any investigation.
With the order itself stating that “recommendations on requirements for logging events and retaining other relevant data” are soon to come, and shall include “the types of logs to be maintained, the time periods to retain the logs and other relevant data, the time periods for agencies to enable recommended logging and security requirements, and how to protect logs”, it’s clear that future cybersecurity legislation won’t be vague. Compliance requirements, wherever they’re applied, will be specific.
In the near future, businesses found to have critical system visibility blind spots could face significant legal ramifications. Especially if said blind spots become an exploited vulnerability in a national cybercrime or cybersecurity incident.
The legal onus will soon be on businesses to ensure their systems don’t contain invisible back doors into the wider national infrastructure. Your observability platform must provide full system visibility.
Secure services
The EO also included suggestions for software and service providers to create a framework for advertising security compliance as a marketable selling point.
While this mainly serves to create a competitive drive to develop secure software, it’s also to encourage businesses to be scrupulous about 3rd parties and software platforms they engage.
In the not-too-distant future, businesses utilizing non-compliant or insecure software or services will likely face legal consequences. Again, the ramifications will be greater should these insecure components be found to have enabled a successful cyberattack. Moving forward, businesses need to show 3rd party services and software they deploy unprecedented levels of scrutiny.
Security should always be the primary concern. While this should have been the case anyway, the legal framework set out by Biden’s executive order means that investing in only the most secure 3rd party tools and platforms could soon be a compliance requirement.
Why now?
The executive order didn’t come out of the blue. In the last couple of years, there have been several high-profile, incredibly damaging cyberattacks on government IT suppliers and critical national infrastructure.
Colonial Pipeline Ransomware Attack
The executive order was undoubtedly prompted by the Colonial Pipeline ransomware attack. On May 7th, 2021, ransomware created by hacker group DarkSide compromised critical systems operated by the Colonial Pipeline Company. The following events led to Colonial Pipeline paying $4.4million in ransom, and the subsequent pipeline shutdown and slow operation period caused an emergency fuel shortage declaration in 17 states.
SolarWinds Supply Chain Attack
The Colonial Pipeline ransomware attack was the just latest high-impact cybercrime event with a national impact. In December 2020 SolarWinds, an IT supplier with government customers across multiple executive branches and military/intelligence services compromised their own system security with an exploitable update.
This ‘supply chain attack’ deployed trojans into SolarWinds customers’ systems through the update. The subsequent vulnerabilities opened a backdoor entrance into many highly classified government databases, including Treasury email traffic.
Why is it necessary?
While the damage of the Colonial Pipeline incident can be measured in dollars, the extent of the SolarWinds compromise has not yet been quantified. Some analysts believe the responsible groups could have been spying on classified communications for months. SolarWinds also had significant private sector customers including Fortune500 companies and universities, many of which could have been breached and still be unaware.
Again, these incidents are the latest in several decades marked by increasingly severe cyberattacks. Unless action is taken, instances of cybercrime that threaten national security will become not only more commonplace but more damaging.
Cybersecurity: An unprecedented national concern
Cybercrime is a unique threat. A single actor could potentially cause trillions of dollars in damages (assuming their goal is financial and not something more sinister). What’s more, the list of possible motivations for cybercriminals is far wider.
Whereas a state or non-state actor threatening US interests with a physical attack is usually politically or financially motivated (thus easier to predict), there have been many instances of ‘troll hackers’ targeting organizations for no reason other than to cause chaos.
When you factor this in with the constantly evolving global technical ecosystem, lack of regulation looks increasingly reckless. The threat of domestic terrorism is seen as real enough to warrant tight regulation of air travel (for example). Biden’s executive order is a necessary step towards cybercrime being treated as the equally valid threat it is.
Cybersecurity: A necessary investment long before Biden’s EO
Biden’s EO has shaken up how both the government and private sector are approaching cybersecurity. However, as the executive order itself and the events that preceded it prove, it’s a conversation that should have been happening much sooner.
The key takeaway for businesses from the executive order should be that none of the stipulations and requirements are new. There is no guidance in the EO which cybersecurity advocacy groups haven’t been espousing for decades.
Security, visibility, logging, and data storage/maintenance should be core focuses for your businesses’ IT teams already. The security of your systems and IT infrastructure should be paramount, before any attempts to optimize their effectiveness as a productivity and revenue boost.
Fortunately, compliance with any regulations the EO leads to doesn’t have to be a challenge. 3rd party platforms such as Coralogix offer a complete, end-to-end observability and logging solution which keeps your systems both visible and secure.
What’s more, the optimized costs and enhanced functionality over other platforms mean compliance with Biden’s EO needn’t be a return-free investment.
 The new standard of observability is here. Discover Olly, the industry’s first