With the increasing sophistication and frequency of cyber threats, companies often rely on partners to help provide security services and solutions. Amazon Web Services (AWS) Managed Security Service Provider competency is a hallmark of reliability for MSSPs and other vendors, signifying their capability to provide effective security solutions on AWS’s robust platform.
With Coralogix providing AWS customers with cost-effective, full-stack observability, our recent Snowbit offering of security services and solutions, provides DevOps and security professionals using AWS with a unified platform for leveraging operational and security data all in one place.
Let’s take a look at what AWS MSSP Competency actually is and what this provides for you as a Coralogix customer.
What is AWS security competency?
AWS security competency is a coveted accreditation granted to its partners, symbolizing their adeptness in delivering robust, reliable, and resilient security solutions on the AWS platform.
The AWS accreditation is not merely a badge of honor; it’s a testament to a partner’s capability to provide comprehensive security solutions, ensuring a seamless and secure cloud journey for clients.
Accreditation process
To achieve this competency, partners such as Coralogix undergo a rigorous validation process that includes:
Technical expertise evaluation
Customer success assessment
Overall security capabilities scrutiny
The validation encompasses various domains, including data protection, infrastructure security, compliance, privacy, and Identity and Access Management (IAM). This meticulous process ensures that only partners with a proven track record of delivering superior security solutions are awarded the AWS security competency.
Why does AWS security competency matter?
The AWS security competency signifies Coralogix’s capability to offer security solutions that adhere to AWS’s high standards and best practices. It encapsulates a broad spectrum of security solutions, including but not limited to:
Security assessments
Compliance validation
Threat identification
Incident management
Moreover, security competency underscores Coralogix’s capability to provide security solutions seamlessly integrated with AWS services. Thus, ensuring a holistic approach to cybersecurity.
The emphasis on robust cybersecurity measures continues to surge, illustrated by the projected spending in this sector. According to Gartner, by the end of 2023, the global expenditure on security and risk management by end-users is anticipated to hit $188.1 billion.
This substantial financial commitment underscores the critical importance of AWS security competency in arming organizations with the tools and expertise to navigate the shifting cybersecurity terrain adeptly.
Impact on client engagements
With AWS security competency, Coralogix is positioned to assist clients in navigating the complex security landscape, offering solutions tailored to meet the unique needs and challenges which different sectors face.
Overall, AWS security competency is a hallmark of excellence in cybersecurity on AWS, ensuring that organizations are well-equipped to protect, detect, and respond to security threats in real-time, fostering a secure and resilient digital ecosystem.
Benefits of MSSP ISV Competency for Coralogix customers
The AWS Managed Security Service Provider (MSSP) ISV Competency program is a well-known and respected program in the cloud security industry. The MSSP ISV competency is a sign of trust and capability for MSSPs certified by AWS.
The competency program is not only a testimony to Coralogix’s expertise but also a promise of reliable, tailor-made security solutions to AWS customers.
Here are some of the compelling benefits:
1. Deep specialization and expertise
The AWS Level 1 MSSP Competency showcases profound specialization and expertise in safeguarding and overseeing crucial AWS resources. This recognition is designed to assist AWS customers in identifying AWS Partners, such as Coralogix who have demonstrated a profound understanding and capability in cybersecurity.
2. Real-time security monitoring
In the dynamic financial technology world, real-time security infrastructure monitoring is paramount. Recently, a fintech company, as showcased in a Snowbit by Coralogix case study, leveraged this competency to ensure continuous monitoring and instant threat detection, thus safeguarding sensitive financial transactions.
3. Enhanced cloud security
As mentioned above, in a sector where security is synonymous with trust, a crypto giant utilized this competency to bolster its real-time security monitoring. As the Snowbit case study on a crypto giant illustrated, AWS’s security competency was pivotal in securing digital assets in the volatile crypto market.
4. Tailored security solutions
The competency program facilitates the provision of tailored security solutions, ensuring a better fit for specific security needs. It simplifies the task of customers by finding validated solution providers qualified to deliver uniquely designed solutions for cloud environments.
5. Increased visibility and resilience to DDoS attacks
With the rise in DDoS attacks, having a mechanism to increase visibility and resilience is crucial. The AWS Level 1 MSSP Competency aims to reduce the risk associated with availability, financial, and security impacts through enhanced protection against such attacks.
6. Customer-centric benefits
Through this competency, customers can effortlessly discover and engage with AWS Partners who have been stringently vetted and validated against AWS’s high standards.
This customer-centric approach ensures that organizations are not just getting a service provider but a committed security partner capable of providing tailored solutions to their unique security challenges.
The AWS MSSP ISV Competency program is a game-changer, providing a structured pathway for AWS Partners such as Coralogix to manifest their expertise while ensuring customers have access to top-tier, reliable security solutions tailored to their specific needs.
Final thoughts
The AWS Security Competency and MSSP ISV Competency symbolize high trust and expertise, ensuring organizations are adeptly fortified to face cybersecurity challenges. Coralogix, with its AWS DevOps Competency and AWS Level 1 MSSP ISV Competency, extends a hand of partnership to organizations, guiding them through the intricate domain of security with a DevOps mindset.
Coralogix’s achievement of the AWS DevOps Competency underscores its commitment to helping customers optimize their operations and enhance security on AWS. Explore full-stack observability with Coralogix, and unearth how traversing the journey toward achieving AWS DevOps Competency can significantly uplift your security posture in the AWS ecosystem.
The blend of DevOps practices and robust security measures creates a resilient infrastructure ready to meet today’s demanding digital landscape. Seize the opportunity to delve deeper into how Coralogix can steer your organization toward a secure and efficient operational horizon.
Event-driven architecture is an efficient and effective way to process random, high-volume events in software. Real-time data observability and monitoring of event-driven system architecture has become increasingly important as more and more applications and services move toward this architecture.
Here, we will explore the challenges involved in monitoring event-driven systems, the key metrics that should be monitored, and the tools and techniques that can be used to implement real-time monitoring, including Coralogix’s full-stack observability platform–letting you monitor and analyze data with no limitations.
We will also discuss best practices for designing event-driven systems that are easy to monitor, debug, and maintain.
What is event-driven architecture?
Event-driven architecture is a software architecture pattern emphasizing event production, detection, and consumption. Events are characterized as a change in the system or actions taken by an external actor. Events can be triggered by anything from a user logging into your website to an IoT device pushing data to your platform. Events are generally unpredictable by nature, so reacting to them with traditional polling architecture can be computationally heavy.
In an event-driven architecture, components within the system communicate by publishing events to a central event bus or message broker, which then notifies other components that have subscribed to those events. These components can then appropriately react to the event for their role in the system. The nature of this architecture lends well to microservice architectures.
The advantages of event-driven architecture include improved scalability, loose coupling, and greater flexibility, and it is handy for systems that need to handle large volumes of data and respond quickly to changing conditions. When you have loosely coupled applications, your teams can have better cross-team collaboration and can work more independently and quickly.
When should you use event-driven architecture?
Event-driven architecture is most efficient when you have a system that must respond quickly and efficiently to changing conditions, handle large volumes of data, and scale horizontally.
Real-time processing can be done in a very efficient and effective manner using event-driven architecture. These architectures can quickly handle large volumes of data, making them ideal for real-time processing in a production environment working at scale. Processing can be used to:
Analyze user behaviors on a webpage
Detect security threats
Record input data events such as sales
Act upon IoT sensor data
AWS tools to support event-driven architecture
Amazon Web Services (AWS) provides several services and tools that support event-driven architecture and enable developers to build scalable, flexible, and responsive applications. Here, we will focus on AWS Pipes, AWS EventBridge, and AWS Kinesis. These services do not need to be used together, but complement each other for an effective event-driven architecture design.
AWS EventBridge Pipes
Pipes is a service on AWS, becoming generally available with the full feature set for AWS users in December 2022. The pipes service allows you to create connections between services by creating streams between services without needing to create integration code.
Pipes use managed polling infrastructure to fetch and send events to configured consumers. Events maintain source event order while allowing developers to customize the stream’s batch size, starting position, and concurrency. Pipes also have configurable filtering and enrichment steps, so data flowing through the pipe can be blocked if it is not relevant, and can be enriched with more data before reaching target consumers. The enrichment step can fetch enrichment data using AWS Lambda, AWS API Gateway, or other AWS services.
AWS EventBridge
EventBridge is a service linking multiple AWS producers and consumers together while allowing data filtering for only relevant data. EventBridge provides fast access to events produced by over 200 other AWS services and your client applications via API. Once in EventBridge, events can be filtered by developer-defined rules. Each rule can route data to multiple targets that are appropriate for that data. Rules can also customize event data before sending it to targets.
EventBridge was built for scale applications and can process hundreds of thousands of events per second. Higher throughputs are also available by request. EventBridge also recently added a replay feature to rehydrate archived events to help developers debug and recover from errors.
AWS Kinesis
Kinesis is a managed, real-time, scale streaming service provided by AWS. Kinesis can take streaming data at high volumes and has controls in place that help data processing work effectively. Partition keys allow you to ensure similar data are processed together, and sent to the same Lambda instance. Back pressure features ensure Kinesis does not overrun sink points with limited resources or that are throttled. Kinesis can also replay events up to 24 hours in the past if necessary to avoid data loss or corruption.
Kinesis, however, does not support routing. All data in a stream is sent to all configured trigger points. Producers (data sources) and consumers (data endpoints) are inherently tied together. Depending on the consumer, there may be wasted data where a consumer does not need to process certain data so it is dropped on the floor. When every millisecond of processing costs, this is less than ideal. There are also limits to the number of consumers available per Kinesis stream. While users can configure multiple, every new consumer increases the likelihood of throttling in the stream, increasing latency.
A sample event-driven architecture
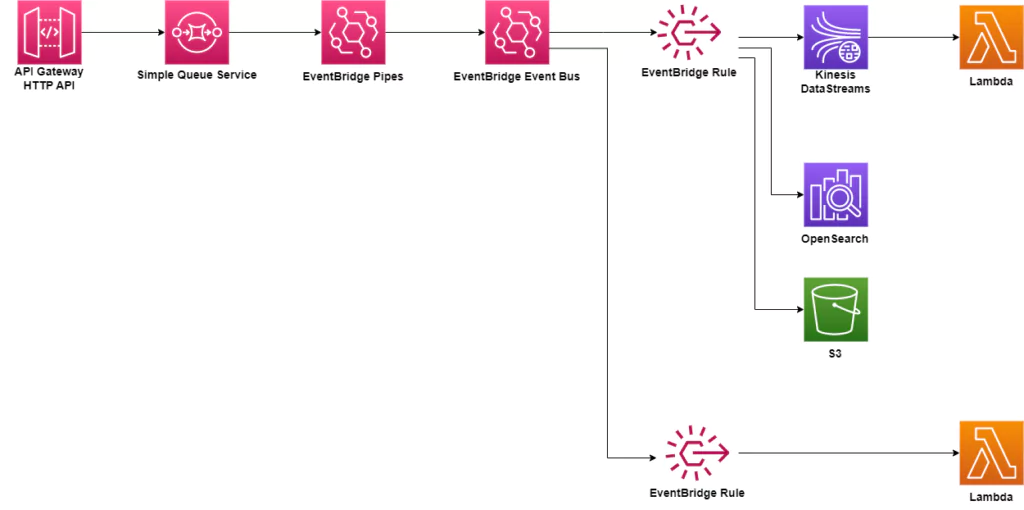
The high-level architecture for an event-driven platform could resemble the setup below. In this architecture, an API Gateway is used to collect events. They directly flow through SQS, EventBridge Pipes, and EventBridge rules before reaching processing that involves developer code. Along this flow, data could be transformed if needed before storage in either OpenSearch or S3. Lambdas can be triggered by Kinesis DataStreams or directly by EventBridge rules for further processing.
Observability in distributed, event-driven architecture
Distributed systems are notoriously difficult to troubleshoot since each service acts individually. The system depicted above uses several discrete services which operate independently, and each can provide a point of failure. DevOps teams need to track data as it flows through these different software systems to effectively troubleshoot and fix errors. By tracing data, teams can detect where data is bottlenecked and where failures are occurring. Logs and metrics will show how services function individually and in response to one another. The more quickly teams visualize issues, the more quickly they can be fixed. Reduction of downtime and errors is the end goal of every software team.
Observability methods must be integrated to complete the building of an event-driven architecture. Various tools exist within AWS and with external, full-stack observability platforms like Coralogix. Software must be integrated with the ability to generate observability data (logs, metrics, and traces). This data can be utilized within AWS and exported to observability tools for further analysis. With a distributed system such as the event-driven architecture shown, trace data is especially important, and often overlooked, to ensure analysis can be done effectively to track data as it moves through the system.
While AWS provides observability features such as CloudWatch and CloudTrail, they require manual setup to enable features like alarms. For software running at scale in production environments, external tools are required to ensure your event-driven software runs effectively with minimal downtime when errors occur. For the most effective results, data should be sent to a full-stack observability platform that can offer managed machine learning algorithms and visualization tools so troubleshooting your architecture becomes efficient and effective.
Summary
This article highlighted how an event-driven architecture can be implemented in AWS. Using the available services, minimal coding is required to stream data from external sources like API Gateway to efficient processing and storage endpoints. Data that is not required for processing can be filtered out in this process, requiring less computing time in your software.
Implementing effective observability tooling while building distributed systems is critical to reducing application downtime and lost data. AWS CloudWatch and CloudTrail can be used for monitoring an AWS software system. Coralogix’s full-stack observability platform enhances AWS’s monitoring by providing analysis on logs, traces, and metrics and providing insights and visualizations only available with machine learning.
Modern computing has come a long way in the last couple of years and the introduction of new technologies is only accelerating the rate of advancements. From the immense compute power at our disposal to lightning-fast networks and ready-made services, the opportunities are limitless.
In such a fast-paced world, we can’t ignore economics. Services are dormant most of the time only to be woken up to a certain peak or two every day, and paying for server time that isn’t being used can be incredibly expensive.
When AWS observability was introduced Lambdas as their serverless compute solution, everything changed. Why maintain servers and all the wrappers around it when you can just focus on the code. In the last couple of years, we’ve seen more and more workloads being migrated to serverless computing with AWS Lambda functions.
Now there’s a new generation of Lambda that offers even more savings based on ARM CPUs. Arm-based Lambda functions can get up to 34% better price performance over x86-based Lambda functions. And with the world going towards a greener, cleaner world we really all win by getting more power for less carbon footprint. These are exciting times!
AWS Lambda: The Story So Far
But what about the Lambda itself you ask? Lambda started from a basic container or a “wrapper” of sorts for one’s code. As the service gained more traction, more features and extensions were added to it along with various runtimes
Ever since AWS began offering EC2 instances with ARM hardware, we’ve been asking the question – when will AWS bring this awesome technology, with its lower costs and next-level performance, to the world of serverless. Well, the day has come.
This new generation of Lambda is basically the same service but runs on hosting nodes utilizing Graviton2 – ARM64 architecture CPUs.
How we are using the next-gen Lambda
As an AWS Advanced Technology Partner, we at Coralogix were happy for the opportunity to test the next generation of Lambda.
As part of the beta, we created an ARM version of our Lambda extension and tested our SDKs to make sure that when you need them they will be ready for you (and they are!).
Lambda is built with a plug & play infrastructure, meaning you can connect any service you need to it – A gateway, a network, a queue, or even a database. This is a great facilitator to the agility of Lambda as a serverless solution.
Logic within your app can be divided into layers, which allows for the segmentation of processes much like decorators in code. We love layers, and we use them too.
In fact, we offer one to facilitate all of your app logging delivery. Our Coralogix extension layer will collect and funnel all of your logs into Coralogix, and we now offer it for both x86 and arm64 architectures.
Both solutions we offer for Lambda are rather simple to integrate and are well documented on our website.
We can offer observability as an SDK for any major platform.
We at Coralogix are all about observability. Regardless of the architecture or the hardware type of the underlying nodes, we know you need visibility into what is happening with your code at any given time.
This is especially true during a migration to a new architecture. Even when the migration is rather seamless, some pieces of code may behave unexpectedly, and we need to be able to identify any issues and resolve them in as little time as possible. With Coralogix, you can achieve full observability for your cloud-native apps in AWS without worrying about cost or coverage.
Amazon Web Service’s CloudWatch is a service that allows you to monitor and manage deployed applications and resources within your AWS account and region. It contains tools that help you process and use logs from various AWS services to understand, troubleshoot, and optimize deployed services. This article will show you how to get an email when your Lambda logs over a certain number of events.
Setup
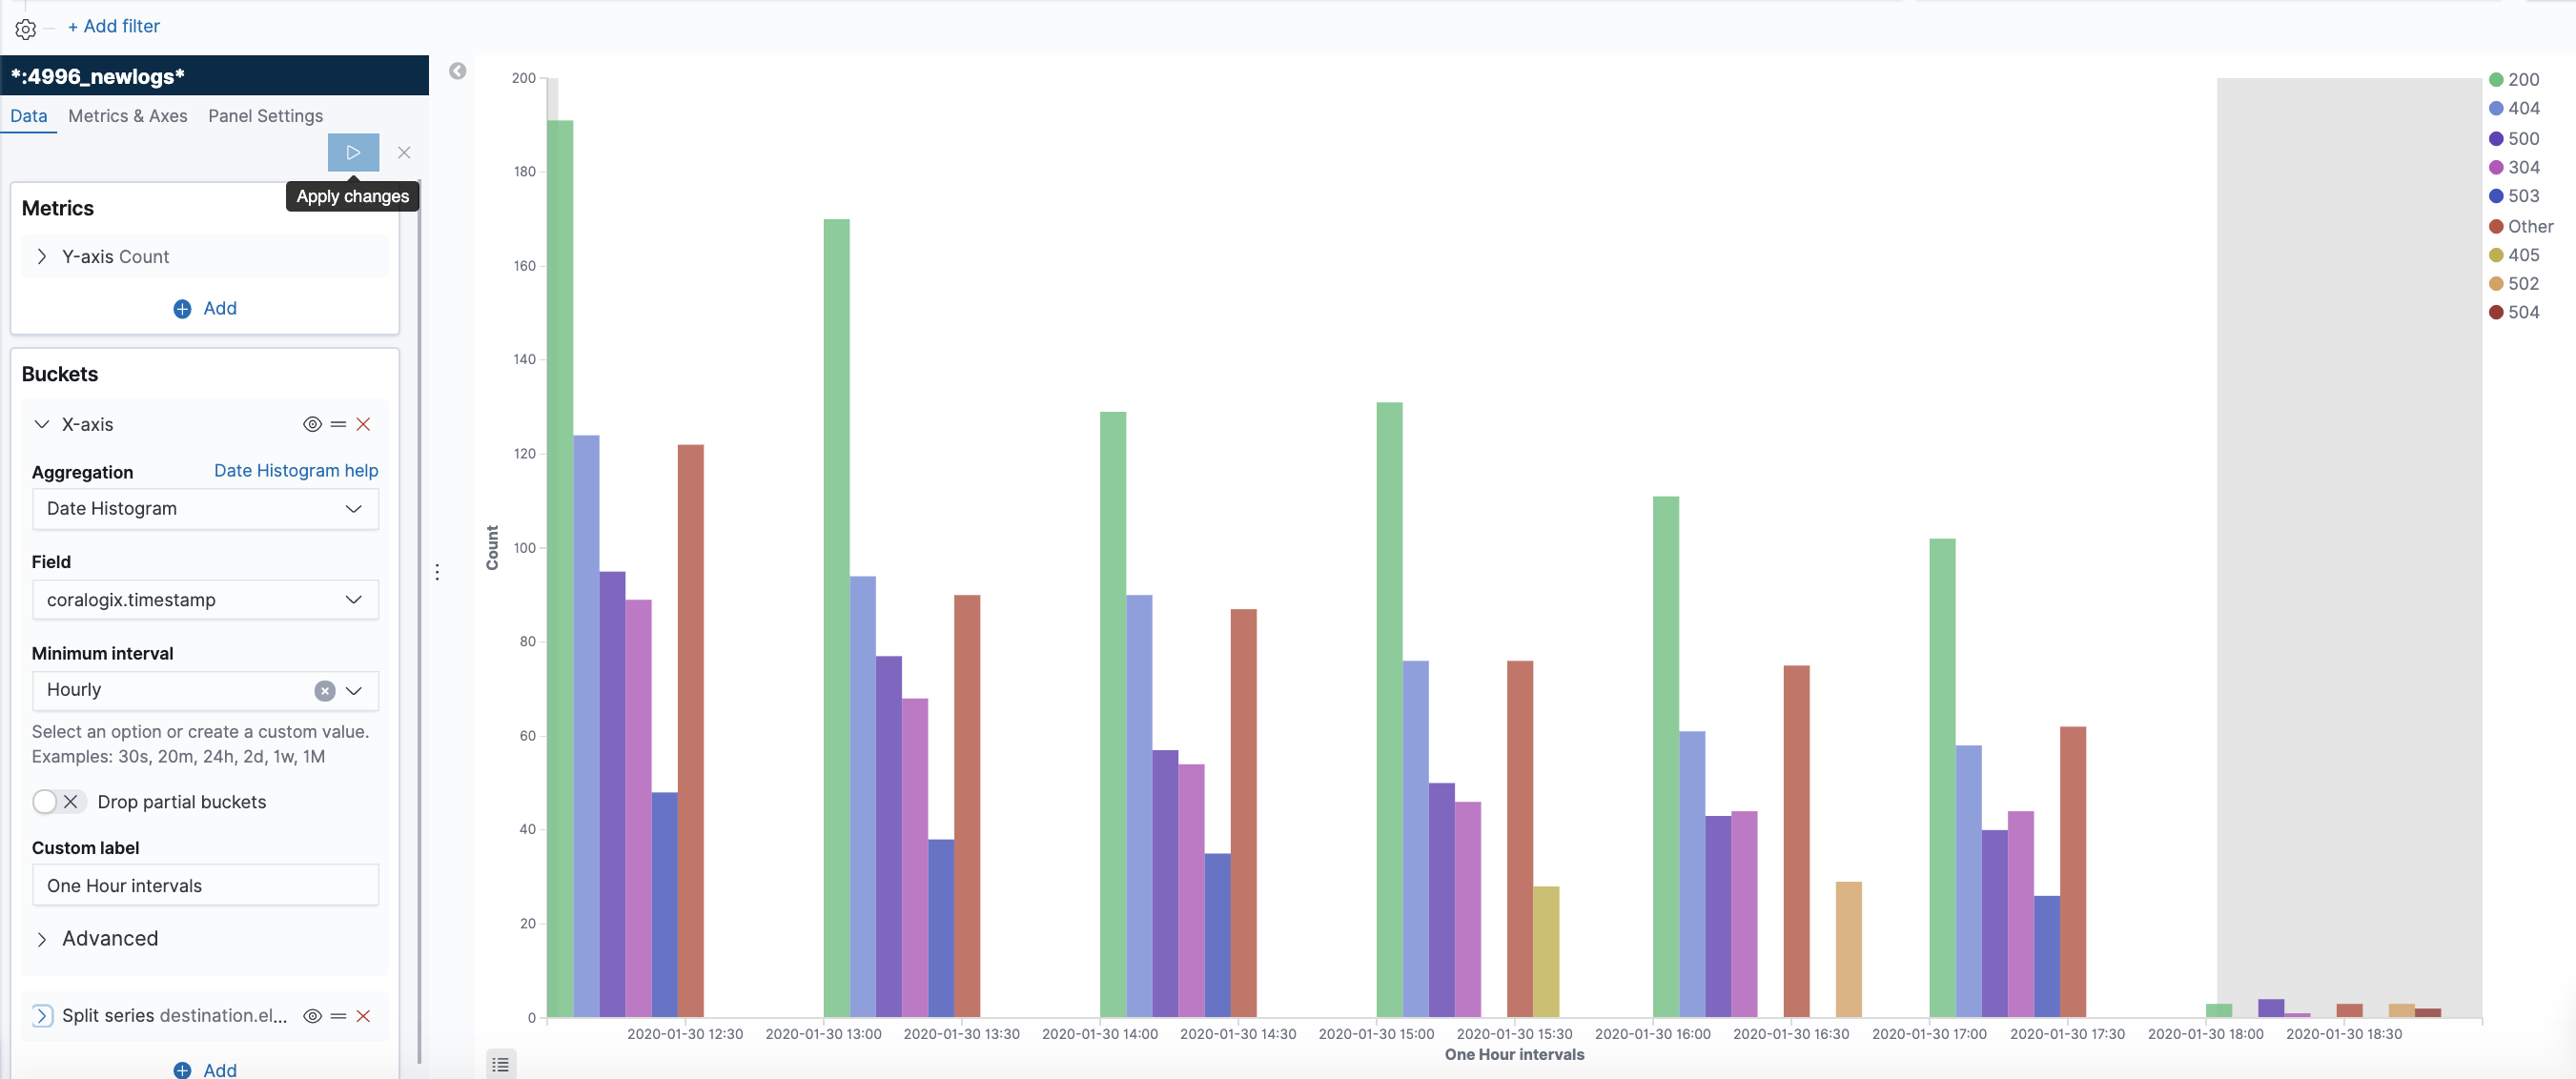
To follow this tutorial, you need to set up an AWS account. I have created a Lambda function that logs a random number between 0 and 200 to simulate tracking the number of users subscribing to my system. I used serverless to deploy this lambda function to my AWS account. The Lambda function is triggered by a CloudWatch rule periodically to simulate the number of users subscribed each minute.
CloudWatch Metrics
Tracked AWS service events called Metrics can trigger alarms when the metric exceeds some preset threshold. Many AWS services produce metrics automatically, but you can also create custom metrics to track better precisely what you need in your AWS services. See the CloudWatch User Guide for a list of automatically created metrics.
You can create metric filters using data logged by AWS services such as Lambda. Once a Lambda logs into CloudWatch, you can create a filter based on the data patterns seen for that function. CloudWatch takes the filter and converts data into numerical metrics that can trigger alarms. This article will show you how to create a metric on your logged data to track logged errors.
Step-by-Step: Create a Metric Filter
Let’s walk through how to set up a custom metric filter using CloudWatch logs from a Lambda function. To follow these steps, you must set up a lambda that sends logs to CloudWatch.
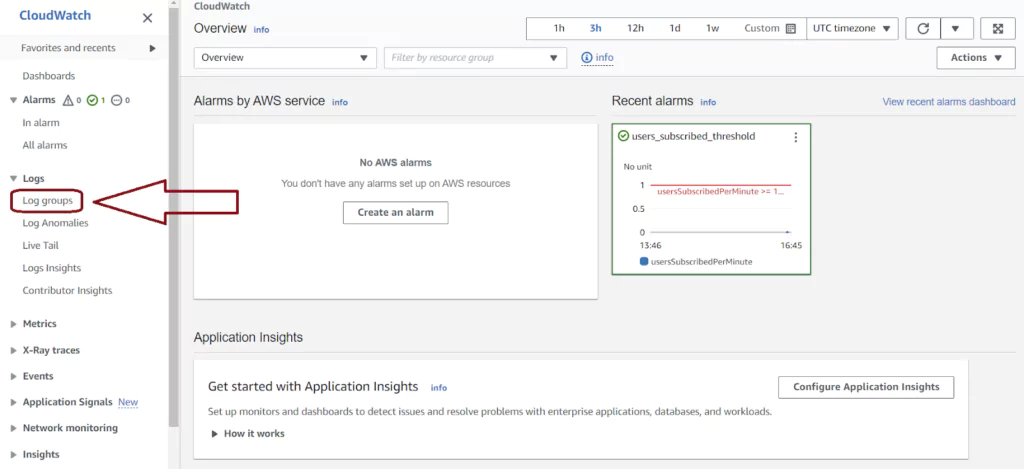
Navigate to the CloudWatch console in AWS. You can find your logs by selecting Log groups from the left vertical menu. The Log groups page has one entry for each Lambda function, ECS function, and any other service instance logging to CloudWatch. Labels in the Log group name indicate the AWS service and instance logging. Click on the Log group name to see the CloudWatch logs from that instance.
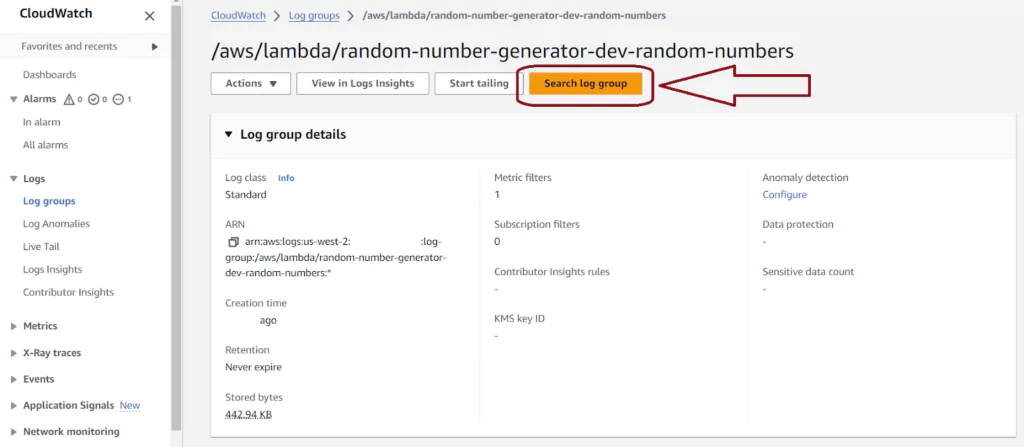
The Log streams page for Lambdas shows each Lambda instance. Lambda reuses instances over time, and multiple instances may run in parallel. To see the logs for any instance, click on the blue Log stream name labeled for the first run date. For a time-series view of logs from all Lambda instances, click the orange Search log group button.
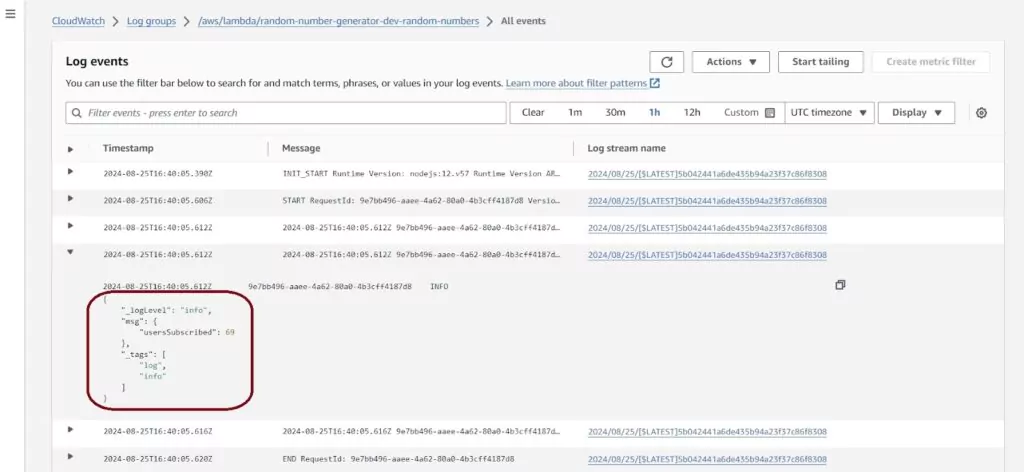
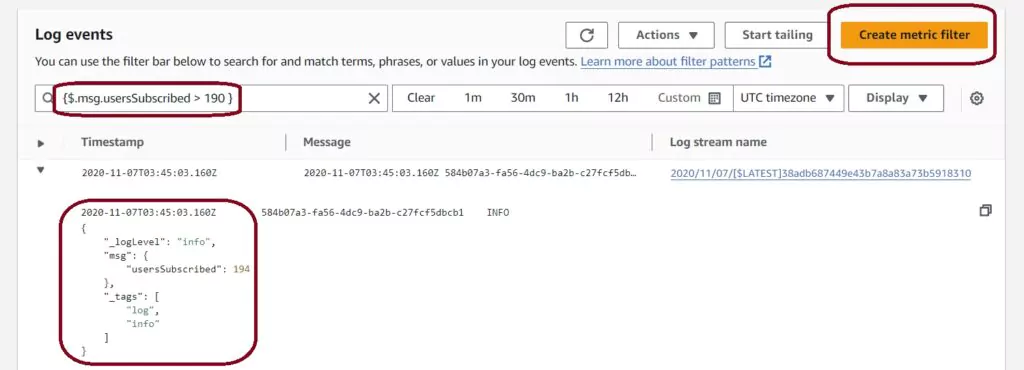
The next Log events page has a list of all the logs present for all time ordered from oldest to most recent. You can keep scrolling down to load more logs if you have more records than will fit on the page. You can also time-filter the CloudWatch logs using the top horizontal menu. Filters can be relative or fixed. Here I have logs that I will use for my metric: keeping track of the usersSubscribed value.
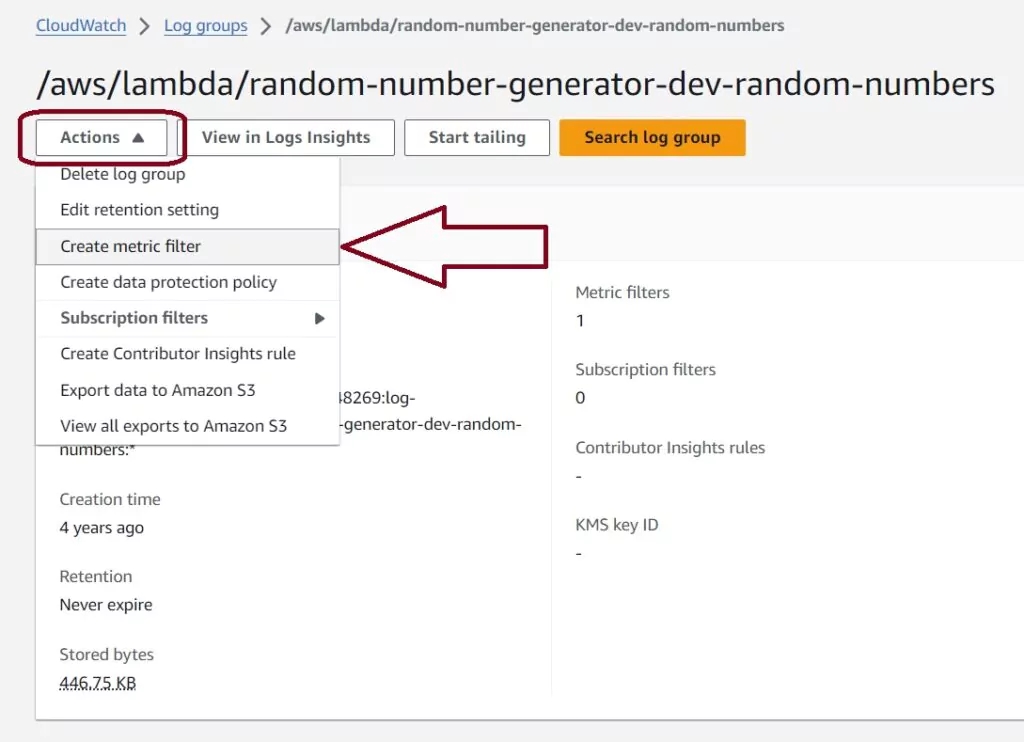
To create a metric filter, you can go back to the main log page for this Lambda and select actions and Create Metric Filter. This will lead to a page that allows us to create a new filter. Another option is to type the filter into the search bar in the Log events page.
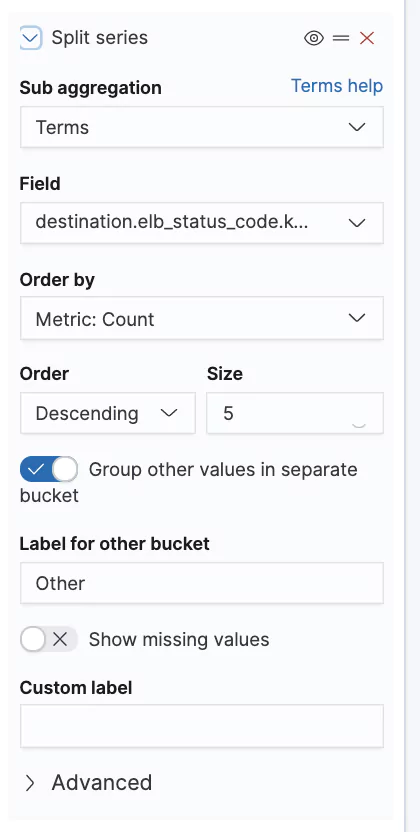
Now we want to make a useful search for our logs. Find details on the syntax used on the AWS Filter and Pattern Syntax page. I will create a metric filter based on the random number generated; I only show logs where usersSubscribed are more than 190. The filter configuration that does this for my log looks like this:
{$.msg.usersSubscribed > 190}
Once the filter is preset, the Create Metric Filter button turns orange, allowing us to create our metric filter. The search can be applied on this page as well so we can ensure the filter is working for the expected events.
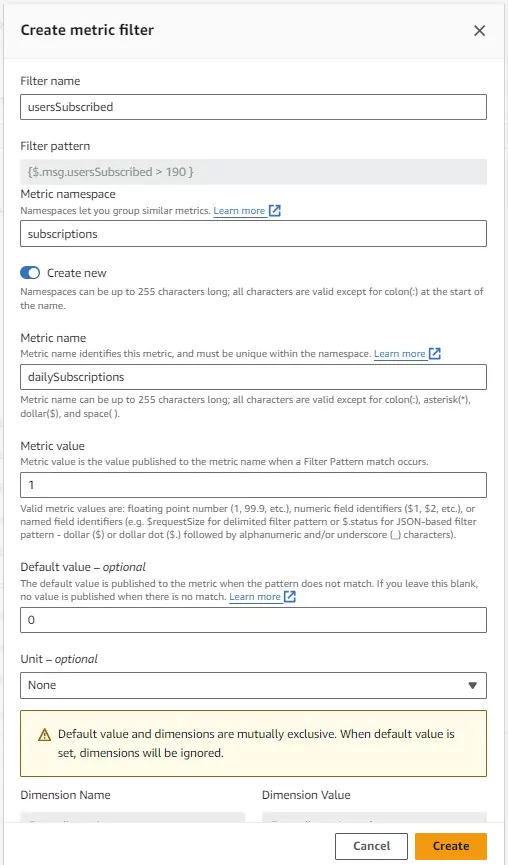
After pressing the Create Metric Filter button, a pop-up will appear, allowing the setup of the metric filter configuration. The filter expression is automatically transcribed. I have selected the filter name, metric name, and metric namespace. The metric namespace allows isolation of logs from one another so that aggregations don’t accidentally include invalid data.
When the filter returns a valid log, the metric value specified here logs into the metric. In this case I chose to show a value of 1 when my usersSubscribed value is greater than 190 and show 0 otherwise.
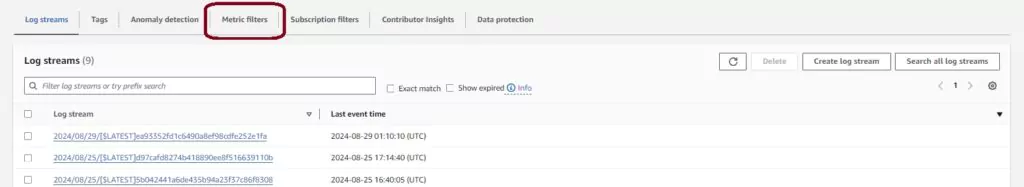
After creating the metric filter, you can view and edit its configuration in the Metric Filters tab in the CloudWatch logs.
CloudWatch Alarms
Once you have created or chosen your metric, you can create an alarm from it. You can set up alarms using AWS CloudFormation, the AWS CLI, or the AWS console. Alarms can subsequently produce an AWS EC2 action, execute an AWS Auto Scaling Action, or send a notification to an AWS SNS topic.
Below are the steps to create an alarm that will send an email when the metric detects a value higher than my limit. When the alarm is triggered, it will send the owner an email about the issue.
Step-by-Step: Create a CloudWatch Alarm
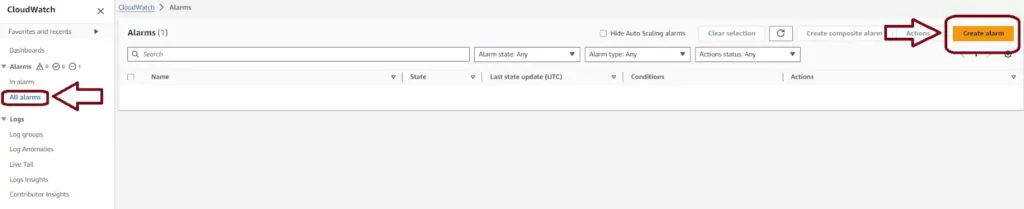
Login to your AWS account and navigate to the AWS CloudWatch console. On this page, you choose the Alarms menu item from the left-hand menu, then press the orange Create Alarm button in the navigation pane.
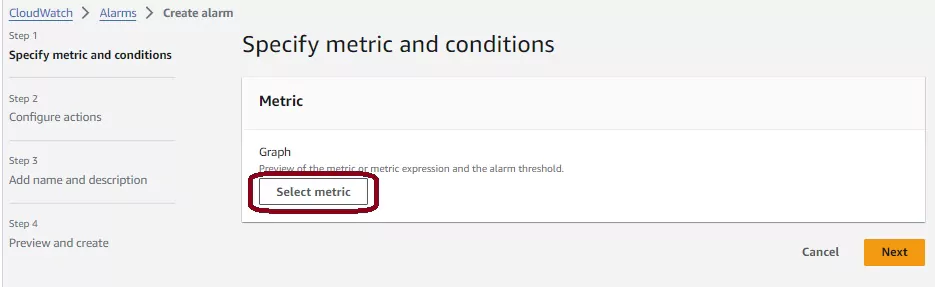
Next, AWS will take you to a page with a simple step-by-step process for creating your alarm after pressing the Create alarm button. There are four steps to complete.
First, you need to select which metric should trigger the alarm. Press the white Select metric button to configure this.
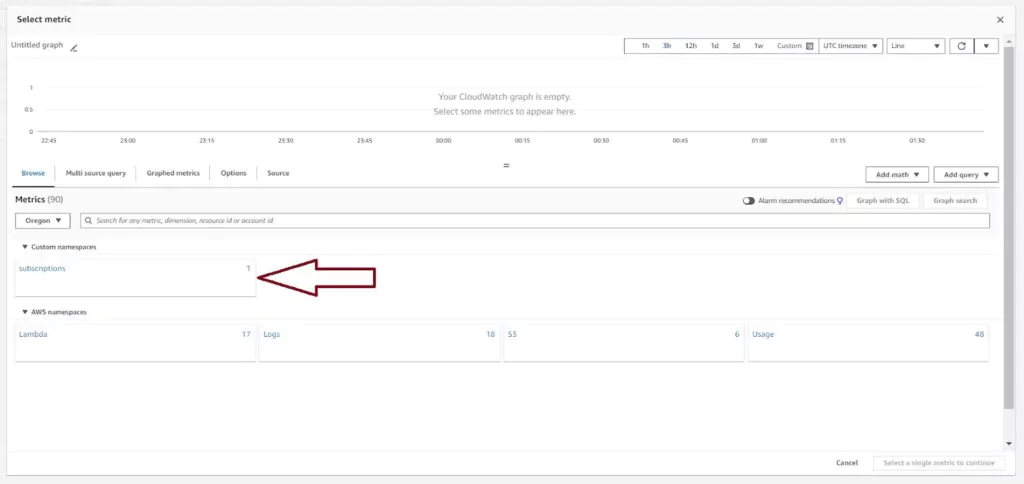
The Select metric page has all options available for alarms present including default metrics created by AWS. For Lambdas, this includes metrics like throttle rates, errors, and invocation counts. Most AWS services have some default metrics available here.
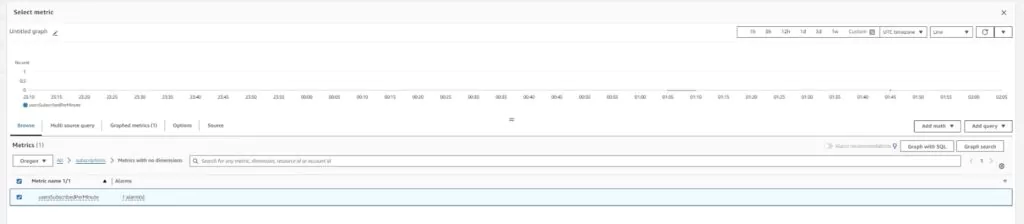
Since I have created a custom metric filter in the previous section, I will select that metric to use for the alarm. Custom metrics are listed under the custom namespace we created in the CloudWatch Metrics section. Click on subscriptions and then on Metrics with no dimensions to find the previously created filter named usersSubscribed per minute.
The setup of the Graphed metric defaults to showing the average of the metric value over 5 minute periods. The metric is logging a 1 when the number of users subscribed is more the 190 and is logging 0 when the number of users subscribed is less. The graph shows the metric’s output for a configurable period to show the metric’s logging behavior. With the graph set up to support my wanted alarm, press Select metric.
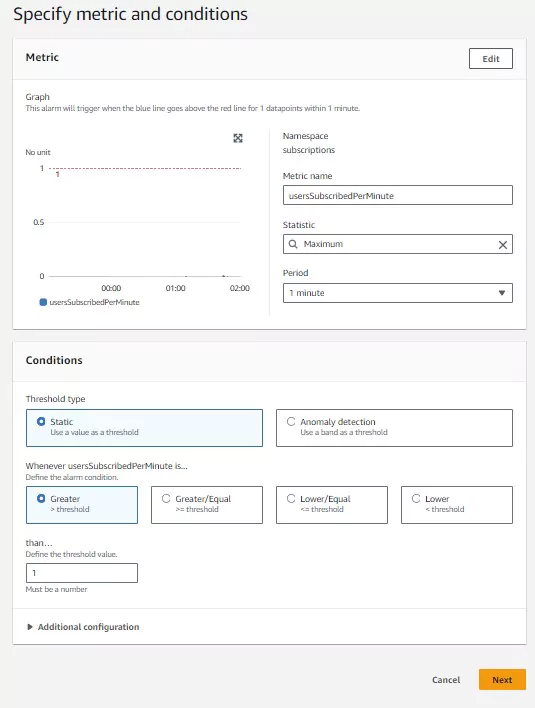
The next page, titled Specify metric and conditions, sets up the metric’s configuration and the Conditions to trigger the alarm. In this case, the average is not useful for the alarm, so it uses the Maximum statistic. There are many other statistics to choose from in the drop down menu. Also, since I expect to receive data each minute on this statistic, I changed the Period to 1 Minute. In the Conditions section, we choose whether to use Static or Anomaly detection triggers. Static triggers will cause an alarm by comparing the metric data to some value. Anomaly detection triggers use CloudWatch machine learning algorithms to analyze metrics and trigger an alarm when it sees behavior outside of the norm.
This alarm will trigger on static conditions whenever more than 190 users subscribe within 1 minute. Since my metric logs a value of 1 in that event, I set my static condition to trigger when the usersSubscriptionPerMinute metric is greater than or equal to 1. Once the configuration is complete, click next.
Next, we will configure the actions the alarm will take once it is triggered. There are five different action options and each is discussed below.
Once I create all the actions I want to occur, I complete the alarm’s creation by pressing the orange Create alarm button.
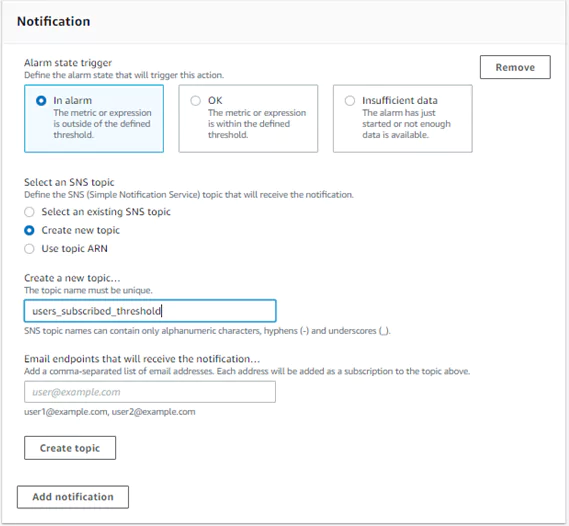
1. Send a Notification Action Using an SNS Topic
To configure a notification action, we first need to choose when actions should occur. The action could occur when the metric is in an alarm state, when the metric is not is an alarm state, or when the alarm has insufficient data to determine the alarm state.
I have chosen to have my alarm state trigger an action when the metric is in an alarm state. The action will proceed whenever more than 190 users have subscribed at a time.
If you do not already have an SNS topic setup, you can create one from this page. You need to name your topic and insert an email address to use when alarm actions are triggered.
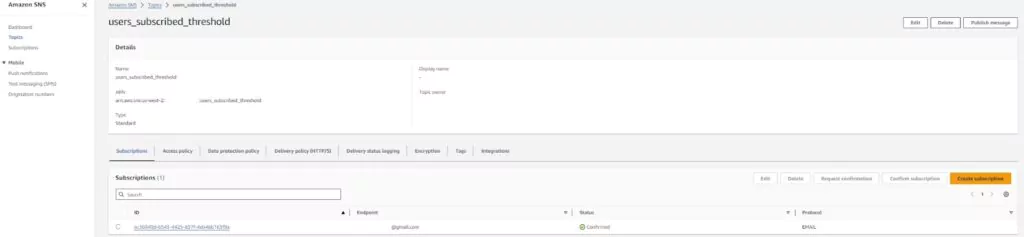
View the new SNS topic on the Amazon SNS page under the topics section. The name should appear as specified. Click on the topic to view more details and edit the topic.
Editing the topic allows you to add or change the email addresses used in the SNS topic. SNS will list the email addresses as unconfirmed until the email’s owner follows the confirmation link sent to that email. If the alarm is triggered, unconfirmed emails will not receive the notification.
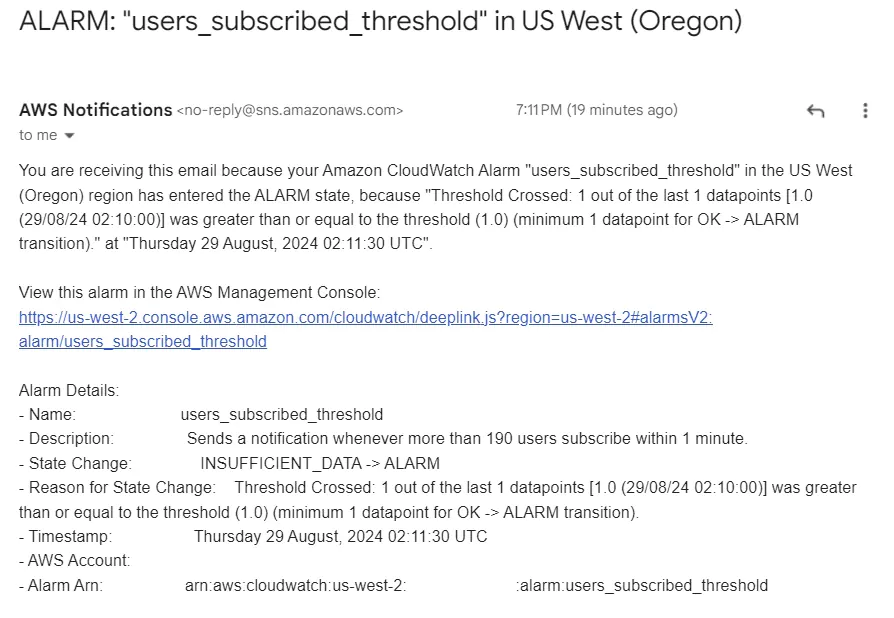
When an alarm is triggered, confirmed emails will receive an email notifying them of the event(s). The email contains crucial information that the user may want to take action on.
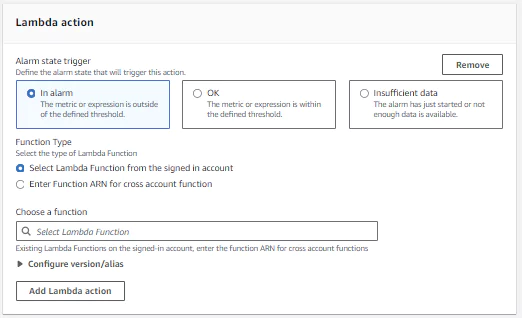
2. Lambda action
To configure a Lambda action, first determine which state should trigger the Lambda. Next determine which Lambda should be triggered. The input to the Lambda will contain event data and can be used in the Lambda logic.
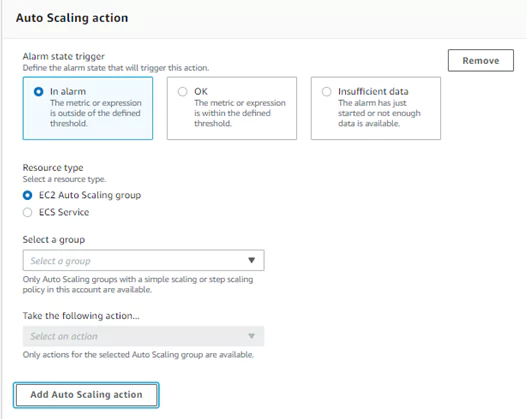
3. Auto Scaling action
To configure an auto-scaling action, first determine when the alarm state should trigger the action. These are the same options as provided in sending an SNS notification (above). Next, choose which resource type to scale between an EC2 Auto Scaling group and an ECS service. You must configure the ECS and EC2 instances separately before you can use them in an alarm. In each case, the alarm will trigger more EC2 instances within the set group or start more ECS tasks, respectively, to run.
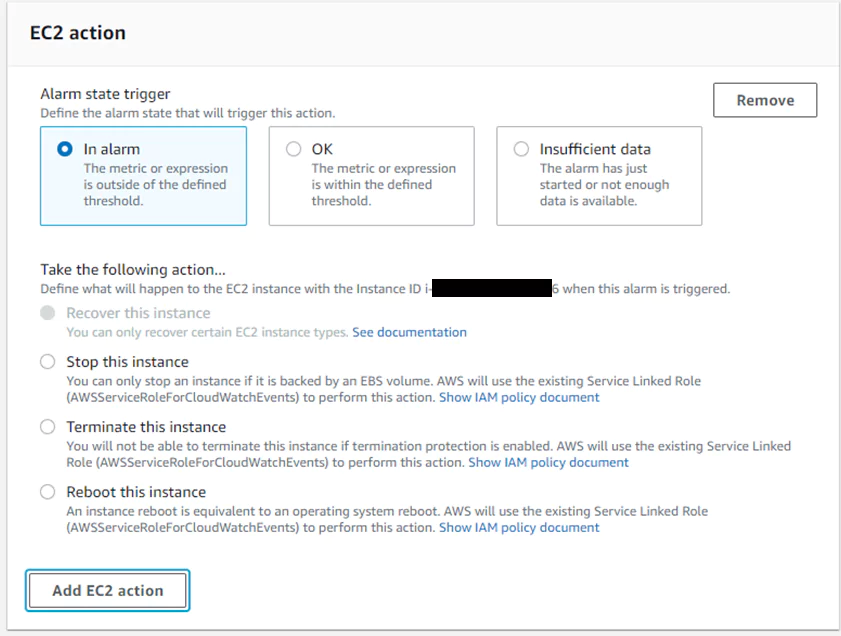
4. Take an EC2 Action
Use alarms to terminate, to reboot, or to recover EC2 instances. Since a lambda triggers this alarm, I will not use this option here. If the metric used in the alarm is anything other than an EC2 per-instance metric, this option is not available. If you have that metric configured, the menu will appear as in the image below to select which action is required.
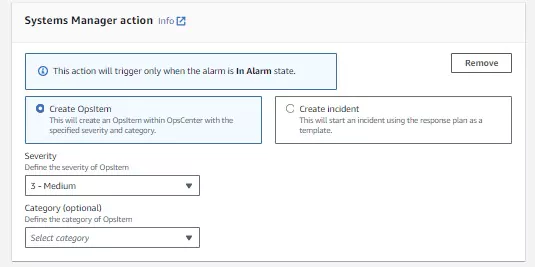
5. Systems Manager action
There are two options within Systems manager actions: create and OpsItem or create an incident.
OpsItem actions create event logs for sys-ops data. If the metric used for the CloudWatch alarm is tracking cost or performance, this action will log an event when those values reach a certain level. I will trigger a Cost event log with this configuration when the cost’s severity with this configuration is only considered medium. This will allow me to intervene before my price is beyond my budget.
Creating an incident will trigger a pre-made response plan. These plans are created in the Incident Manager service in AWS first and then can be linked to actions required for certain metrics.
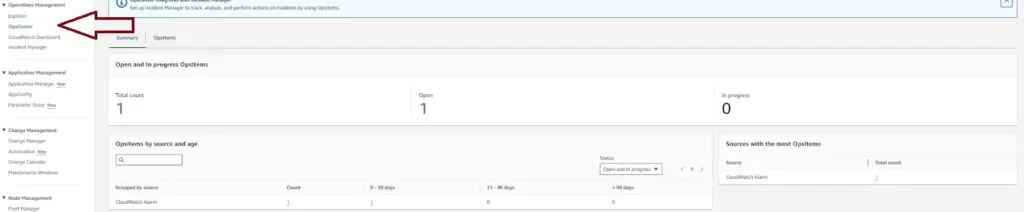
OpsItem Logs are found on the Systems Manager page of the AWS console. Click on OpsCenter in the left vertical menu to see the list of configured alarms.
Serverless computing is on the rise, having already earned the mantle of “The Next Big Thing”. For developers, serverless computing means less concern regarding infrastructure when deploying code, as all computing resources are dynamically provisioned by the cloud provider.
Azure pricing is generally on a pay-as-you-use model and is based on resources consumed – which is in line with modern business principles of “on-demand”, flexibility and rapid scaling.
We’ll look at some of the big players in this space, including what to look out for when considering the right partner when it comes to serverless computing for your organization.
The Serverless Landscape
As technology moved from mainframes to PCs, to the appearance of “the Cloud” in the mid-2000s, there has been a move towards increased efficiency, better use of resources, and lower costs.
A decade later, “serverless” entered the mainstream conversation and is now recognized almost universally. The term has been linked to Backend as a Service (BaaS), such as the authentication services offered by providers like Facebook; or Function as a Service (Faas), where applications with server-side logic are run over stateless containers, and completely managed by 3rd party providers.
This popularity has been further served by leading technology companies offering their own implementations: AWS offering its AWS Lambda since 2014, Microsoft with its Functions architecture for Azure, and of course Google Cloud Functions.
AWS Lambda
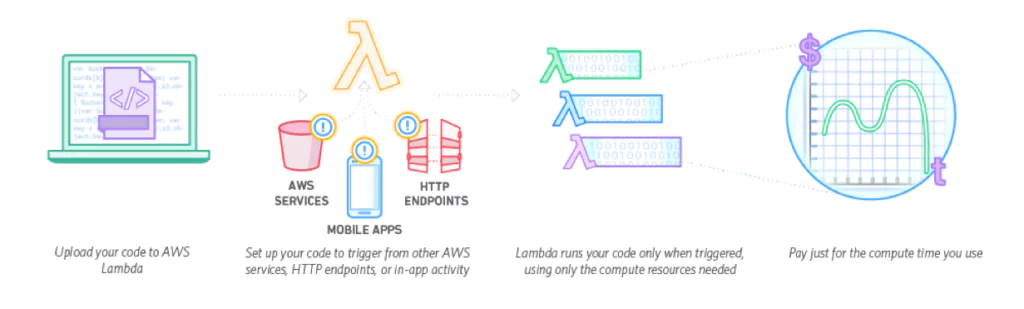
AWS Lambda is a serverless computing platform, implemented on top of AWS platforms such as EC2 and S3. AWS Lambda stores and encrypts your code in S3. When a function is requested to run, a “container” is created using your runtime specifications, deployed to one of the EC2 instances in its compute farm, and that function is executed.
When a Lambda function is created, you need to specify things like the runtime environment, memory allocation, roles, and the method to execute. You can build Lambda functions in Node, Java, Python, and C#, and AWS Lambda seamlessly deploys your code, does all the administration, maintenance, and security patches, and provides built-in logging and monitoring through Amazon CloudWatch.
General positive feedback about Lambda is that it’s simple to set up, pricing is excellent, and it integrates with other internal AWS products such as RDS and Elastic Beanstalk.
When it comes to drawbacks of the solution, there have been 2 main areas where there has been criticism:
“Cold Start”: Creating a temporary container (that is subsequently destroyed) can take between 100 milliseconds to 2 minutes, and this delay is referred to as “cold start”.There are various workarounds to negate this, but it is something important to be aware of.
Computational Restrictions: Being based on temporary containers means that usable memory is limited, so functions requiring a lot of processing cannot be handled by AWS Lambda. Again workarounds are available, such as using a step function.
Additionally, there is an element of “lock-in”, as choosing to go with AWS invariably means you’ll be integrating (and become reliant on) other AWS tools and products in the Amazon ecosystem.
Security for AWS Lambda is impressive, starting with securing your code’s access to other AWS services through the built-in AWS SDK, and integration with AWS Identity and Access Management (IAM). Code is run within a VPC by default, or you can choose to configure AWS Lambda to access resources behind your own VPC. AWS Lambda is SOC, HIPAA, PCI, ISO compliant.
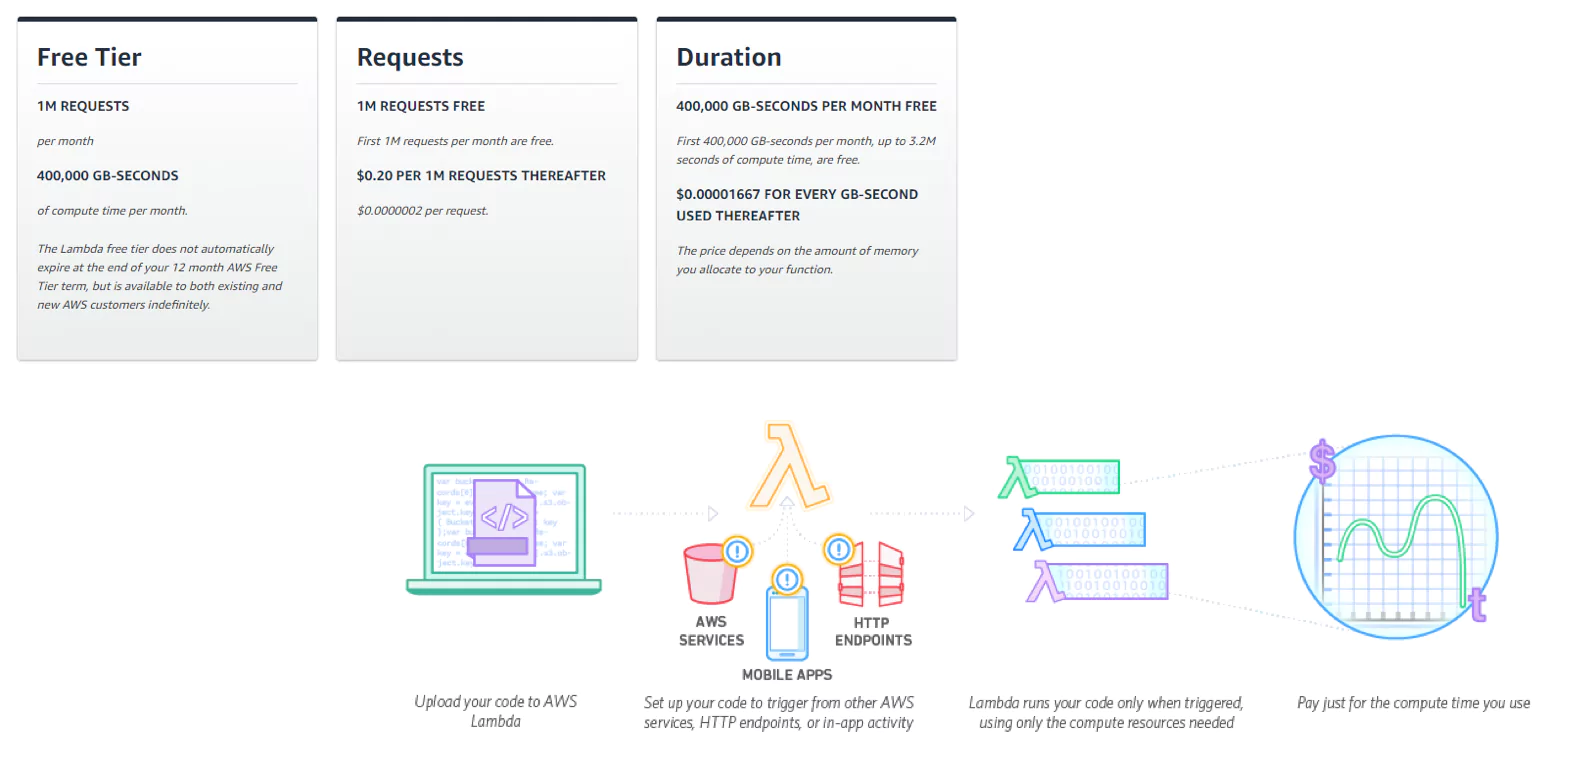
Pricing is per 100ms your code executes, and the number of times your code is triggered – meaning that you don’t pay anything when your code is not running.
The Lambda free tier includes 1m free requests per month and 400,000 GB-seconds of compute time per month. After this, it’s $0.20 per 1m requests, and $0.00001667 for every GB-second used.
Azure Functions
Azure Functions lets you develop serverless applications on Microsoft Azure. Like the other “serverless” solutions, with Microsoft’s Azure, you just need to write the code, without worrying about a whole application or the infrastructure to run it.
Languages supported include C#, F#, Node.js, Java, or PHP, and like AWS Lambda and Google’s Cloud Function offerings, you only pay for the time your code runs.
Advantages of Azure Functions include flexible development, where you can code your functions right in the portal or deploy through GitHub, Visual Studio Team Services, and other supported development tools; the Functions runtime is open-source and available on GitHub; you can use your favorite libraries with support for NuGet and NPM, and integrations with other products in the Microsoft ecosystem.
Integrations are impressive, with the following supported: Azure’s Cosmos DB, Event Hubs, Event Grid, Mobile Apps (tables), Notification Hubs, Service Bus (queues and topics), Storage (blob, queues, and tables), GitHub (webhooks) and Twilio (SMS messages).
Like the other solutions, one of the main disadvantages is vendor lock-in; by going the route of Microsoft Azure, you will in many ways be pinning your colors to the Microsoft mast, which is not for everyone.
Security-wise, you can protect HTTP-triggered functions using OAuth providers such as Azure Active Directory, Facebook, Google, Twitter, and Microsoft Account.
There are 2 types of pricing plans:
Consumption plan: You only pay for the time that your code runs
App Service plan: Run your functions just like your web, mobile, and API apps. When you are already using App Service for your other applications, you can run your functions on the same plan at no additional cost
The Consumption plan is billed on a per-second resource consumption and executions basis.
Execution time is at $0.000016 per GB-second, with 400,000 GB-seconds free per month, and Total Executions is billed at $0.20 per million executions, with 1 million executions free per month.
There are also various support plans available (with an additional cost element).
Google Cloud Functions
Google Cloud Functions is Google’s serverless solution for creating event-driven applications.
With Google Cloud Functions, you can create, manage, and deploy Cloud Functions via the Cloud SDK (Gcloud), Cloud Console web interface, and both REST and gRPC APIs, and build and test your functions using a standard Node.js runtime along with your favorite development tools.
Cloud Functions can be deployed from your local machine or from a source repository like GitHub or Bitbucket.
Pricing
Google cloud functions pricing is based on the number of requests to your functions and compute resources consumption, rounded to the nearest 100 milliseconds, and of course, only while your code is running.
The free tier includes 400,000 GB-seconds, and 200,000 GHz-seconds of compute time.
Advantages of Google Cloud Functions include an excellent free offering to get started ($300 free credit during the first year, and 5GB of storage free to use forever after that), easy integration with other Google Cloud Services like Kubernetes Engine, App Engine or Compute Engine; and detailed and well-managed documentation.
Criticisms of Google’s offering have included high support fees, a confusing interface, and higher (and more complex) pricing.
Serverless Simplicity
Going serverless has a number of advantages, including reduced complexity, lowering administrative overhead, cutting server costs, reduced time to market, quicker software releases, and developers not having to focus on server maintenance, among others. For some, it’s a no-brainer.
When it comes to which solution to go with, particularly when it comes to AWS Lambda, Azure Functions, and Google Cloud Functions, the answer is less obvious.
Each has its own advantages and quirks, and each one will try and tie you into its ecosystem. Overall, it seems that Google is lagging behind from a features perspective and that while Azure is offering a solid solution, AWS Lambda, the oldest on the block, offers a more complete product.
The choice is yours, as we look forward to many more exciting developments in this space.
AWS, GCP and Azure cloud services are invaluable to their enterprise customers. When providers like Microsoft are hit with DNS issues or other errors that lead to downtime, it has huge ramifications for their users. The recent Azure cloud services outage was a good example of that.
In this post, we’ll look at that outage and examine what it can teach us about enterprise cloud services and how we can reduce risk for our own applications.
The risks of single-supplier reliance and vendor lock-in
Cloud services have gone from cutting-edge to a workplace essential in less than two decades, and the providers of those cloud services have become vital to business continuity.
Microsoft, Amazon, and Google are known as the Big 3 when it comes to cloud services. They’re no longer seen as optional, rather they’re the tools that make modern enterprise possible. Whether it’s simply external storage or an entire IaaS, if removed the damage to business-grade cloud service users is catastrophic.
Reliance on a single cloud provider has left many businesses vulnerable. Any disruption or downtime to a Big 3 cloud services provider can be a major event from which an organization doesn’t recover. Vendor lock-in is compromising data security for many companies.
It’s not difficult to see why many enterprises, both SMEs and blue-chip, are turning to 3rd party platforms to free themselves from the risks of Big 3 reliance and vendor lock-in.
What is the most reliable cloud service vendor?
While the capabilities enabled by cloud computing have revolutionized what is possible for businesses in the 21st century, it’s not a stretch to say that we’ve now reached a point of reliance on them. Nothing is too big to fail. No matter which of the Big 3 hosts your business-critical functions, a contingency plan for their failure should always be based on when rather than if.
The ‘Big 3’ cloud providers (Microsoft with Azure, Amazon with AWS, and Google’s GCP) each support so many businesses that any service disruption causes economic ripples that are felt at a global level. None of them is immune to disruption or outages.
Many business leaders see this risk. The issue they face isn’t deciding whether or not to mitigate it, but finding an alternative to the functions and hosted services their business cannot operate without.
Once they find a trusted 3rd party platform that can fulfill these capabilities (or, in many cases, exceed them) the decision to reinvest becomes an easy one to make. If reliability is your key concern, a 3rd party platform built across the entire public cloud ecosystem (bypassing reliance on any single service) is the only logical choice.
Creating resilience-focused infrastructure with a hybrid cloud solution
Hybrid cloud infrastructures are one solution to vendor lock-in that vastly increases the resilience of your infrastructure.
By segmenting your infrastructure and keeping core business-critical functions in a private cloud environment you reduce vulnerability when one of the Big 3 public cloud providers experiences an outage.
Azure, AWS, and GCP each offer highly valuable services to give your organization a competitive edge. With a 3rd party hybrid solution, these public cloud functions can be employed without leaving your entire infrastructure at risk during provider-wide downtime.
When the cloud fails – the 2021 Azure outages
This has been demonstrated in 2021 by a string ofservice-wide Azure outages. The largest of these wason April 1st, 2021. A surge in DNS requests triggered a previously unknown code defect in Microsoft’s internal DNS service. Services like Azure Portal, Azure Services, Dynamics 365, and even Xbox Live were inaccessible for nearly an hour.
Whilst even the technically illiterate know the name Microsoft, Azure is a name many unfamiliar with IT and the cloud may not even be aware of. The only reason the Azure outage reached the attention of non-IT-focused media was the impact on common consumer services like Microsoft Office, Xbox live services, Outlook, and OneDrive. An hour without these Microsoft home-user mainstays was frustrating for users and damaging for the Microsoft brand, but hardly a cause for alarm.
For Microsoft’s business customers, however, an hour without Azure-backed functionality had a massive impact. It may not seem like a long time, but for many high data volume Azure business and enterprise customers, an hour of no-service is a huge disruption to business continuity.
Businesses affected were suddenly all too aware of just how vulnerable relying on Azure services and functions alone had made them. An error in DNS code at Microsoft HQ had left their sites and services inaccessible to both frustrated customers and the staff trying to control an uncontrollable situation.
Understanding the impact of the Azure outage
Understanding the impact of the Azure Outages requires having a perspective of how many businesses rely on Azure enterprise and business cloud services. According to Microsoft’s website, 95% of Fortune 500 companies ‘trust their business on Azure’.
There are currently over 280,000 companies registered as using Microsoft Azure directly. That’s before taking into account the companies that indirectly rely on Azure through other Microsoft services such as Dynamics 365 and OneDrive. Azure represents over 18% of the cloud infrastructure and services market, bringing Microsoft $13.0 million in revenue during 2021 Q1.
Suffice to say, Microsoft’s Azure services have significant market penetration across the board. Azure business and enterprise customers rely on the platform for an incredibly wide range of products, services, and solutions. Every one of serves a business-critical function.
During the Azure outage over a quarter of a million businesses were cut off from these functions. When the most common Azure services include the security of business-critical data, storage of vital workflow and process documentation, and IT systems observability, it’s easy to see why the Azure outage has hundreds of businesses considering 3rd party cloud platforms.
It’s not only Azure
Whilst Azure is the most recent of the Big 3 to experience a highly impactful service outage, the solution isn’t as simple as migrating to AWS or GCP. Amazon and Google’s cloud offerings have been historically as prone to failure as Microsoft’s.
In November 2020 a large AWS outage rendered hundreds of websites and services offline. What caused the problem? A single Amazon service (Kinesis) responded badly to a capacity upgrade. The situation then avalanched out of control, leading many to reconsider their dependency on cloud providers.
Almost exactly a year before this in November 2019, Google’s GCP services also experienced a major global services outage. Whilst GCP’s market reach isn’t as large as its competitors (GCP held 7% market share in 2020 compared to AWS 32% and Azures 19%), many business-critical tools such as Kubernetes were taken offline. More recently, in April 2021 many GCP-hosted Google services such as Google Docs and Drive were taken offline by a string of errors during a back-end database migration.
The key takeaway here is that, regardless of vendor choice, any cloud-based services used by your business will experience vendor-induced downtime. As the common cyber-security idiom goes, it’s not if but when.
Beating vendor lock-in with 3rd party platforms
Whilst there is no way to completely avoid the impact of an industry giant like Microsoft or Amazon experiencing an outage, you can protect your most vital business-critical functions by utilizing a cross-vendor 3rd party platform.
One area many Azure customers felt the impact of the outage was the removal of system visibility. Many Azure business and enterprise-grade customers rely on some form of Azure-based monitoring or observability service.
During the April 2021 outage, vital system visibility products such as Azure Monitor and Azure API Management were rendered effectively useless. For many organizations using these services, their entire infrastructure went dark. During this time their valuable and business-critical data could have been breached and they’d have lacked the visibility to respond and act.
How Coralogix protects your systems from cloud provider outages
The same was true for AWS customers in November 2020, and GCP ones the year prior. This is why many businesses are opting for a third-party platform like Coralogix to remove the risk of single provider reliance compromising their system visibility and security.
Coralogix is a cross-vendor cloud observability platform. By using our robust platform that draws on functionality from all 3 major cloud providers, our platform users protect their systems and infrastructure from the vulnerabilities of vendor lock-in and service provider outage.
As a third-party platform Coralogix covers (and improves upon) many key areas of cloud functionality. These include observability, monitoring, security, alerting, developer tools, log analytics, and many more. Coralogix customers have the security of knowing all of these business-critical functions are protected from the impact of the next Big-3 service outage.
When building a microservices system, configuring events to trigger additional logic using an event stream is highly valuable. One common use case is receiving notifications when errors are seen in one of your APIs. Ideally, when errors occur at a specific rate or frequency, you want your system to detect that and send your DevOps team a notification.
Since AWS APIs often use stateless functions like Lambdas, you need to include a tracking mechanism to send these notifications manually. Amazon saw a need for a service that will help development teams trigger events under custom conditions. To fill this need, they developed CloudWatch Events and subsequently EventBridge.
Introduction to CloudWatch Events
CloudWatch Events and EventBridge are AWS services that deliver data to a target upon occurrence of certain system events. They work on the same backend functionality, with EventBridge having a few more implemented features. System events supported include operational changes, logging events, and scheduled events.
CloudWatch Events will trigger a subsequent event when a system event occurs, sending data to another service based on your setup. Triggered services can include calling Lambda functions, sending SNS notifications, or writing data to a Kinesis Data Stream.
Event Triggers
AWS represents all events with JSON objects that have a similar structure. They all have the same top-level fields that help the Events service determine if an input matches your requested pattern. If an event matches your pattern, it will trigger your target functionality.
You can use commands to write directly to EventBridge from AWS services like Lambda. Some AWS services like CloudTrail and external tools can also automatically send data to EventBridge. External sources with AWS integrations can also be used as event triggers.
Event Buses
Event buses receive events from triggers. Event triggers and event rules both specify which bus to use so events can be separated logically. Event buses also have associated IAM policies that specify what can write to the bus and update or create event rules and event targets. Each event bus can support up to 100 rules. If you require more event rules, you must use another event bus.
Event Rules
Event rules are associated with specific event buses. Each rule determines whether events meet certain criteria. When they do, EventBridge sends the event to the associated target. Each rule can send up to 5 different targets which process the event in parallel.
AWS provides templates to create rules based on data sources. Users can also set up custom rules which further filter data based on its contents. For a complete list of available filtering operations, see the AWS specification for content-based filtering.
Event Targets
Event targets are AWS endpoints triggered by events matching your configured pattern. Targets may just receive some of the event trigger data directly for processing.
For example, you can trigger an AWS Lambda function with the incoming event data, using Lambda to process the event further. Targets can also be specific commands like terminating an EC2 instance.
How to Set Up CloudWatch Events in EventBridge
Now that we have covered some parameters of CloudWatch Events, let’s walk through an example of how to set up an event trigger and target.
In this example, we will use the EventBridge interface to set up a rule. The EventBridge interface is very similar to the interface available in CloudWatch. The rule we make will trigger a Lambda when an API Gateway is hit with invalid input. DevOps teams commonly see invalid inputs when nefarious users are trying to get into your API.
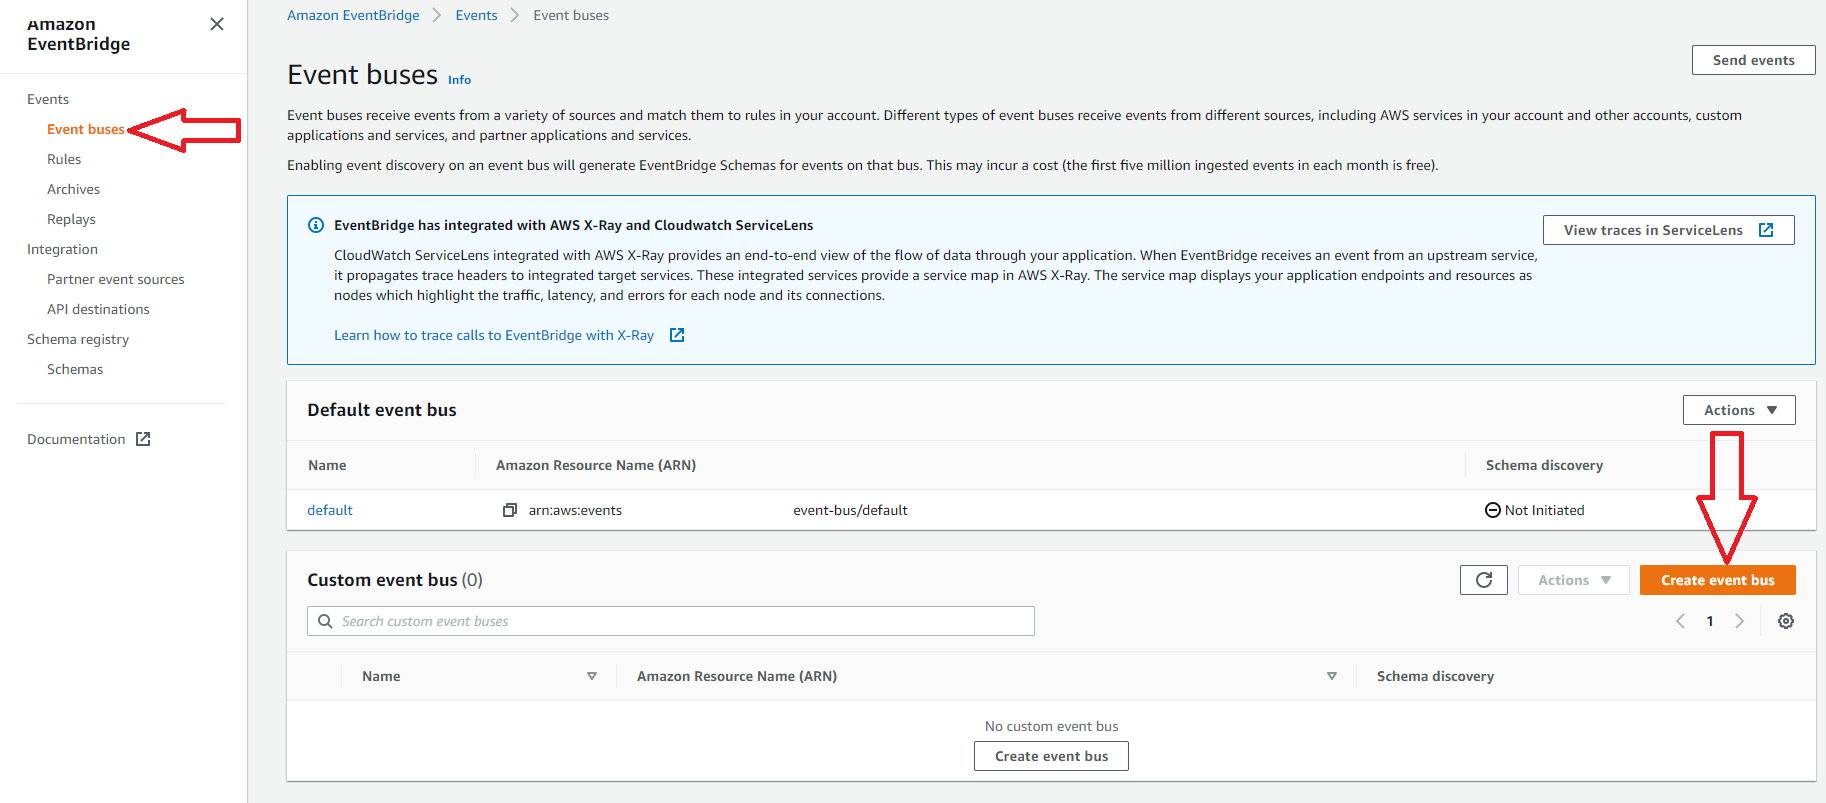
1. Create a New Event Bus
This step is optional since AWS does provide a default event bus to use. In this example, we will create a new event bus to use with our rule. Since rules apply to only one event bus, it is common to group similar rules together on a bus.
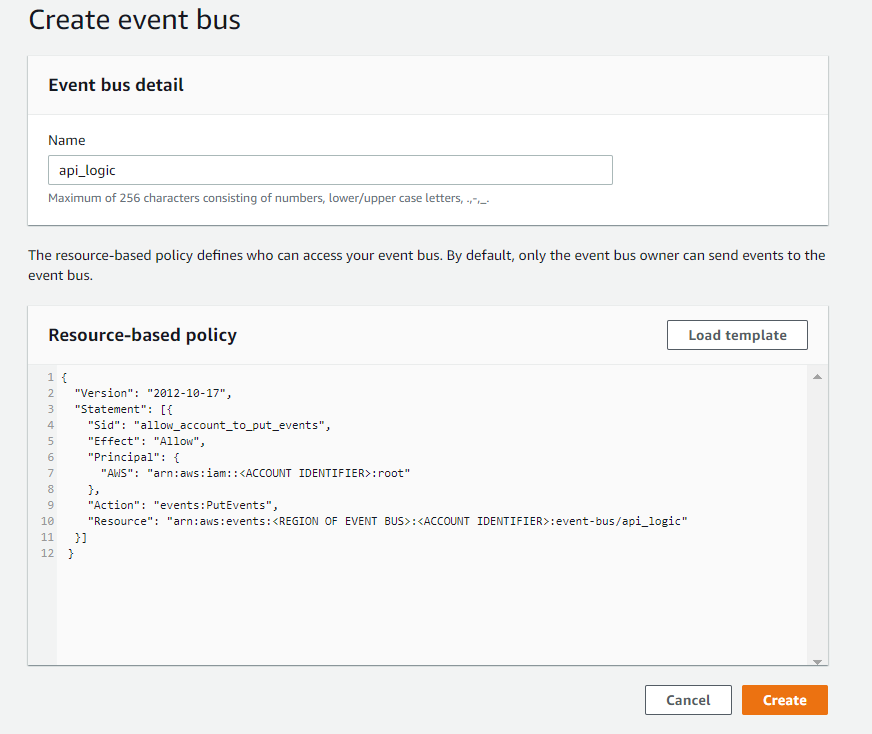
2. Name and Apply a Policy to the New Bus
To create your bus, add a name and a policy. There is an AWS template available for use by clicking the load template button, as shown below.
This template shows three common cases that could be used for permissions depending on the triggers and targets used. For more information about setting up the IAM policy, see the AWS security page for EventBridge.
The example below shows permissions for an account to write to this event bus. When ready, press the create button to finish creating your event bus.
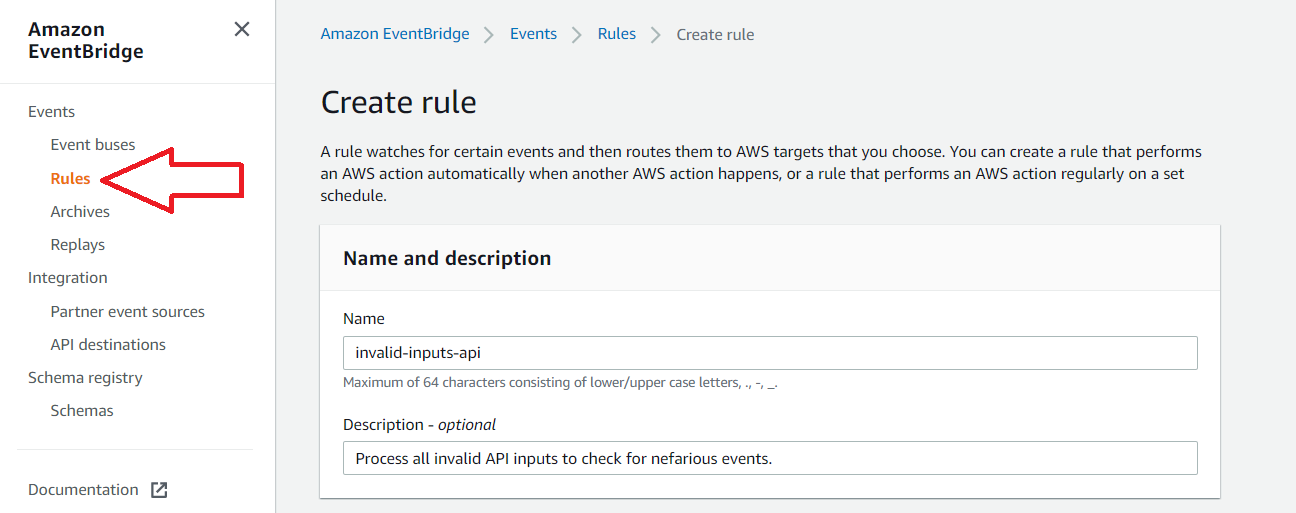
3. Navigate to the Rules Section in the Amazon EventBridge Service
In this example, we will skip creating an event bus and use the default provided by AWS. Add a name and optionally add a description for the new rule.
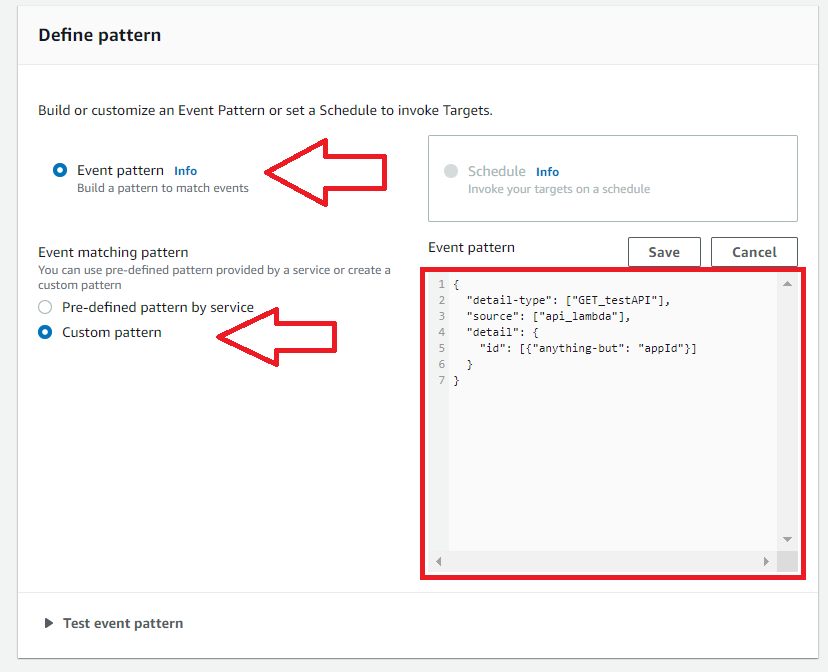
4. Select Event Pattern
Here there is an option between two types of rule: event pattern and schedule. Use event pattern when you want to trigger the rule whenever some specific event occurs. Use schedule when you want to trigger the rule periodically or using a cron.
5. Select Custom Pattern
Here there is an option between two types of pattern matching. AWS will route all data for the source through your event bus when you use pre-defined pattern by service.
Since we want only specific events from the Lambda behind our API, we will choose custom pattern. The pattern below will look at event values sent from our Lambda function to the event bus. If the event matches our requirements, EventBridge sends the event to the target.
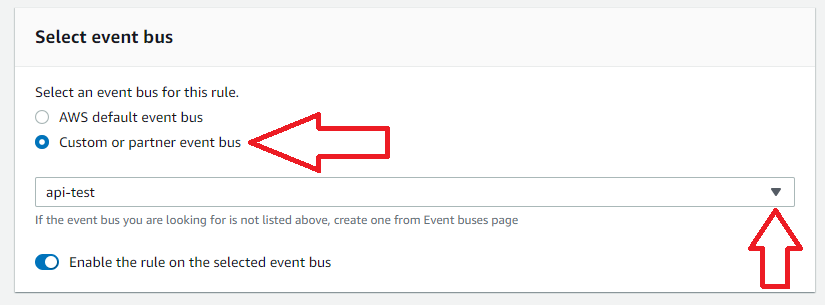
6. Select the Event Bus
Select the event bus for this rule. In this case, we will select our custom bus created in Step 2.
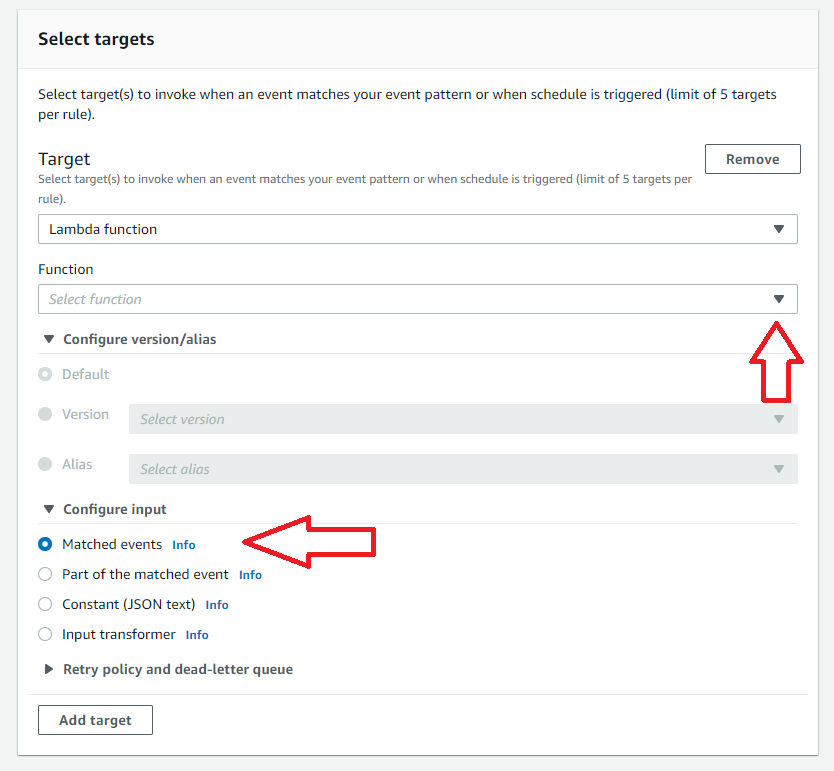
7. Select Targets
Select targets for your rule by selecting the target type and then the associated instance of the type. In this case, a Lambda function will be invoked when an event matching this rule is seen.
By selecting Matched events, the entire event content will be sent as the Lambda input. Note there is also the capability to set retry policies for events that cause errors in the target functions. After this step, press Create Rule to complete the EventBridge setup.
Once the event bus and rule are created as above, writing to the EventBridge inside the API’s Lambda function will trigger your target Lambda. If using a serverless deployment, the AWS-SDK can be used to accomplish this.
Processing in the target Lambda should track when errors occur. Developers can create metrics from the errors and track them using custom microservices or third-party tools like Coralogix’s metrics analytics platform.
You can also send raw data to Coralogix for review by directly writing to their APIs from EventBridge instead of hitting a Lambda first. EventBridge supports outputs that directly hit API Gateways, such as the one in front of Coralogix’s log analytics platform.
Wrap Up
Amazon enhanced CloudWatch Rules, creating a unique tool called EventBridge. EventBridge allows AWS users to process events from many different sources selectively. Processing data based on content is useful for processing large, disparate data sets.
Information tracked in EventBridge can also be used for gaining microservice observability. EventBridge uses triggers to send data to an event bus. Event rules are applied to each bus and specify which targets to invoke when an event matches the rule’s pattern.
In the example above, EventBridge’s configuration will detect invalid API call events. This data is helpful, but at scale will need further processing to differentiate between a nefarious attack and simple errors.
Developers can send data to an external tool such as Coralogix to handle the analysis of the API data and to detect critical issues.
Serverless computing is becoming increasingly popular in software development due to its flexibility of development and the ability it affords to test out and run solutions with minimal overhead cost. Vendors like AWS provide various tools that enable businesses to develop and deploy solutions without investing in or setting up hardware infrastructures.
In this post, we’ll cover the many different services AWS observability tools provides for supporting serverless computing.
AWS Service Descriptions
To break down which service to choose, we will first look at each of these services’ capabilities and tradeoffs. Each of the tools described here works as a serverless computing engine, but they each have different features that will provide advantages and disadvantages depending on your specific use case.
Ideally, users will understand the project’s requirements before choosing a service to ensure the service meets your needs. Here is a brief description of each of the services we will compare:
Elastic Compute Cloud (EC2)
EC2 is an implementation of infrastructure-as-a-service (IaaS) that allows users to deploy virtual computing environments or instances. You can create instances using templates of the software configuration called Amazon Machine Images (AMIs).
Customizing EC2 is an option, making it a powerful option for experienced users. With the flexibility of EC2 comes additional complexity compared to other solutions when it comes to setting up and maintaining the service. AWS uses EC2 to provide both Fargate and Lambda services to AWS users.
Fargate with ECS and EKS
AWS Fargate provides a way to deploy your serverless solution using containers. Fargate is an implementation of container-as-a-service (CaaS). Amazon Elastic Container Service (ECS) and Amazon Elastic Kubernetes Service (EKS) are other AWS-managed services used to manage containers. In this article, both ECS and EKS are discussed as separate deployment options since they have different features.
Running Fargate on both ECS and EKS allows you to run the required application without provisioning, monitoring, or managing the compute infrastructure as required when using EC2. Docker containers package applications that either ECS or EKS can then launch.
Lambda
Lambda is a compute service that runs without provisioning or managing servers. Strictly speaking, it is an implementation of a function-as-a-service (FaaS). It is a stateless service which will run on an automatically provisioned infrastructure when it is triggered. Many AWS services have a built-in ability to trigger Lambda functions, making them highly functional in AWS designs.
[table id=65 /]
Scalability and Launch Methodology
Each compute service is able to scale to meet the demands of the workload, though each type will scale using a different method. In the case of Fargate and EC2, the user is required to set up autoscaling, while in Lambda this will occur automatically.
EC2
Users may automatically add or remove EC2 instances by configuring EC2 auto-scaling. There are different auto-scaling types used for EC2, including fleet management, scheduled scaling, dynamic scaling, and predictive scaling.
Fleet management will automatically detect EC2 instances that are unhealthy or impaired in some way. AWS automatically terminates and replaces detected functions with new instances to ensure consistent behavior of your compute function.
If the load on EC2 is predictable, users can configure scheduled scaling to add or remove EC2 instances ahead of time. Otherwise, typically users will employ dynamic auto-scaling and predictive auto-scaling individually or together. Dynamic auto-scaling uses the demand curve of your application to determine the required provisioning of your instance. Predictive auto-scaling uses machine learning implemented by AWS to schedule EC2 instance scaling based on anticipated load changes.
Fargate with ECS
Fargate runs tasks (which carry out the required compute logic) within a cluster. The ECS scheduler is responsible for ensuring tasks run and gives options for how a scheduler may instantiate the task. Scheduler options include: using a service to run and maintain a user-specified number of tasks simultaneously, using a CloudWatch Events rule to trigger a task periodically, creating a custom scheduler within ECS which can use third-party schedulers, or manually running a task using the RunTask command from the AWS Console or another AWS service.
Using ECS, tasks may run as always-on. Using tools like ECS services will also ensure that it will restart with a cleared memory cache even if the task fails. While Fargate with ECS cannot be triggered by as many other AWS services as Lambda can, continuously running the task allows you to use library functions to listen for events in other services. For example, AWS Kinesis and AWS SQS can both send events to a task listening for events.
ECS also has auto-scaling capabilities using the AWS Application Auto Scaling service. ECS publishes metrics to CloudWatch, including average CPU and memory usage. These are then used to scale out services according to settings to help deal with peak demand and low utilization periods. Users may also schedule scaling for known changes in usage.
Fargate with EKS
Amazon EKS allows the configuration of two types of auto-scaling on Fargate pods running in the cluster. The EKS cluster can scale with both the Kubernetes Vertical Pod Autoscaler (VPA) and the Kubernetes Horizontal Pod Autoscaler (HPA).
The VPA will automatically adjust CPU and memory settings for your Fargate pods. The automatic adjustments help improve resource allocation within your EKS cluster so pods can work together on the same node more efficiently. To use the VPA, users must install the Kubernetes metric server, which tracks the resource usage in the cluster. The VPA then uses this information to adjust the pod configuration.
Horizontal scaling allows the node to add or remove Fargate pods from the node based on CPU utilization. During setup, users configure a requested utilization percentage, and the HPA will automatically scale to try and hit the given target. Using the Kubernetes aggregation layer, users can also plug in third-party tools such as Prometheus to aid in task scaling and visibility into usage.
Once tasks are running in pods, functionality within the Fargate task is like using ECS. Users may ensure at least some pods are always on having functions running which track events from other AWS services like AWS Kinesis or AWS SQS. Again, there are fewer options for automatic triggering of Fargate functions running in pods than is available for Lambdas.
Lambda
Lambda functions are scalable by design. These functions will launch more instances automatically to handle demand increases. You can limit the number of concurrently running functions if required for your needs, having as little as one instance up to a maximum of 1000 concurrent Lambda functions running at once per AWS account. AWS may increase this number upon request.
When first launched, a Lambda instance requires extra time, or cold-start time, to set up the function’s instance. Once an instance exists, it can launch a new function more quickly. Instances live for 15 to 30 minutes, after which time they are closed if not in use.
You can invoke Lambdas directly using the AWS CLI, Console, and AWS SDK, or use one of the many different AWS services that can trigger Lambda functions. Services that can trigger Lambda include API Gateway, DynamoDB streams, S3 streams, SQS, and many other services. For a complete list, see the AWS website.
Compute Costs
Compute costs in AWS are typically a driving factor in which service to use for creating functions. In general, there is a break-even point for each type of function where one compute service will be the same cost as another.
This point is based on how many requests your function must handle in a period of time, how long each computation must run for, and the amount of memory required to handle your workload. Below is a breakdown of the pricing types available for the compute service types and when it is ideal to choose one option over another.
EC2
When running EC2, the instance requires time to set up resources before use. This initial setup time has some latency. But using the instance repeatedly, startup times will be faster after the initial latency. With EC2, users pay for computing capacity while the instance is running.
Among other considerations, users should consider the tradeoff between instance startup latency and cost in the system’s design. EC2 is well suited for long-running tasks, and a required long-running task may be less costly running in EC2 than other services.
AWS has four pricing models for the user to choose from. These models are On-Demand, Spot Instances, Reserved Instances, and Dedicated Hosts.
In On-Demand pricing, similar to Lambda and Fargate, you pay for what you use based on the region your EC2 instance is deployed. You pay either by the hour or by the second, depending on your EC2 instance setup. This pricing model is well suited for users who cannot predict the load that their EC2 instances will require, or if you have short spiky loads, or while you are developing a new compute function.
Spot instances work similarly to On-Demand pricing in that you pay for what you use. However, users can set a price limit on what they want to pay to run their EC2 instance. If the compute cost is above the user’s set limit, the instance will not run (or will terminate). This could save users significantly if they do not require real-time processing or if the cost to run instances is the most important development factor.
Reserved instance pricing means the user has reserved capacity on the AWS servers. The cost to run the instances is significantly less than On-Demand pricing, but users should only consider this model if they have predictable or steady loads.
With Dedicated Host pricing, users can request a physical EC2 server that will run only their EC2 instances. This is especially useful if users have strict compliance requirements since it gives users control over the physical system their compute code runs on. Pricing with dedicated hosts can be done On-Demand or as a Reserved Instance.
Fargate with ECS and EKS
Like with Lambdas, there is a tradeoff between a task’s duration and the allocated memory resources. Cost per unit time will increase with a higher memory allocation for the function. AWS calculates pricing in the same way for both ECS and EKS clusters running Fargate.
Containers running Fargate tasks will cost users based on the number of vCPUs (virtual CPUs) allocated and memory resources used. Runtime is from when the container pulls images from the ECR until the task terminates. AWS rounds task and pod duration to the nearest second and charges users for a minimum of 1 minute of runtime for each new task or pod. The cost per vCPU hour also depends on the region in which the service is running.
Users can also request spot pricing, which has the same cost model based on vCPU and duration, but both tasks and pods will terminate if the cost is above a specified limit. The spot price is determined by long-term EC2 trends looking at both supply and demand to calculate current EC2 capacity. AWS calculates the spot price at the beginning of each instance-hour for your running instance.
The user may also choose between different pricing models. Choices are to use either on-demand pricing where users pay for run time to the nearest second as the pod uses compute capacity (like with ECS), or savings plans where users make commitments to a consistent amount of usage for 1 or 3 years.
Lambda
AWS Lambdas are limited duration functions. They can only run for a maximum of 300 seconds before the function will timeout and shut down the process, even if the function is in the middle of a process. Depending on what triggers the Lambda, there may be shorter duration limits. If an API Gateway triggers Lambda, the function may only live for 30 seconds.
Lambda bases its pricing on how long a function runs. AWS previously charged the user for every 100ms the function would run. In December 2020, this cost model changed to charging to the nearest 1ms.
Memory limits of the Lambda also affect the cost and runtime of the function. The higher the memory, the faster the function may run, but the more cost per 100ms. Users must analyze their functions to find the most efficient balance between run time, memory requirements, and cost.
Lambda is a proper solution for short-lived, fast tasks but is less suited for long-running tasks. If you are using the Lambda to call another function or API, which may take significant time to respond, you will be increasing the required Lambda duration.
Security
In all cases, security is a shared responsibility between AWS and the user. AWS ensures the security of the infrastructure running in the cloud. You can learn more about how AWS achieves its compliance standards on the AWS compliance programs page.
When you set up any of the compute resources, you must provide permissions to allow the function or container to perform actions on other AWS resources. To do this, you must set up IAM roles assumed by the service while running. Each of the compute options uses IAM. The differences between them are in how the roles are created and maintained.
EC2
EC2 computing requires users to configure and maintain security on multiple parts of the service. Users have full root access to virtual instances and are responsible for securing them. Recommended security practices include disabling password-only access for guests and adding multi-factor authentication (MFA) for access to the instance. Users are also responsible for updating and patching the virtual instance, and this includes security updates.
Amazon maintains a firewall that it forces all traffic to transmit through. EC2 users must set explicit permissions to allow traffic through the firewall to the virtual instance. The firewall settings are not accessible through the virtual instance directly. Instead, users configure using their certificate and key available in the AWS console.
Your AWS secret access key obtained with your AWS user must sign commands to grant API access for launching and terminating virtual machines, changing firewall permissions, and other security functions. This user must have IAM permissions set to perform these maintenance and setup tasks.
AWS IAM is used within the running virtual instance to grant permission for EC2 to use and control other AWS services from within the instance.
Fargate with ECS
With Fargate running on ECS, the permissions are associated with the container the task runs in. The user can select an IAM role to use as the task role when creating the container. You must create the IAM role before you can complete the creation of the container.
The IAM role is formed separately from the Fargate task’s deployment and made using the AWS CLI or manually using the AWS Console. Each container can have its own IAM permissions, restricting service access to the user’s requirements.
Fargate with EKS
Amazon EKS supports IAM for authentication and VPC to isolate clusters, running a single control plane for each cluster. In September 2020, AWS implemented the ability to assign EC2 security groups to individual pods running on EKS clusters. Using security groups for pods, the user can run applications with different network security requirements on shared compute nodes. Before this update, users had to run nodes separately if they required different security requirements.
For running a node with pods on an EKS cluster, users must configure several policies in IAM. The user must configure the pod execution role, which allows the pod to make AWS API calls needed for the pod to set itself up. For example, this role will allow the pod to pull required container images from AWS Elastic Container Registry (ECR).
Lambda
While you can create a lambda using the AWS console, it is more common to use a framework such as Serverless to create Lambda services. The Serverless framework enables the setup of IAM roles that each lambda function or the lambda service will assume while running. The Serverless framework will recreate IAM role definitions each time you deploy the Lambda using Serverless. For more information on setting up IAM roles with serverless, see the Serverless IAM roles guide.
Suppose you are using a different method of deployment which does not integrate IAM role creation. In that case, you can create IAM roles manually in the AWS Console or the AWS CLI and link them to an existing lambda in the Lambda Console.
Summary
With the rising popularity of serverless computing, new tools are coming out all the time to support the organizations that are moving in that direction. Since each tool has different features and their own set of advantages and disadvantages, it’s important to have a clear understanding of the project’s scope before jumping in with the first serverless computing solution you run into.
Regardless of which serverless solution you decide is the best fit for your needs, Coralogix can seamlessly ingest and analyze all of your AWS data (and much, much more) for full observability and the most extensive monitoring and alerting solution in the market.
One of the keys to CloudWatch’s success is its no bang, no buck billing cloud cost optimization system. The pricing structure has been designed from the outset to ensure that CloudWatch users only pay for what they actually use. In addition, the CloudWatch Free Tier allows first-time users to test the waters without shelling out.
The downside of this flexibility and adaptability is complexity. In order to optimize cloud cost fairly and accurately, the pricing structure needs to separately track the utilization of a diverse range of system tools and components.
Because developers in a business environment can’t always keep tabs on, say, the precise amount of logging data they collect, customers who aren’t accustomed to CloudWatch can find themselves in the position of a tourist who raided their hotel minibar and is now being billed by the said hotel.
The following article will explain how CloudWatch billing breaks down, and hopefully, give you a clear idea of what you can expect your monthly bill to be.
Dashboards
Dashboards are the simplest feature to cost. CloudWatch allows you to create three Dashboards with 50 metrics for no charge, beyond that each Dashboard you create costs $3 per month. In comparison, Coralogix charges nothing extra for dashboards and includes this as part of your processing costs.
Logging
AWS logging has three stages called Collect, Store, and Analyse. Collect involves the actual logging of events in a process called data ingestion. Store involves archiving log data for future use. Analyse is the process of running queries to extract data and insights from the log.
CloudWatch’s Free Tier allows you to process 5GB of logging data for no charge. Beyond this, AWS charges you a small amount to perform Collect, Analyse, and Store stages. Data ingestion in the Collect stage costs $0.50 per GB. Running queries in the Analyze stage costs $0.03 per GB. Archiving logs in the Store is billed at $0.005 per GB.
A good cost estimate for CloudWatch logs can be arrived at by adding these three costs together and multiplying them by the amount of logging data you want to process. Here’s a simple table to show monthly logging costs to process 100, 200, and 300GBs of data.
[table id=47 /]
Vended Logs
Vended logs, such as Amazon VPC flow logs, are published natively by AWS services. Vended logs may potentially save you money because they are available at volume discounts. While they have a number of different delivery outlets such as S3 and Kinesis, this article will focus on CloudWatch logs. The total cost per GB for CloudWatch logs delivery consists of two parts, data ingestion – which involves collecting raw performance data for logs, and data storage – storing the logs in CloudWatch for later viewing. Data ingestion is $0.50 per GB and data storage costs an extra $0.03 per GB. In total, this means vended logging has a cost per GB of $0.53.
The following table gives an estimate of the monthly logging costs for 100, 200, and 300GBs of data.
[table id=48 /]
Metrics
Metrics are one of CloudWatch’s most powerful tools. The ability to perform statistical analysis of metric data coupled with the ability to create custom metrics allows you to monitor system performance from lots of different angles.
CloudWatch allows you to have 50 metrics per Dashboard free of charge. Beyond that, there is a small monthly charge for each additional metric you have. Above the first 10,000 metrics, the monthly cost is tiered. Below is a table showing these tiers.
[table id=49 /]
Coralogix does not charge extra for metrics. The logs2metrics feature is bundled in with your fees when you initially process the data. Moreover, you can categorize your less “valuable” data and pay even less for it.
In addition to the cost of custom metrics, you also need to think about the cost of performing API requests. You can make an API request with get-metric data with up to five statistics per metric. If you request any more, it’s billed as if you created an additional metric. Here is a table showing costs for a range of API request commands.
[table id=50 /]
Billing in the Wild
To give an idea of how the above costs scale in an enterprise application, let’s do some calculations. Suppose you have an application with 200 instances and each instance has 10 custom metrics. AWS estimates that each EC2 Instance contains on average 7 metrics. In addition, applications are producing 10GB of logs per day.
VPC flow logs pricing
To calculate the monthly cost if this application runs 24×7, we first need to ascertain the total number of metrics. Since there are 200 instances with 10 metrics per instance, there are 2000 metrics in total. Now we need to account for the tiered pricing structure shown in the previous table.
It’s helpful to visualise our 2,000 metrics as a tower with the first 10,000 metrics at the base. By looking at our table we can see our 2,000 metrics are priced according to the bottom tier, each metric costing 30 cents per month. The total cost is $600.
Second is the simple cost of log retention. At 10GB per day, we’re producing 300GB of logs per month. We will use our previously declared cost of $241.
Now let’s calculate the cost of API requests. If we assume we’re dealing with a 30 day month and each instance makes one request every 5 minutes, our application makes 1,728,000 requests per month. Now we need to use the same trick we did with custom metrics, visualizing the total API request number as a banded tower. At the base, the first 1,000,000 API requests don’t cost anything. 1,728,000/1,000 * $0.01 = $17.28
The total CloudWatch costs for our application run to $859.28 per month.
Cloudwatch bills in several constituent parts and each of those components sums to a hefty bill. In contrast, Coralogix gives you one simple monthly cost.
Final Thoughts
CloudWatch’s billing system has a reputation for being complex and difficult to understand. The complex, tiered system makes it tricky to work out how much you’ll be paying at the end of the month. Rather than doing your own accounting, simplify your bills and save up to 70% on your logging costs, with Coralogix.
In the previous article, we have created the Continuous Integration (CI) pipeline for a simple Java application. It is now time to start working on the Continuous Deployment (CD) pipeline that will take the Java application and deploy it to AWS. To build the CD pipeline, we will extend the existing AWS Jenkins pipeline. If you have missed the previous article on building Cotinuous Integration solutions for a Java application using Jenkins, make sure you read that first before continuing.
Quick introduction to AWS
Amazon Web Services or simply AWS is a cloud platform offering over 170 cloud-based services available in data centers located worldwide. Such services include virtual servers, managed databases, file storage, machine learning, and many others.
While AWS is the most popular cloud platform, many other providers, including Google Cloud, Microsoft Azure, or DigitalOcean share similar concepts and services to the ones presented here.
In case you don’t already have an AWS account, head over to https://aws.amazon.com/, and create one. You will have 12-months free-tier access, but you still need to enter your billing information and credit card number just in case you go over the free limits.
As a general recommendation, terminate any services once you don’t use them anymore before costs start adding up.
Once you have successfully signed up, you can open the AWS Management console available at https://console.aws.amazon.com/. The console will give you an overview of all the services that AWS has to offer.
AWS Jenkins Pipeline to deploy a Java application
One of the easiest ways to deploy an application to the AWS infrastructure without getting into many technical aspects is using a service called Elastic Beanstalk (EB). From the console overview page, locate the Elastic Beanstalk service.
(01-aws-console.png)
The next step is to create a new application.
(02-eb-create-application.png)
I have named the application calculator, but you are free to call the application as you wish. Since we are trying to deploy a Java application, we need to select the Java platform. Leave the rest of the platform fields to their default values.
(03-eb-new-app-config.png)
You can start the application with a sample code application, just to see that it is running. Since we already have a packaged Java application in the form of a jar file, we can directly use that.
(04-eb-upload-code.png)
Wait for the file upload to complete. Finally, click on Create application. This may take a few minutes to start.
Now click on Environments, select the only environment being displayed, and right on top, you should see the public URL under which the application is available.
(05-eb-environments.png)
If you click on the link displayed, you will get a 404 Not found status code, and that is expected. If you get a different status code, please check the Troubleshooting section within this article. Add /add?a=1&b=2 to the address, and you should see the response.
(06-eb-app.png)
Congratulations! You have just deployed a Java application to AWS with only a few clicks.
How to deploy to AWS from Jenkins
So far, the process has been manual, but it has ensured that our application works on the AWS infrastructure. Since we want to automate this process, we need to use the terminal to do the steps that we did manually.
Fortunately, AWS provides the tools needed to automate this process. The main tool that will allow us to interact with AWS is the AWS CLI, a software tool that has no graphical interface.
The deploy the Java application to AWS from Jenkins, there are a series of steps we need to follow:
Upload the jar archive to AWS S3 (S3 is like Dropbox for the cloud and the main entry point to the AWS infrastructure when dealing with files).
Create a new version of the application within EB by providing the jar achieve, which is now inside S3.
Update the EB environment with the latest application version.
You can easily download and install AWS from https://aws.amazon.com/cli/ . You will find installers for Windows, macOS, and Linux.
(07-aws-cli.png)
After the installation has completed successfully, open any terminal window and run the command aws –version. This will confirm that the installation has been successful and will display the AWS CLI version.
(08-aws-cli-locally.png)
If you have Jenkins installed on macOS, to get AWS CLI to work in Jenkins, you may need to create or adapt the PATH variable with the value: /usr/local/bin:$PATH
How to upload a file to AWS S3 from Jenkins
S3 stands for Simple Storage Service and is the gateway to the AWS infrastructure when working with files. You can see it like Dropbox but for the AWS infrastructure. Let’s go back to the AWS Management Console and select the S3 service.
(09-aws-s3.png)
In S3, files are organized in buckets, which are containers for storing data. Inside buckets, you can store files and folders, just as you would do on your computer.
Let’s continue by creating a bucket for storing our jar archives. Your bucket name needs to be unique, and you may face conflicts if you decide to use common names. I choose to prefix the bucket with my name to avoid naming conflicts.
(10-create-s3-bucket.png)
At this point, all you need to do is remember the name of the bucket and the region in which the bucket has been created (in the screenshot above, the region is us-east-1).
To interact with any AWS service from the CLI, we cannot use our AWS account’s username and password. Not only would this be highly risky, but in many cases also impractical. We will create a special user that will only have access to the services required to perform the tasks needed.
For this reason, from the AWS Management console, identify the block Security, Identity, & Compliance and select the IAM service (Identity and Access Management).
Click on Users > Add user. I will call this user jenkins, so that I can quickly identify it. Make sure to enable the Programmatic access to use this user from the AWS CLI.
(11-iam-user.png)
The next step will handle the Permissions that the user will have. We will use some predefined rules to get started. Select Attach existing policies directly. Using the search field, you can search for permissions, which often include the service name. Make sure that the user has the following permissions: AWSElasticBeanstalkFullAccess, AmazonS3FullAccess.
(12-iam-policies.png)
You can skip the Tags page, and on the Review page, your configuration should look very similar to the screenshot below.
(13-iam-review.png)
If everything looks right, go ahead and create the user. The final page will display the credentials that have been generated.
(14-iam-user-credentials.png)
Make sure that you store these credentials somewhere safe or keep this page open for a while. They won’t be displayed again. In case you lose them, delete the user and repeat the same process.
Now it is time to jump into Jenkins and store these credentials so that we can later use them in our pipeline. Go to Manage Jenkins > Credentials and click on the Jenkins store > Global credentials. If you see a menu item called Add Credentials on the right-hand side, you have reached the right place.
Add for both the access key id and the secret access key (two entries in total). I have used the IDs jenkins-aws-secret-key-id and jenkins-aws-secret-access-key.
(15-jenkins-credentials-add.png)
After adding both credentials, the credentials overview page should look similar to the screenshot below.
(16-jenkins-credentials-overview.png)
By using this approach of storing the credentials within Jenkins, we ensure that this sensitive data does not land into our Git repository, and the use of the values will not be displayed in any logs.
The AWS CLI will automatically pick-up the credentials stored in Jenkins, if we expose them as environment variables using a predefined name. The advantage of using environment variables is that many tools will automatically look for predefined names and use them. This makes the commands shorter and easier to read.
Inside the Jenkinsfile inside the pipeline block, add the following lines:
This will instruct Jenkins to create two environment variables (AWS_ACCESS_KEY_ID, AWS_SECRET_ACCESS_KEY) and initialize them with the values stored in the Jenkins credential store.
Now we have everything in place to use the AWS CLI for uploading the jar archive to AWS S3.
There are two commands that we will execute.
The first command will let AWS know in which region you are operating. In my case, I have used the us-east-1 region for both S3 and EB:
aws configure set region us-east-1
The second command will do the upload from Jenkins to S3:
The copy (cp) command for the S3 service will take two parameters: the source and the destination. During this process, we will rename the jar file.
We will add both of these commands inside the success block of the publishing stage. The simplified pipeline after this step will look as follows:
pipeline { agent any environment { AWS_ACCESS_KEY_ID = credentials('jenkins-aws-secret-key-id') AWS_SECRET_ACCESS_KEY = credentials('jenkins-aws-secret-access-key') }
stages { stage('Build') { // build stage } stage('Test') { // test stage } stage('Publish') { steps { sh './mvnw package' // bat '.mvnw package' } post { success { archiveArtifacts 'target/*.jar' sh 'aws configure set region us-east-1' sh 'aws s3 cp ./target/calculator-0.0.1-SNAPSHOT.jar s3://YOUR-BUCKET-NAME/calculator.jar' // bat 'aws configure set region us-east-1' // bat 'aws s3 cp ./target/calculator-0.0.1-SNAPSHOT.jar s3://YOUR-BUCKET-NAME/calculator.jar' } } } }}
Note: If Jenkins is running on Windows, use bat inside of sh.
If the pipeline’s execution does not indicate any errors, you should soon see the jar archive inside the newly created S3 bucket in your AWS account. Please check the Troubleshooting section at the end of the article if you notice any errors in the console.
(17-s3-upload-done.png)
How to deploy a new application version to AWS EB from Jenkins
Since we will start handling many parameters in the following commands, it is time to clean-up the pipeline code and organize all variables. We will begin to define new environment variables that will store the application-specific configuration. Make sure that the following values match the values you have configured in AWS.
The first step in deploying a new version to EB is to create a new application version, by referencing a new jar artifact from S3 and specifying the application name and the artifact version.
On an Unix-like system you will access environment variables using the notation $VARIABLE_NAME while on a Windows system the notation will be %VARIABLE_NAME%.
Please note that this command will only create a new application version ready for usage in EB, but it will not affect the existing running version.
To deploy a new application version, we need to use the update-environment command. This command will only work if we use a version that has already been created previously. The command options will be similar to the create-application-version command.
        stage('Publish') {
            steps {
                sh './mvnw package'
                // bat '.mvnw package'
            }
            post {
                success {
                    archiveArtifacts 'target/*.jar'
                    sh 'aws configure set region us-east-1'
                    sh 'aws s3 cp ./target/calculator-0.0.1-SNAPSHOT.jar s3://$AWS_S3_BUCKET/$ARTIFACT_NAME'
                    sh 'aws elasticbeanstalk create-application-version --application-name $AWS_EB_APP_NAME --version-label $AWS_EB_APP_VERSION --source-bundle S3Bucket=$AWS_S3_BUCKET,S3Key=$ARTIFACT_NAME'
                    sh 'aws elasticbeanstalk update-environment --application-name $AWS_EB_APP_NAME --environment-name $AWS_EB_ENVIRONMENT --version-label $AWS_EB_APP_VERSION'
                }
            }
        }
If you look inside the AWS console, you should be able to notice the latest version available.
(18-ec-new-version.png)
Troubleshooting tips
Deploying to AWS is a complex topic, and errors sometimes occur, often due to mistakes in the pipeline configuration. Below you will find some ideas on how to troubleshoot some of the most common errors.
How to find errors in the Jenkins console logs
Should the pipeline fail at any stage, it is essential to read the logs for hints on what has failed. You can view the logs by clicking on the build number or clicking on the failed stage.
(19-jenkins-error-logs.png)
Try to identify the error and the command that has generated the respective error.
S3 upload failed – Unable to locate credentials
This error is an indication that the AWS CLI was unable to read the environment variables that contain the credentials needed: AWS_ACCESS_KEY_ID, AWS_SECRET_ACCESS_KEY. Make sure that both variables are defined and correctly spelled.
S3 upload failed – Invalid bucket name “”: Bucket name must match the regex
Take a look at the entire aws s3 cp command in the Jenkins logs. You may notice that the bucket name is empty. This is typically due to a missing or misspelled environment variable.
An error occurred (InvalidParameterCombination) when calling the CreateApplicationVersion operation: Both S3 bucket and key must be specified.
Take a look at the entire aws elasticbeanstalk create-application-version command in the Jenkins logs. You may notice that the S3Bucket or S3Key is empty.
The application endpoint responds with 502 Bad Gateway
This is an indication that the application had some issues starting. It is hard to tell the root cause precisely, but the first place where you can look for hints is in the application logs. To get them, go to the respective environment and select the menu item called Logs.
(20-ec-app-logs.png)
From the list with Request Logs, get the last 100 entries. Once the logs are available, click on Download.
‘aws’ is not recognized as an internal or external command error in Jenkins
This is an error indicating that the aws command could not be found by Windows. The first step is to restart the computer and in many cases this will solve the problem.
Conclusion and next steps
We now have the foundation for a simple but fully working CI/CD pipeline. While we are building, testing, and deploying a Java application to AWS, this solution is not production-ready.
The CI pipeline may include additional code review, code quality, test or security stages to ensure the artifact fulfills all requirements before attempting a deployment.
For the CD pipeline, you may also want to include additional environments and tests to ensure that a deployment to the production environment will work without any issues.
AWS Lambda enables you to run serverless functions in the AWS cloud, by manually triggering functions or by creating trigger events. To ensure your Lambda functions are running smoothly, you can monitor metrics that measure performance, invocations, and concurrencies. However, even if you continuously monitor, once in a while you are going to run into what’s termed a Lamba cold start. There are various ways to prevent AWS Lambda cold starts. This article explains how to achieve this with log data.
AWS Lambda Performance Monitoring
Monitoring your functions is necessary to verify that functions are being called correctly, that you are allocating the right amount of resources, and to locate bottlenecks or errors. In particular, you should monitor how Lambda interacts with other services, including calls and request times.
Fortunately, Lambda exposes metrics that you can access through the CloudWatch console or ingest with third-party log management tools like Coralogix. These metrics include:
Invocation—includes invocations, function errors, delivery failures, and throttles. You can use these metrics to gauge the rate of issues during runtime and determine possible causes for poor performance.
Performance—includes duration and iterator age. You can use these metrics to better understand the performance of single invocations, average performance, or maximum performance.
Concurrency—includes concurrent executions on both provisioned and unreserved resources. You can use these metrics to determine the necessary capacity of simultaneous invocations and to measure whether you are efficiently provisioning resources.
What Is an AWS Lambda Cold Start?
A Lambda cold start occurs when a new container instance needs to be created for a function to run. Cold starts can happen if it’s the first time running the function, because the function hasn’t run recently, or because the function’s execution places a demand that exceeds the current available capacity of existing instances.
During a Lambda cold start, the function package is loaded into a container, the appropriate configurations are made, and the container is deployed. This process generally takes anywhere from 400 milliseconds to a few seconds, depending on your function language, memory allocation, and code size.
Once you have a function instance, AWS retains it for an indefinite amount of time. If you call the function again, it is already available and can run instantly, eliminating cold starts for that invocation. However, if you exceed the amount of time AWS allows between invocations, your function instance is eliminated. When this happens, AWS must initialize a new instance before your function can run, resulting in a cold start.
3 Ways to Prevent Lambda Cold Starts Using Log Data
When using Lambda, you’re paying for computing time of every second that your function is initializing and running. This means that every time a cold start occurs, you will get charged for that non-productive initialization time. This isn’t a big deal if you’re only occasionally running functions but once you run a function a few million times, this cost quickly adds up.
To ensure that your costs stay low and your performance stays high, you should try to minimize cold starts as much as possible. The following tips provide a fundamental basis for achieving this. Once you’ve implemented these tips, you can move on to more advanced Lambda cold starts optimization methods.
1. Instrumenting Your Lambda Functions and Measuring Performance
To measure your performance you need to deploy and invoke functions in the conditions you want to measure. You can then analyze your metrics to determine performance. This requires invoking your function multiple times, under many conditions, and aggregating the resulting data. The easiest way to do this is through instrumentation.
Two instrumentation tools you should consider are Gatling and AWS X-Ray. Gatling enables you to repeatedly invoke your function and view the resulting metrics in a report with accompanying visualizations. You can also use it to view raw results.
X-Ray enables you to examine end-to-end request traces via the AWS Console. This data includes HTTP calls and AWS stack calls. X-Ray also provides a visualization of your initialization time and a map of your serverless application components that you can use to narrow down bottlenecks.
With the data collected from your instrumentation, you can identify how efficiently your functions are operating and make changes to increase performance. In particular, these metrics can help you identify when your applications are initiating cold starts, providing an accurate baseline for function provisioning requirements.
2. Using CloudWatch Events to Reduce Frequency of Cold Starts
Outside of provisioning function instances, your best bet for reducing cold starts is to try to keep your functions warm. You can do this by periodically invoking the function and sending a request to a small handler function that contains warming logic.
The best way to do this is with CloudWatch Events. You can use this service, in combination with a Cron job to ping functions every 5-15 minutes. However, this method only works for one function instance.
If you need to keep concurrent instances warm, you need to adopt other tooling and use it to interface with CloudWatch Events. One option to consider is Lambda Warmer, a module for Node.js that enables you to warm multiple functions and define custom concurrency levels. It also integrates with the Serverless Framework and AWS SAM.
3. Keep Shared Data in Memory by Loading Outside the Main Event Handler Function
An additional strategy you can employ is to use log data to identify functions that are loading dependencies at invocation. When you have to load dependencies for each invocation, runtime increases. However, you can store these dependencies in your warm function container outside of your handler logic. Any code that is executed outside of the handler will persist in container storage.
Using your log data as a guide, you can modify function packages to use this method. This eliminates the need to import dependencies with each invocation, speeding runtime. Making this change can significantly boost your function performance when used in combination with the above method for warming. Although this strategy does not affect cold starts it does enable you to boost overall performance.
Conclusion
To avoid cold starts, you can instrument your Lambda functions and measure performance. You can also use CloudWatch events to reduce the frequency of cold starts. Finally, you can keep shared data in memory, by loading outside the main event handler function. This serves to lower costs and improve efficiency, creating a more scalable and robust system.
Amazon ELB (Elastic Load Balancing) allows you to make your applications highly available by using health checks and intelligently distributing traffic across a number of instances. It distributes incoming application traffic across multiple targets, such as Amazon EC2 instances, containers, IP addresses, and Lambda functions. You might have heard the terms, CLB, ALB, and NLB. All of them are types of load balancers under the ELB umbrella.
Types of Load Balancers
CLB: Classic Load Balancer is the previous generation of EC2 load balancer
ALB: Application Load Balancer is designed for web applications
NLB: Network Load Balancer operates at the network layer
This article will focus on ELB logs, you can get more in-depth information about ELB itself in this post
ELB Logs
Elastic Load Balancing provides access logs that capture detailed information about requests sent to your load balancer. Each ELB log contains information such as the time the request was received, the client’s IP address, latencies, request paths, and server responses.
ELB logs structure
Because of the evolution of ELB, documentation can be a bit confusing. Not surprisingly, there are three variations of the AWS ALB access logs; ALB, NLB, and CLB. We need to rely on the document header to understand which of the variant logs it describes (the URL and body will usually reference ELB generically).
How to collect ELB logs
The ELB access logging monitoring capability is integrated with Coralogix. The logs can be easily collected and sent straight to the Coralogix log management solution.
ALB Log Example
This is an example of a parsed ALB HTTP entry log:
Note that if you compare this log to the AWS log syntax table, we split the client address and port and target address and port into four different fields to make it easier.
ELB logs contain unstructured data. Using Coralogix parsing rules, you can easily transform the unstructured ELB logs into JSON format to get the full power of Coralogix and the Elastic stack working for you. Parsing rules use RegEx and I created the expressions for NLB, ALB-1,ALB-2, and CLB logs. The two ALB regexes cover “normal” ALB logs and the special cases of WAF, Lambda, or failed or partially fulfilled requests. In this cases AWS assigns the value ‘-‘ to the target_addr field with no port. You will see some time measurements assigned the value -1. Make sure you take it into account in your visualizations filters. Otherwise averages and other aggregations could be skewed. Amazon may add fields and change the log structure from time to time, so always check these against your own logs and make changes if needed. The examples should provide a solid foundation.
The following section requires some familiarity with regular expressions but just skip directly to the examples if you prefer.
A bit about why the regexes were created the way they were. Naturally, we always want to use a regex that is simple and efficient. At the same time, we should make sure that each rule captures the correct logs in the correct way (correct values matched with the correct fields). Think about a regex that starts with the following expression:
^(?P<timestamp>[^s]+)s*
It will work as long as the first field in the unstructured log is a timestamp, like in the case of CLB logs. However, in the case of NLB and ALB logs, the expression will capture the “type” field instead. Since the regex and rule have no context, it will just place the wrong value in the wrong JSON key. There are other differences that can cause problems like different numbers of fields or field order. To avoid this problem, we use the fact that NLB logs always start with ‘tls 1.0’ standing for the fields ’type’ and ‘version’, and that ALB logs start with a ‘type’ field with 6 optional values (http, https, h2, ws, wss).
Note: As explained in the Coralogix rule tutorial, rules are organized by groups and executed by the order they appear within the group. When a rule matches a log, the log will move to the next group without processing the remaining rules within the same group.
Taking all this into account, we should:
Create a rule group called ‘Parse ELB’
Put the ALB and NLB rules first (these are the rules that look for the specific beginning of the respective logs) in the group
This approach will guarantee that each rule matches with the correct log.Now we are ready for the main part of this post.
In the following examples, we’ll describe how different ELB log fields can be used to indicate operational status. In the examples, we assume that the logs were parsed into JSON format. The examples will rely on the Coralogix alerts engine and on Kibana visualizations. They also provide additional insights into the different keys and values within the logs. Like always, we give you ideas and guidance on how to get more value out of your logs. However, every business environment is different and you are encouraged to take these ideas and build on top of them based on the best implementation for your infrastructure and goals. Last but not least, Elastic Load Balancing logs requests on a best-effort basis. The logs should be used to understand the nature of the requests, not as a complete accounting of all requests. In some cases, we will use ‘notify immediately’ alerts, but you should use ELB as a backup and not as the main vehicle for these types of alerts.
Tip: To learn the details of how to create Coralogix alerts you can read this guide.
Alerts
Increase in ELB WAF errors
This alert identifies if a specific ELB generates 403 errors more than usual. A 403 error results from a request that is blocked by AWS WAF, Web Application Firewall. The alert uses the ‘more than usual’ option. With this option, Coraloix’s ML algorithms will identify normal behavior for every time period. It will trigger an alert if the number of errors is more than normal and is above the optional threshold supplied by the user.
Alert Filter:
elb:”app/my-loadbalancer/50dc6c495c0c9188” AND elb_status_code:”403”
Alert Condition: ‘More than usual’. The field elb_status_code can be found across ALB, CLB logs.
Outbound Traffic from a Restricted Address
In this example, we use the client field. It contains the IP of the requesting client. The alert will trigger if a request is coming from a restricted address. For the purpose of this example, we assume that permitted addresses are all under the subnet 172.xxx.xxx.xxx.
Note: Client_addr is found across NLB, ALB, and CLB.
Alert Condition:‘Notify immediately’.
ELB Down
This alert identifies an inactive ELB. It uses the ‘less than’ alert condition. The threshold is set to no logs in 5 minutes. This should be adapted to your specific environment.
Alert Filter:
elb:”app/my-loadbalancer/50dc6c495c0c9188”
Alert Condition: ‘less than 1 in 5 minutes’’
This alert works across NLB, ALB, and CLB.
Long Connection Time
Knowing the type of transactions running on a specific ELB, ops would like to be alerted if connection times are unusually long. Here again, the Coralogix ‘more than usual” alert option will be very handy.
Alert Filter:
connection_time:[2 TO *]
Note: Connectiion_time is specific to NLB logs. You can create similar alerts on any of the time-related fields in any of the logs.
Alert Condition: ‘more than usual’
A Surge in ‘no rule’ Requests
The field ‘matched_rule_priority’ indicates the priority value of the rule that matched the request. The value 0 indicates that no rule was applied and the load balancer resorted to the default. Applying rules to requests is specifically important in highly regulated or secured environments. For such environments, it will be important to identify rule patterns and abnormal behavior. Coralogix has powerful ML algorithms focused on identifying deviation from a normal flow of logs. This alert will notify users if the number of requests not matched with a rule is more than the usual number.
Alert Filter:
matched_rule_priority:0
Note: This is an ALB field.
Alert Condition: ‘more than usual’
No Authentication
In this example, we assume a regulated environment. One of the requirements is that for every ELB request the load balancer should validate the session, authenticate the user, and add the user information to the request header, as specified by the rule configuration. This sequence of actions will be indicated by having the value ‘authenticate’ in the ‘actions_executed’ field. The field can include a few actions separated by ‘,’. Though ELB doesn’t guarantee that every request will be recorded, it is important to be notified of the existence of such a problem, so we will use the ‘notify immediately’ condition.
Alert Filter:
NOT actions_executed:authenticate
Note: This is an ALB field.
Alert Condition: ‘notify immediately’
Visualizations
Traffic Type Distribution
Using the ‘type’ field this visualization shows the distribution of the different requests and connection types.
Bytes Sent
Summation of the number of bytes sent.
Average Request/Response Processing Time
Request processing time is the total time elapsed from the time the load balancer received the request until the time it sent it to a target. Response processing time is the total time elapsed from the time the load balancer received the response header from the target until it started to send the response to the client. In this visualization, we are using Timelion to track the average over time and generate a trend line.
Timelion expression:
.es(q=*,metric=avg:destination.request_processing_time.numeric).label("Avg request processing time").lines(width=3).color(green), .es(q=*,metric=avg:destination.request_processing_time.numeric).trend().lines(width=3).color(green).label("Avg request processing time trend"),.es(q=*,metric=avg:destination.response_processing_time.numeric).label("Avg response processing Time").lines(width=3).color(red), .es(q=*,metric=avg:destination.response_processing_time.numeric).trend().lines(width=3).color(red).label("Avg response processing time trend")
Average Response Processing Time by ELB
In this visualization, we show the average response processing time by ELB. We used the horizontal option. See the definition screens.
Top Client Requesters for a specific ELB
This table lists the top IP addresses generating requests to specific ELB’s. The ELB’s are separated by the metadata applicationName. This metadata field is assigned to the load balancer when you configure the integration. We created a Kibana filter that looks only at these two devices. You can read about filtering and querying in our tutorial.
ELB Status Codes
This is an example showing the status code distribution for the last 24 hours.
You can also create a more dynamic representation showing how the distribution behaves over time.
This blog post covered the different types of services that AWS provides under the ELB umbrella, NLB, ALB, and CLB. We focused on the logs these services generate and their structure, and showed some examples of alerts and visualizations that can help you unlock the value of these logs. Remember that every user is unique and has its own use case and data. Your logs might be customized and configured differently and you will most likely have your own requirements. So, you are encouraged to take the methods and concepts showed here and adapt them to your own needs. If you need help or have any questions, don’t hesitate and reach out to [email protected]. You can learn more about unlocking the value embedded in AWS ALB logs and other logs in some of our other blog posts.
Be Our Partner
Complete this form to speak with one of our partner managers.
Thank You
Someone from our team will reach out shortly. Talk to you soon!
 The new standard of observability is here. Discover Olly, the industry’s first