Cloudwatch is the de facto method of consuming logs and metrics from your AWS infrastructure. The problem is, it is not the de facto method of capturing metrics for your applications. This creates two places where observability is stored, and can make it difficult to understand the true state of your system.
That’s why it has become common to unify all data into one place, and Prometheus offers an open-source, vendor-agnostic solution to that problem. But we need some way of integrating Cloudwatch and Prometheus together.
Why is one Observability source better than two?
Tool Sprawl is a real issue in the DevOps world. If your infrastructure metrics are held in one silo, and your application metrics are held elsewhere, what is the best way of correlating the two measurements? The truth is, it’s challenging to truly aggregate across multiple data sources. This is why, at Coralogix, we strongly advise that you aim for a single location to hold your telemetry data.
Fortunately, with Prometheus and Cloudwatch, there is the perfect tool in existence.
The Prometheus Cloudwatch Exporter
To ingest Cloudwatch metrics into Prometheus, you will need to use a tool called the Prometheus Cloudwatch Exporter. This tool is a Prometheus exporter that runs on Amazon Linux, and it allows you to scrape metrics from Cloudwatch and make them available to Prometheus.
This tool acts as the bridge between Cloudwatch and Prometheus. It will unify all your application and infrastructure metrics into a single repository, which can be correlated and analyzed.
Prerequisites
You’ll need a running Amazon EC2 instance. This can be part of a Kubernetes cluster, but we’re keeping things simple for this tutorial.
Once your EC2 instance is running, you will need to install the Prometheus Cloudwatch Exporter. You can do this by running the following command from the terminal:
After downloading the Prometheus Cloudwatch Exporter, you will need to unpack the binary and make it executable. You can do this by running the following commands:
tar -xf cloudwatch_exporter-*.tar.gzcd cloudwatch_exporter-*chmod +x cloudwatch_exporter
Once the Prometheus Cloudwatch Exporter is installed, you will need to configure it to scrape your Cloudwatch metrics. You can create a new configuration file and specify the metrics you want to scrape. Here is an example configuration file:
After you have created your configuration file, you can start the Prometheus Cloudwatch Exporter by running the following command:
./cloudwatch_exporter -config.file=config.yml
Finally, you will need to configure Prometheus to scrape the metrics from the Prometheus Cloudwatch Exporter. You can do this by adding the following configuration to your Prometheus configuration file:
Once you have completed these steps, Prometheus should start scraping metrics from Cloudwatch and making them available for you to query.
Does this sound like a lot of work?
It is – managing all of your own observability data can be painful. Rather than do it all yourself, why not check out the Coralogix documentation, which shows various options for integrating Coralogix and Cloudwatch. With massive scalability, a uniquely powerful architecture, and some of the most sophisticated observability features on the market, Coralogix can meet and beat your demands!
Quality control and observability of your platform are critical for any customer-facing application. Businesses need to understand their user’s experience in every step of the app or webpage. User engagement can often depend on how well your platform functions, and responding quickly to problems can make a big difference in your application’s success.
AWS monitoring tools can help companies simulate and understand the user experience. It will help alert businesses to issues before they become problems for customers.
The Functionality of AWS Canaries
AWS Canaries are an instantiation of Amazon’s CloudWatch Synthetics. They are configurable scripts that automatically execute to monitor endpoints and APIs. They will follow the flow and perform the actions as real users. The results from the Canary mimic what a real user would see at any given time, allowing teams to validate their customer’s experience.
Tracked metrics using AWS Canaries include availability and latency of your platform’s endpoints and APIs, load time data, and user interface screenshots. They can also monitor linked URLs and website content. AWS Canaries can also check for changes to your endpoint resulting from authorized code changes, phishing, and DDoS attacks.
How AWS Canaries Work
AWS Canaries are scripts that monitor your endpoints and APIs. The scripts follow the same flows that real customers would follow to hit your endpoints. Developers can write Canary scripts using either Node.js or Python, and the scripts run on a headless Google Chrome Browser using Puppeteer for Node.js scripts or Selenium for Python scripts. Canaries run scripts against your platform and log results in one of AWS’s observability tools, such as CloudWatch or XRay. From here, developers can export the data to other tools like Coralogix’s metrics platform for analysis.
AWS Canaries and Observability
AWS Canaries and X-Ray
Developers can set AWS Canaries to use X-Ray for specific runtimes. When X-Ray is enabled, traces indicate latency requests, and the Canaries send failures to X-Ray. These data are explicitly grouped for canary calls, making separating actual calls from AWS Canary calls against your endpoints easier.
Enabling traces can increase the canary’s runtime by up to 7%. Also, set IAM permissions that allow the canary to write to X-Ray.
AWS Canaries and EventBridge
AWS EventBridge can notify various AWS Canary events, including status changes or complete runs. AWS does not guarantee delivery of all Canary events to EventBridge, instead of sending on a best effort basis. Cases where data does not arrive in EventBridge, are expected to be rare.
Canary events can trigger different EventBridge rules and, therefore, different subsequent functions or data transfers to third-party analytics tools. Functions can be written that allow teams to troubleshoot when a canary fails, investigate error states, or monitor workflows.
AWS Canaries and CloudWatch Metrics
AWS Canaries will automatically create Cloudwatch metrics. Metrics published include the percentage of entirely successful and failed canary runs, duration of canary tuns, and the number of responses in the 200, 400, and 500 ranges.
Metrics can be viewed on the CloudWatch Metrics page. They will be present under the CloudWatchSynthetics namespace.
AWS Canaries and Third-Party Analytics
Since AWS Canaries automatically write CloudWatch metrics, metrics streams can be used to deliver data to third-party tools like Coralogix’s scaling metrics platform. CloudWatch metrics streams allow users to send only specific namespaces or all namespaces to third parties. After the stream is created, new metrics will be sent automatically to the third party without limit. AWS does charge based on the number of metrics updates sent.
Creating a Canary
When creating a Canary, developers choose whether to use an AWS-provided blueprint, the inline editor, or import a script from S3. Blueprints provide a simple way to get started with this tool. Developers can create Canaries using several tools such as the Serverless framework, the AWS CLI, or the AWS console. Here we will focus on creating a Canary using a Blueprint with the AWS console.
Create a Canary from the AWS Console
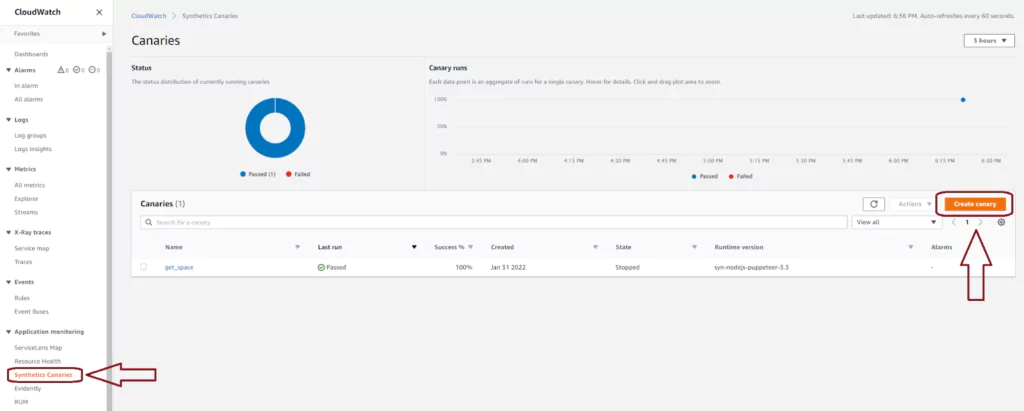
Navigate to the AWS CloudWatch console. You will find Synthetics Canaries in the right-hand menu under the Application monitoring section. This page loads to show you any existing Canaries you have. You can see, at a glance, how many of the most recent runs have passed or failed across all your canaries. You can also select Create canary from this page to make a new AWS Canary and test one of your endpoints.
Use a Blueprint to create a Canary quickly
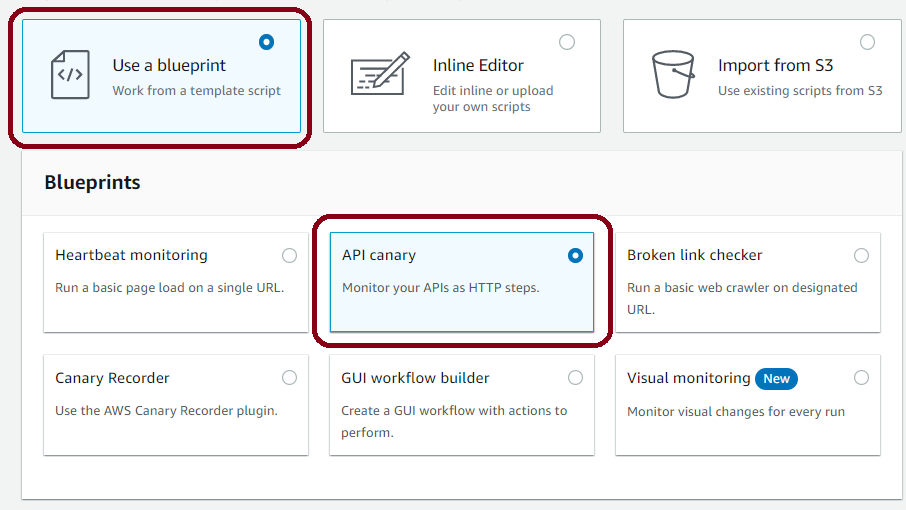
In the first section, you select how to create your new Canary. Here we will choose to use an AWS blueprint, but the inline editor and importing from S3 are also options. There are six blueprints currently available. Each is designed to get developers started on a different common problem. We will use the API canary, which will attempt to call the AWS-deployed API periodically. This option is useful when you want to test an API you own in AWS API Gateway or some other hosted service.
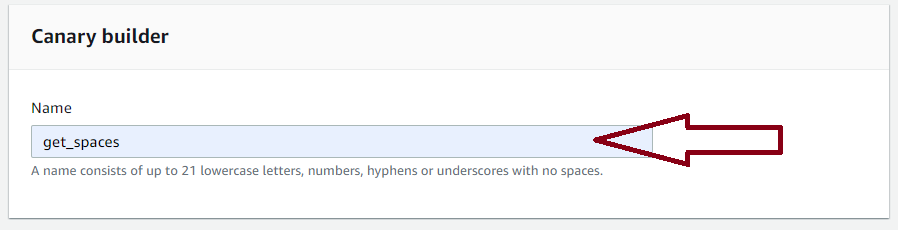
Name your Canary
Next, choose a name for your canary. It does not need to match the name of the API, but this will make it easier to analyze the results if you are testing a large number of endpoints.
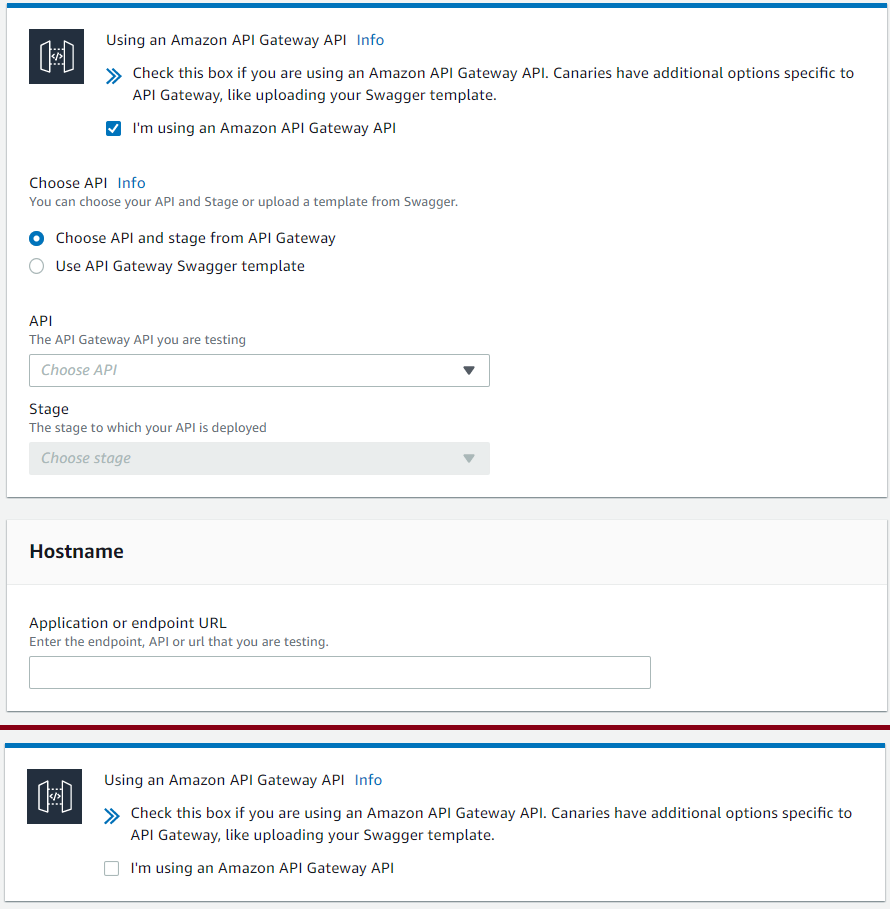
Link your Canary to an AWS API Gateway
Next, AWS gives the option to load data directly from API Gateway. If you select the checkbox, the page expands, allowing you to choose your API Gateway, stage, and Hostname. Options are loaded from what is deployed in the same AWS environment. Developers are not required to select an AWS API Gateway and can still test other endpoints with the Canaries; the information is simply loaded manually.
Setup your HTTP request
Next, add an HTTP request to your canary. If you have loaded from AWS API Gateway, a dropdown list is provided with resources attached to the endpoint. Choose the resource, method, and add any query strings or headers. If there is any authorization for your endpoint, it should be added here.
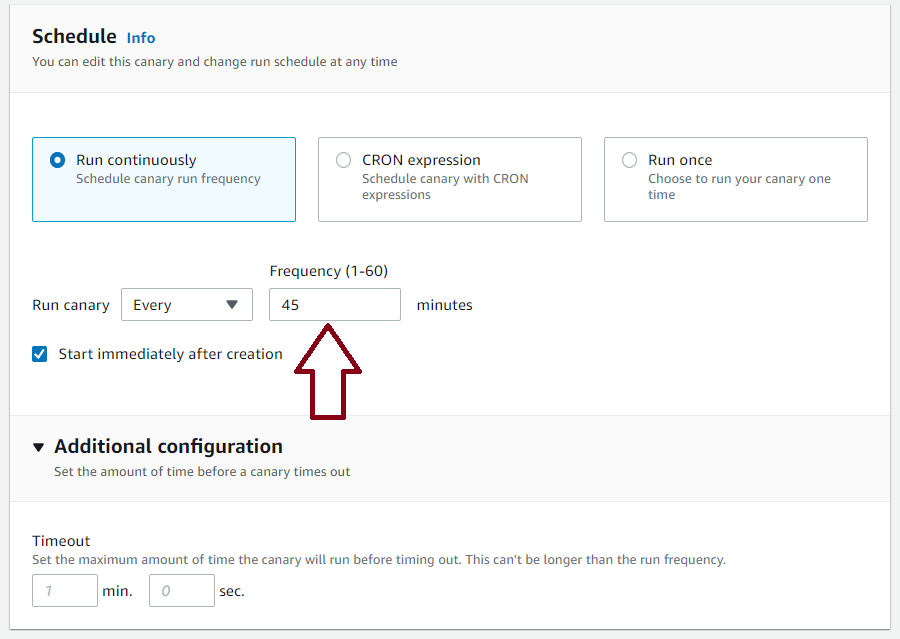
Schedule your Canary
After the HTTP setup is complete, choose the schedule for the AWS Canary. It determines how often the Canary function will hit your endpoint. You can choose between running periodically indefinitely, using a custom CRON expression, or just running the canary once. When selecting this, remember that this is adding traffic to your endpoint. This could incur costs depending on your setup.
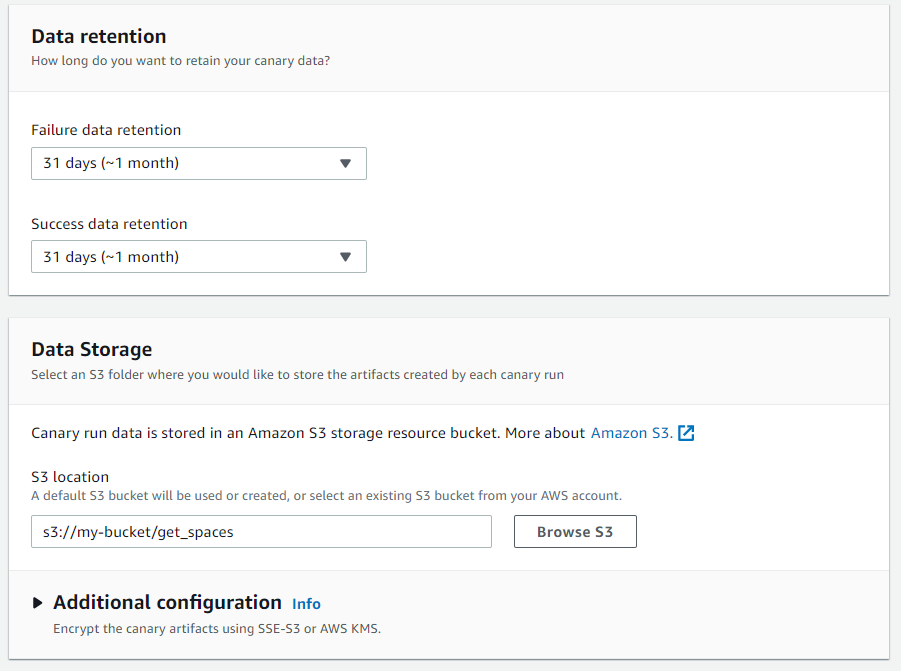
Configure log retention in AWS S3
AWS next allows developers to configure where Canary event logs are stored. They will automatically be placed into S3. From the console, developers can choose which S3 bucket should store the data and how long it should be kept. Developers can also choose to encrypt data in the S3 bucket. For exporting data to third-party tools, developers can set up a stream on the S3 bucket. This can trigger a third-party tool directly, send data via AWS Kinesis, or trigger AWS EventBridge to filter the data before sending it for analysis.
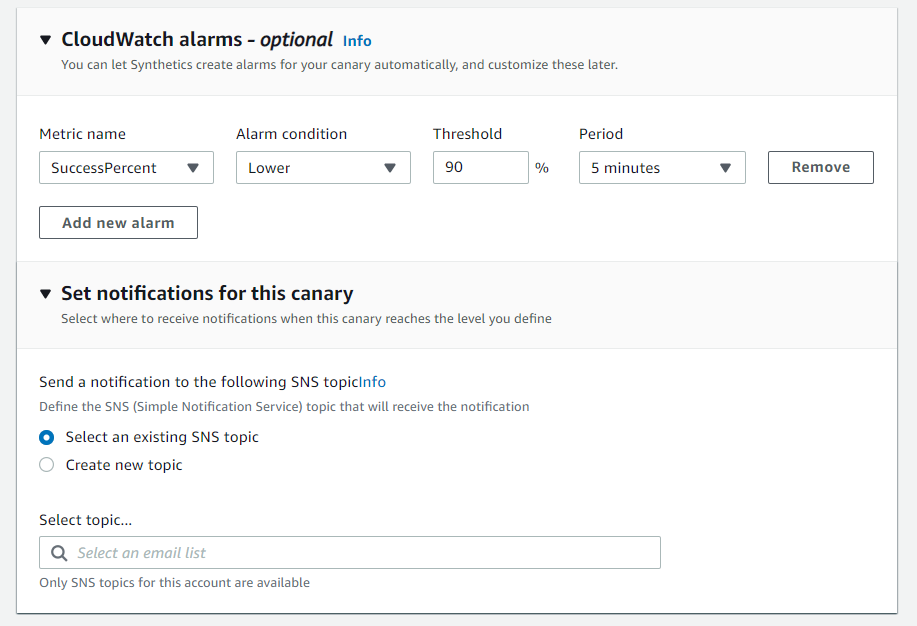
Setup an alarm
Developers can choose to set up a CloudWatch alarm on the Canary results. This is especially useful in production environments to ensure your endpoints are healthy and limit outages. The same results may also be obtained through third-party tools that enable machine learning not only to see when your endpoint has crossed a pre-set threshold but can also detect irregular or insecure events.
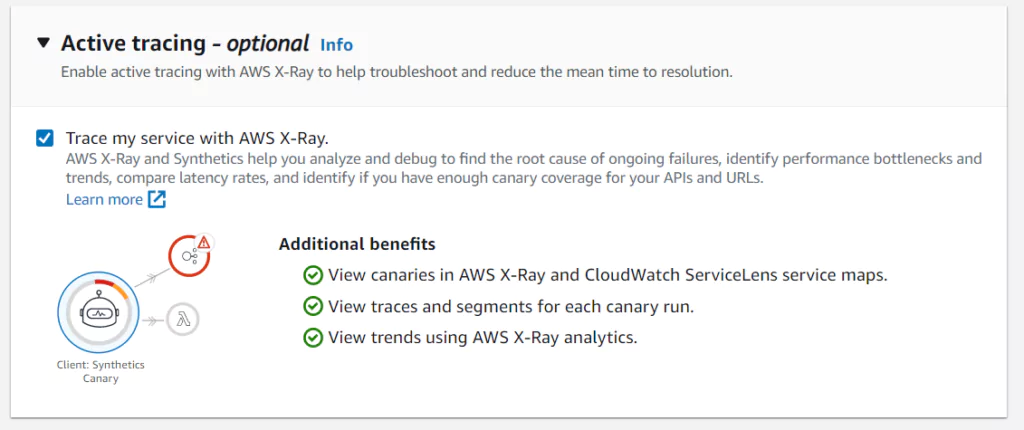
Enable AWS XRay
Developers can choose to send results of Canaries to AWS XRay. To send this data, check the box in the last section of the console screen. Enabling XRay will incur costs on your AWS account. It will also allow you another mode of observing your metrics and another path to third-party tools that can help analyze the health of your platform.
Summary
Canaries are an observability tool in AWS. Canaries give a method of analyzing API Endpoint behavior by periodically testing them and recording the results. Measured values include ensuring the endpoints are available, that returned data is expected, and that the delay in the response is within required limits.
AWS Canaries can log results to several AWS tools, including AWS Cloudwatch, AWS XRay, and AWS EventBridge. Developers can also send Canary results to third-party tools like the Coralogix platform to enable further analysis and alert DevOps teams when there are problems.
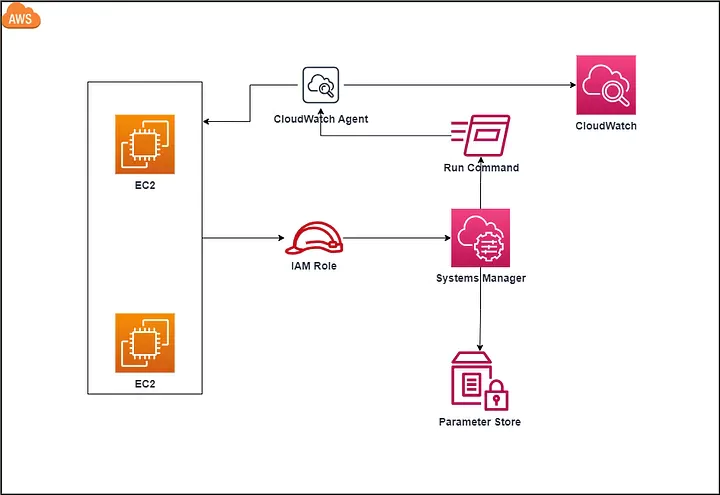
AWS Systems Manager and CloudWatch Agent provide an integrated approach to observability and managing your AWS infrastructure efficiently. In this tutorial, I will show you how to use Systems Manager’s Quick Setup to install CloudWatch Agent on your EC2 Instances.
What is AWS Systems Manager?
AWS Systems Manager is an operations hub for your AWS resources that allows you to group, view, and act on resources within your AWS environment.
With Systems Manager, you can execute commands on your EC2 instances without logging into each instance separately, and ensure that your instances remain in a desired state by applying patches, updates, and configuration changes automatically. You can store and manage configuration data and secrets, such as database passwords or API keys, and have a centralized location to view, investigate, and resolve operational issues related to AWS resources.
Note that some features contained within AWS Systems Manager may incur additional costs. Make sure you check the costs tied to your use case before getting started.
Why you need to set up AWS CloudWatch Agent with AWS Systems Manager
While you can SSH into an EC2 instance and set up the AWS CloudWatch Logs Agent via the command line, it isn’t exactly a scalable process. Repeating those manual steps for dozens of servers takes a great deal of time and is prone to human error. This is where AWS Systems Manager comes into play:
Installing the CloudWatch Agent via AWS Systems Manager reduces the effort significantly and ensures that all your machines are controlled from a top-down approach rather than an error-prone bottom-up approach.
You will be able to securely connect to a managed EC2 instance without worrying about SSH key management and/or opening ports on your firewalls/security groups. You will also see CloudWatch metrics along with any alarms you have configured via AWS CloudWatch. This will happen automatically, without having to configure each instance with the specific metrics that you want to collect!
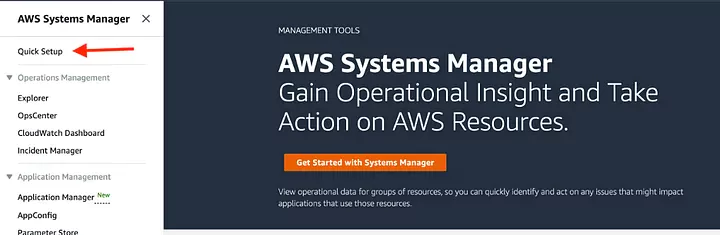
How To Install AWS CloudWatch Agent Using AWS Systems Manager Quick Setup
If you aren’t already using Systems Manager, you can use the Quick Setup feature:
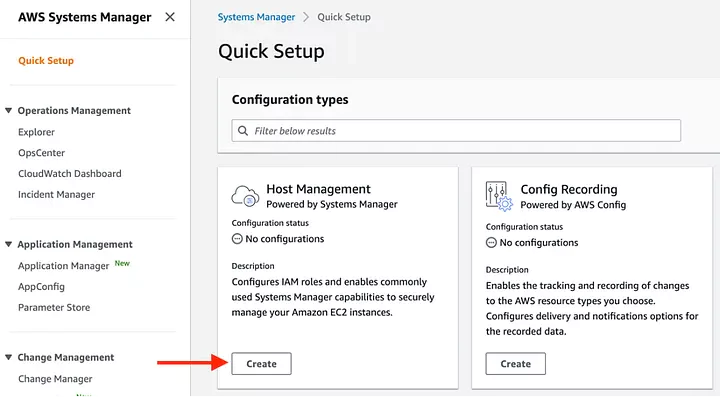
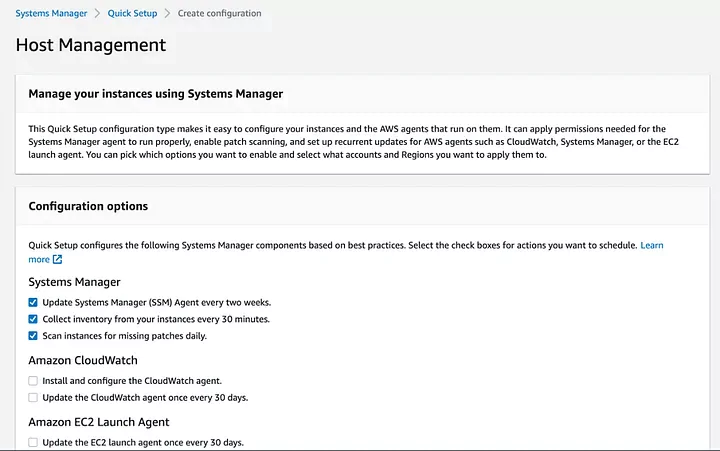
Select host management configuration type
Select option to install AWS CloudWatch Agent
In the next screen, check the boxes under the Amazon CloudWatch section and click continue.
Select a target instance
This screen will allow you to choose the instances on which you want to install AWS Systems Manager Agent and CloudWatch Agent. Start with a single instance to test your configuration and add more once you feel comfortable.
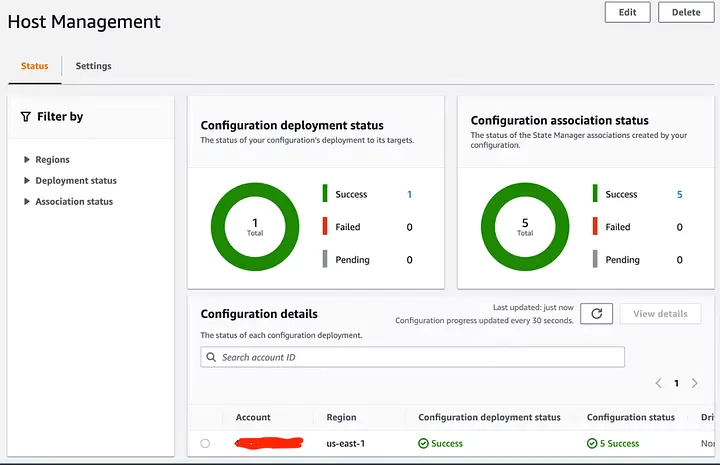
All done!
Once you’ve successfully run through the setup process, you should be able to access your dashboard.
You should start to see metrics being collected via the CloudWatch Agent that is now installed on your instance(s). Out of the box, this process will collect a basic set of metrics and you will need to edit the CloudWatch Agent Configuration file if you want to customize these.
Wrapping Up
You now know how to install AWS CloudWatch Agent consistently across your infrastructure! This is an important step to boost your observability data and become proactive in managing your systems.
Systems Manager boasts a lot of other useful features, such as Patch Manager to automatically patch your managed instances with security updates, or Automation to streamline repetitive tasks. Make sure you explore these features to enhance your infrastructure management on AWS.
Lambda is a top-rated compute service available on the AWS cloud service network. Its popularity largely derives from its ease of use, allowing users to run Lambda functions reliably without provisioning or managing servers. Lambda can be triggered manually or by any linked events in the AWS network, including DynamoDB streams, SQS, Kinesis, and more.
To use Lambda in a production setting, you must consider more than just the development time you save using Lambda. Developers and DevOps professionals need to watch functions for code errors and potential infrastructure optimizations. These settings include memory, duration, concurrency. As well, tracking error rates and causes, throttles from the AWS platform, and AWS delivery failures will contribute to the overall health of your system.
Having clear and easily-analyzed metrics, logs, and traces are keys to a well-observed architecture. AWS provides some observability capabilities for Lambda with AWS CloudWatch. Lambda Extensions provides various partner programs that enhance your Lambda observability.
Lambda Observability using CloudWatch
CloudWatch has several internal tools helpful in observing the health of your Lambda functions. These include viewing and searching logs, configuring and using metrics, setting alarms, and configuring rules to trigger other events.
CloudWatch features have grown significantly over the last several years enabling developers to have more insight into their Lambda functions. Some enterprises also want to augment the capabilities of CloudWatch using third-party tools that have different features than those provided by AWS. Coralogix’s log analytics tool can automatically detect unusual behavior in functions and alert you of the need for intervention. Developers can use AWS and third-party Lambda observability tools together, or they may choose to use one or the other.
Turning Off CloudWatch in Lambda
CloudWatch is the defacto observability tool for Lambda. It is automatically linked to Lambda no matter what method you use to deploy your function. You generally need to turn it off actively if you do not want to use it. If you use the Serverless Framework, the deployment process will automatically add log policies and groups for each Lambda function in the service. Users suggest declining permissions for CloudWatch in the IAM roles section to remove logging events, as shown below.
Lambda Extensions is used to plug your Lambda function into supporting tools. AWS partners like Coralogix may provide tools, or you may write your own. You would choose to utilize an Extension instead of in-line functionality when users want to send telemetry data to another vendor or when users need to collect and use data over a long period or across concurrent Lambdas.
Lambda Extension Use Cases
Lambdas are short-lived, stateless functions, making it challenging to observe valuable data. Lambda Extensions provide more ways to integrate with and monitor your Lambda functions and your execution environment.
Since Extensions initialize before your Lambda function is invoked and shut down after your Lambda function is complete, you will be able to capture metrics during all phases of your Lambda’s lifecycle. Available metrics include previously-hidden data before and after function invocations.
Lambda’s being stateless can sometimes mean maintaining databases simply to hold state. You can use Lambda Extension to store configurations and settings and reduce the need for extra infrastructure.
Extensions can also be used to log and alert you on security issues that may arise during a Lambda’s execution. You can add up to ten Extensions per Lambda function using up to five Lambda layers or a container image.
Available Extensions for Lambda Observability
Extensions built by third-party teams can be found in the AWS Serverless Application Repository. These include simple examples to help you test out using Extensions and Extensions that enhance Lambda Observability. This repository does include applications that are not used for Extensions, so be aware of your chosen application’s use.
Third-party teams like Coralogix have provided Lambda Extensions that connect your function’s logs with their machine learning tools. The Lambda Extension allows you to send log and metric data directly to analytics platforms. If all the analytics are done in a third-party tool, you may turn off CloudWatch to reduce the cost incurred running the Lambda. Previous to Lambda Extensions, log and metric data had to be sent using CloudWatch, but now that service can be bypassed.
Once Lambda log and metric data are in the Coralogix platform, our service can provide insights into the health and maintenance of your AWS Infrastructure. Our AWS Obervability solution can collect data from across your AWS account, using it to detect and provide alerts on anomalous activity. Its Log Analytics platform can provide insights specific to your Lambda function’s behavior to ensure it is working as expected.
How to Add Extensions
Lambda Extensions can be added no matter how you build your Lambdas. When using Lambda container images, you build the Extension image using Docker’s CLI or AWS SAM with a Dockerfile. When using deployment methods such as Serverless Framework or Terraform, you use the same methods of deploying Lambda Layers to deploy Lambda Extensions. Environment variables need to be added here to invoke Extension capabilities. Instructions on how to add Extensions built by third-party teams like Coralogix are readily available.
Internal and External Extensions
Lambda Extensions come in two flavors: internal and external. External Extensions run independently of the Lambda execution environment and are not limited by Lambda’s runtime or coding language. Internal Extensions use the same runtime process as the Lambda and use wrapper scripts or other in-process tools that depend on your chosen language.
Internal Extensions allow you to modify the runtime process. You can use them to add parameters to the runtime and collect metrics otherwise not available. They can also be used to pre-load functionality without modifying your actual Lambda function. This feature is useful when you have many Lambdas or Lambda services that should use the same startup routines. Internal Extensions may be run using environment variables dependent on the used language or run using wrapper scripts.
External Extensions run as a separate process from your Lambda. They can start before Lamba’s runtime and continue after the Lambda runtime completes. They can also be triggered to run before the container running the Lambda stops to provide metrics.
Performance and Execution of Lambda Extensions
Lambdas use a secure and isolated execution environment. Lambda Extensions run in the same environment as your Lambda function. They are extracted from a Lambda layer during the init phase of execution, and the Lambda will start all attached Extensions in parallel.
The Extensions must be initialized completely before your Lambda function can be invoked. Ensuring a fast initialization time for your Extension is critical; otherwise, you may add latency to your Lambda functions and slow down regular processing times.
The size of the Extension will count towards the total Lambda deployment package size. The Extension will also share memory, CPU, and storage with your Lambda. Offloading intensive computations to an Extension can increase your function’s duration and memory usage, and allocating more memory to a function can increase the function’s throughput.
Cost
AWS charges users for any Lambda execution time consumed by the extension. The cost is broken down in one millisecond increments just as regular Lambda runtimes. There is no charge for the installation of your Extensions to Lambda.
Note that the cost of running Lambdas does increase per unit time as you increase the memory allocation. While increasing memory may be required to improve the speed of calculations, cost should be considered in this infrastructure design. You need to optimize memory allocation throughout time and cost based on these settings and the needs of the Lambda function.
Security
Lambda extensions share resources with the Lambda function. Resources such as memory allocation, CPU, and environment variables are shared. This includes sharing IAM roles, meaning that the Lambda extension has access to everything your Lambda function does. Keeping with AWS’s recommended security principles of allowing access to only required infrastructure is critical to securing your Lambda function and its associated extensions. Further, if the extension needs access to some AWS service, it should be included in the IAM roles of the Lambda, even if that access is only needed for the extension.
Summary
Lambda Extensions is a new, fully available service used to plug in extra functionality to Lambda runtimes. The typical use-case it provides is to streamline data exports to third-party observability tools like Coralogix’s machine learning platform. Using Lambda Extensions can save on your AWS bill because it allows you to bypass CloudWatch, which was previously required to export data automatically.
Amazon Web Service’s CloudWatch is a service that allows you to monitor and manage deployed applications and resources within your AWS account and region. It contains tools that help you process and use logs from various AWS services to understand, troubleshoot, and optimize deployed services. This article will show you how to get an email when your Lambda logs over a certain number of events.
Setup
To follow this tutorial, you need to set up an AWS account. I have created a Lambda function that logs a random number between 0 and 200 to simulate tracking the number of users subscribing to my system. I used serverless to deploy this lambda function to my AWS account. The Lambda function is triggered by a CloudWatch rule periodically to simulate the number of users subscribed each minute.
CloudWatch Metrics
Tracked AWS service events called Metrics can trigger alarms when the metric exceeds some preset threshold. Many AWS services produce metrics automatically, but you can also create custom metrics to track better precisely what you need in your AWS services. See the CloudWatch User Guide for a list of automatically created metrics.
You can create metric filters using data logged by AWS services such as Lambda. Once a Lambda logs into CloudWatch, you can create a filter based on the data patterns seen for that function. CloudWatch takes the filter and converts data into numerical metrics that can trigger alarms. This article will show you how to create a metric on your logged data to track logged errors.
Step-by-Step: Create a Metric Filter
Let’s walk through how to set up a custom metric filter using CloudWatch logs from a Lambda function. To follow these steps, you must set up a lambda that sends logs to CloudWatch.
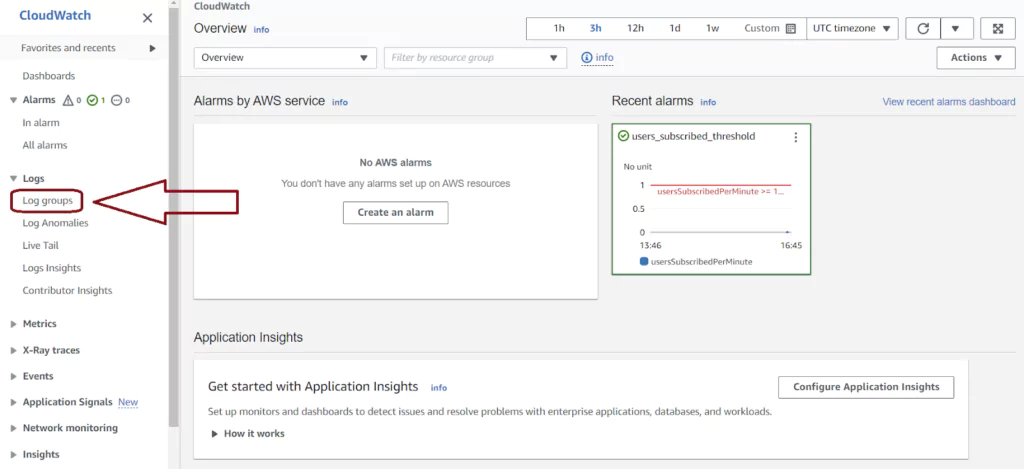
Navigate to the CloudWatch console in AWS. You can find your logs by selecting Log groups from the left vertical menu. The Log groups page has one entry for each Lambda function, ECS function, and any other service instance logging to CloudWatch. Labels in the Log group name indicate the AWS service and instance logging. Click on the Log group name to see the CloudWatch logs from that instance.
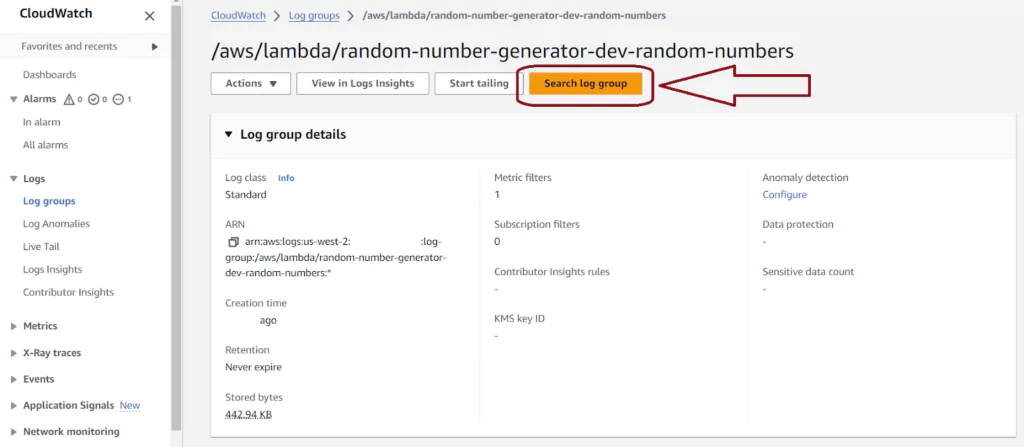
The Log streams page for Lambdas shows each Lambda instance. Lambda reuses instances over time, and multiple instances may run in parallel. To see the logs for any instance, click on the blue Log stream name labeled for the first run date. For a time-series view of logs from all Lambda instances, click the orange Search log group button.
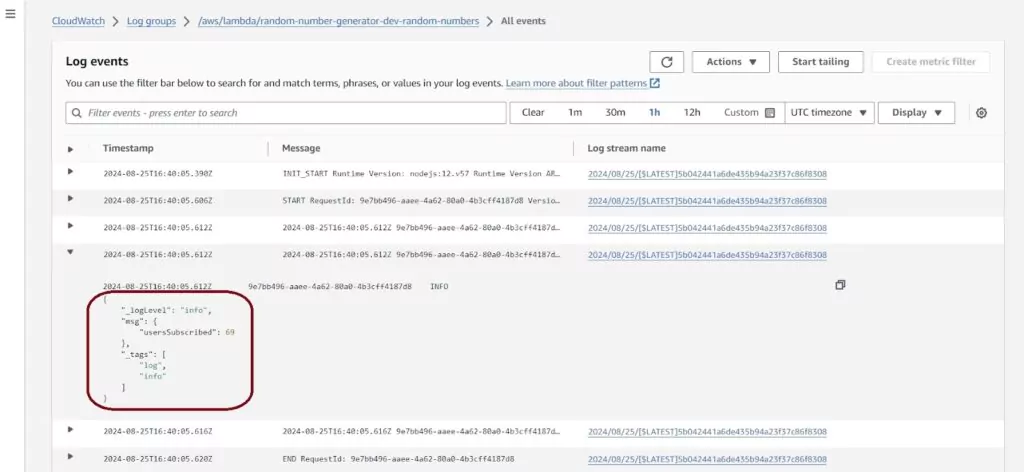
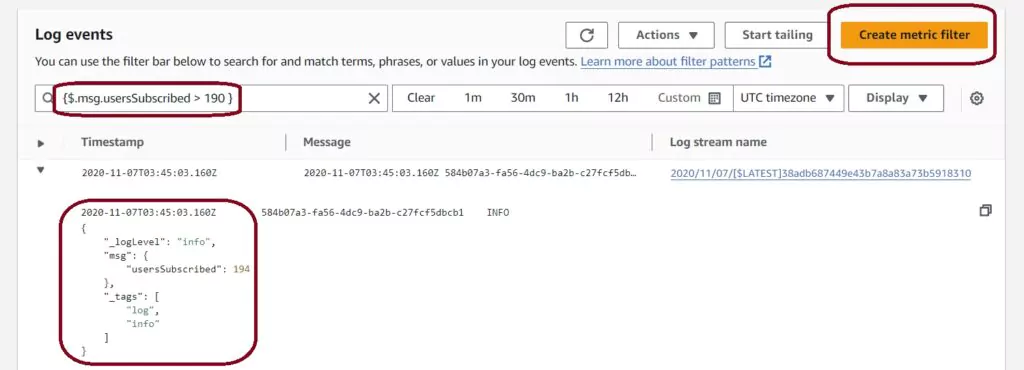
The next Log events page has a list of all the logs present for all time ordered from oldest to most recent. You can keep scrolling down to load more logs if you have more records than will fit on the page. You can also time-filter the CloudWatch logs using the top horizontal menu. Filters can be relative or fixed. Here I have logs that I will use for my metric: keeping track of the usersSubscribed value.
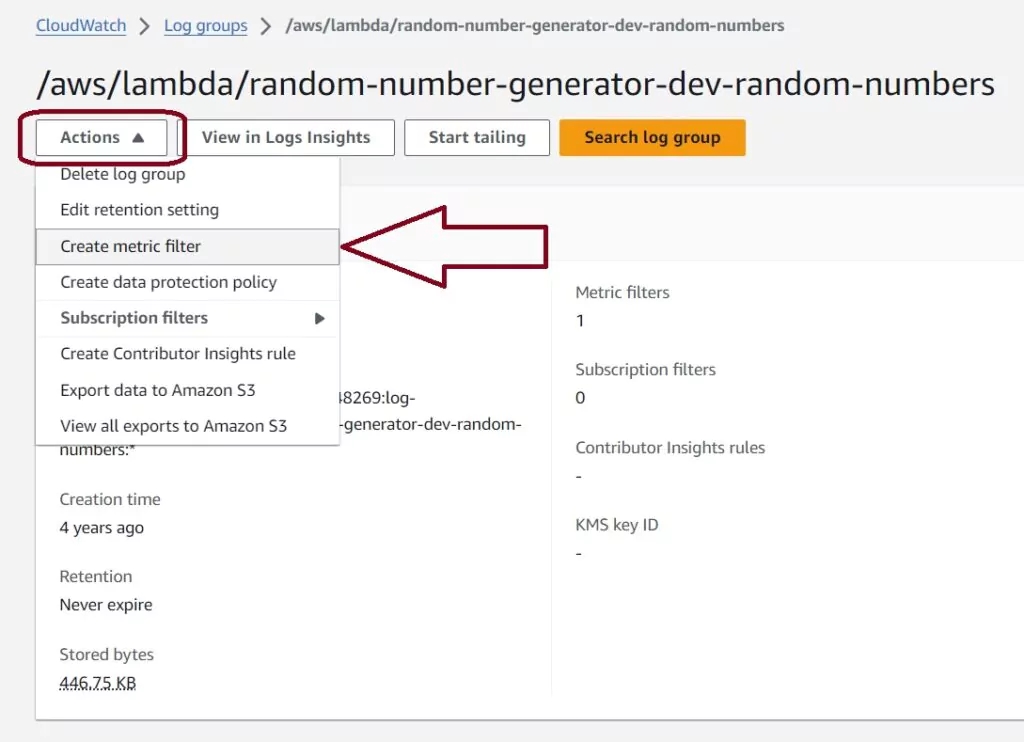
To create a metric filter, you can go back to the main log page for this Lambda and select actions and Create Metric Filter. This will lead to a page that allows us to create a new filter. Another option is to type the filter into the search bar in the Log events page.
Now we want to make a useful search for our logs. Find details on the syntax used on the AWS Filter and Pattern Syntax page. I will create a metric filter based on the random number generated; I only show logs where usersSubscribed are more than 190. The filter configuration that does this for my log looks like this:
{$.msg.usersSubscribed > 190}
Once the filter is preset, the Create Metric Filter button turns orange, allowing us to create our metric filter. The search can be applied on this page as well so we can ensure the filter is working for the expected events.
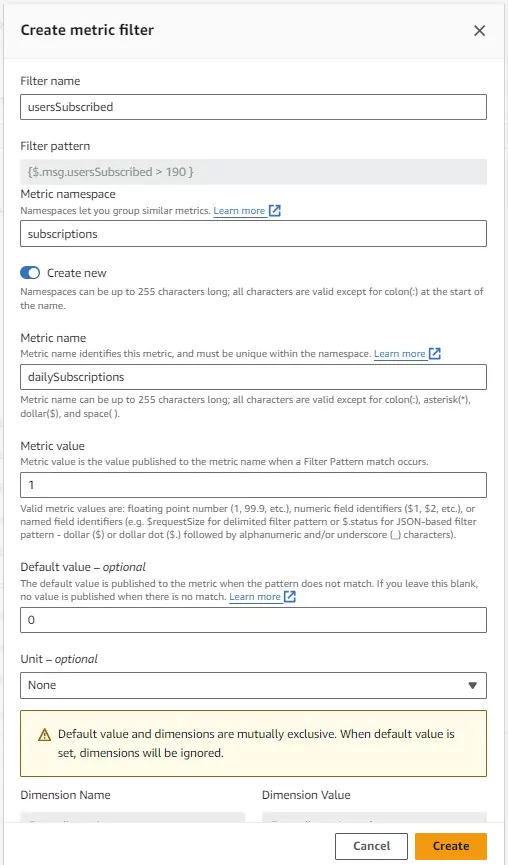
After pressing the Create Metric Filter button, a pop-up will appear, allowing the setup of the metric filter configuration. The filter expression is automatically transcribed. I have selected the filter name, metric name, and metric namespace. The metric namespace allows isolation of logs from one another so that aggregations don’t accidentally include invalid data.
When the filter returns a valid log, the metric value specified here logs into the metric. In this case I chose to show a value of 1 when my usersSubscribed value is greater than 190 and show 0 otherwise.
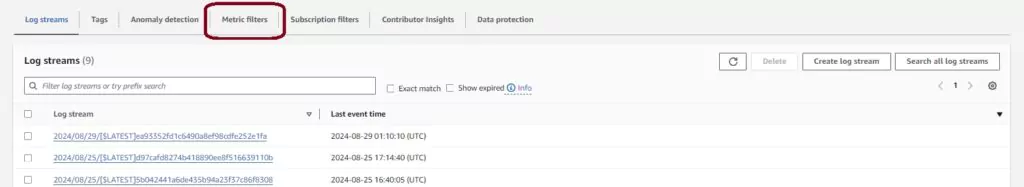
After creating the metric filter, you can view and edit its configuration in the Metric Filters tab in the CloudWatch logs.
CloudWatch Alarms
Once you have created or chosen your metric, you can create an alarm from it. You can set up alarms using AWS CloudFormation, the AWS CLI, or the AWS console. Alarms can subsequently produce an AWS EC2 action, execute an AWS Auto Scaling Action, or send a notification to an AWS SNS topic.
Below are the steps to create an alarm that will send an email when the metric detects a value higher than my limit. When the alarm is triggered, it will send the owner an email about the issue.
Step-by-Step: Create a CloudWatch Alarm
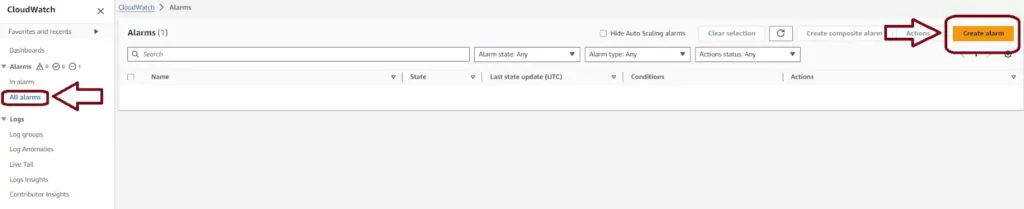
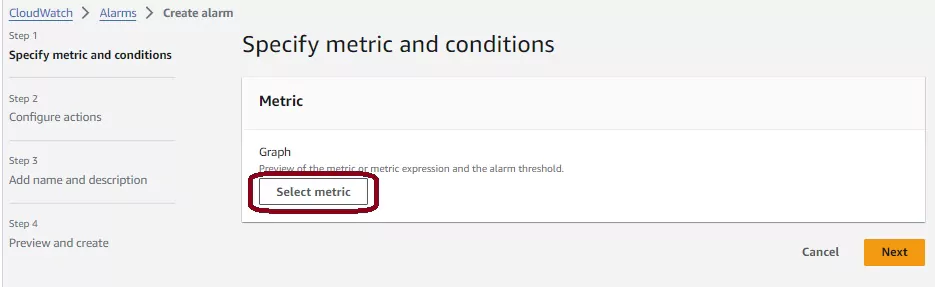
Login to your AWS account and navigate to the AWS CloudWatch console. On this page, you choose the Alarms menu item from the left-hand menu, then press the orange Create Alarm button in the navigation pane.
Next, AWS will take you to a page with a simple step-by-step process for creating your alarm after pressing the Create alarm button. There are four steps to complete.
First, you need to select which metric should trigger the alarm. Press the white Select metric button to configure this.
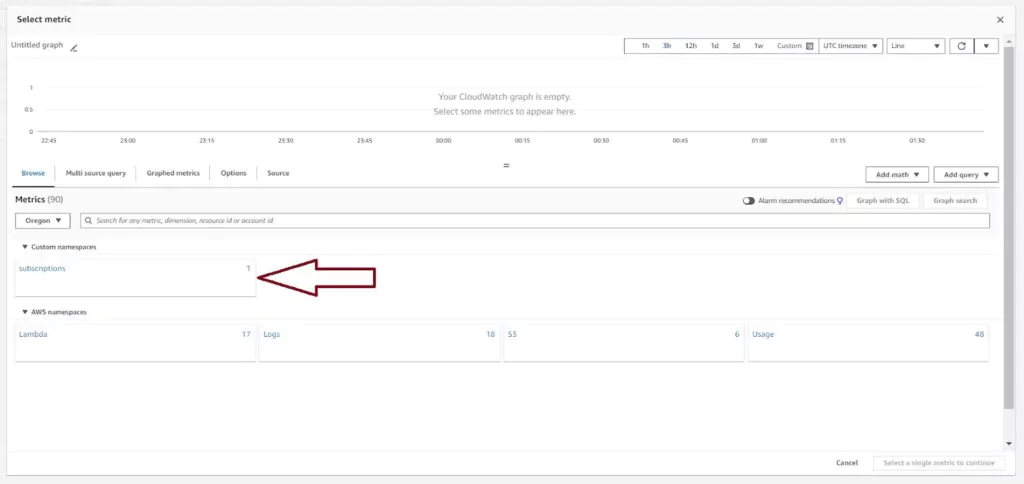
The Select metric page has all options available for alarms present including default metrics created by AWS. For Lambdas, this includes metrics like throttle rates, errors, and invocation counts. Most AWS services have some default metrics available here.
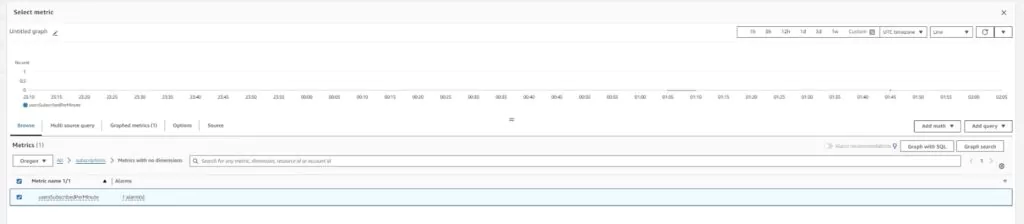
Since I have created a custom metric filter in the previous section, I will select that metric to use for the alarm. Custom metrics are listed under the custom namespace we created in the CloudWatch Metrics section. Click on subscriptions and then on Metrics with no dimensions to find the previously created filter named usersSubscribed per minute.
The setup of the Graphed metric defaults to showing the average of the metric value over 5 minute periods. The metric is logging a 1 when the number of users subscribed is more the 190 and is logging 0 when the number of users subscribed is less. The graph shows the metric’s output for a configurable period to show the metric’s logging behavior. With the graph set up to support my wanted alarm, press Select metric.
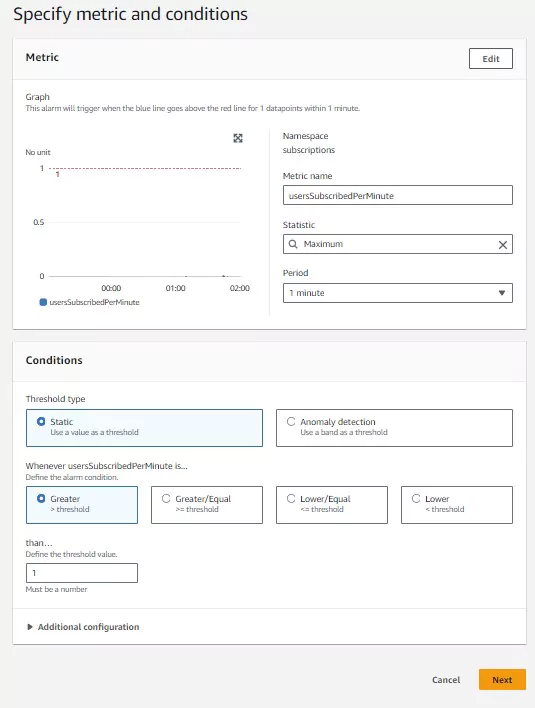
The next page, titled Specify metric and conditions, sets up the metric’s configuration and the Conditions to trigger the alarm. In this case, the average is not useful for the alarm, so it uses the Maximum statistic. There are many other statistics to choose from in the drop down menu. Also, since I expect to receive data each minute on this statistic, I changed the Period to 1 Minute. In the Conditions section, we choose whether to use Static or Anomaly detection triggers. Static triggers will cause an alarm by comparing the metric data to some value. Anomaly detection triggers use CloudWatch machine learning algorithms to analyze metrics and trigger an alarm when it sees behavior outside of the norm.
This alarm will trigger on static conditions whenever more than 190 users subscribe within 1 minute. Since my metric logs a value of 1 in that event, I set my static condition to trigger when the usersSubscriptionPerMinute metric is greater than or equal to 1. Once the configuration is complete, click next.
Next, we will configure the actions the alarm will take once it is triggered. There are five different action options and each is discussed below.
Once I create all the actions I want to occur, I complete the alarm’s creation by pressing the orange Create alarm button.
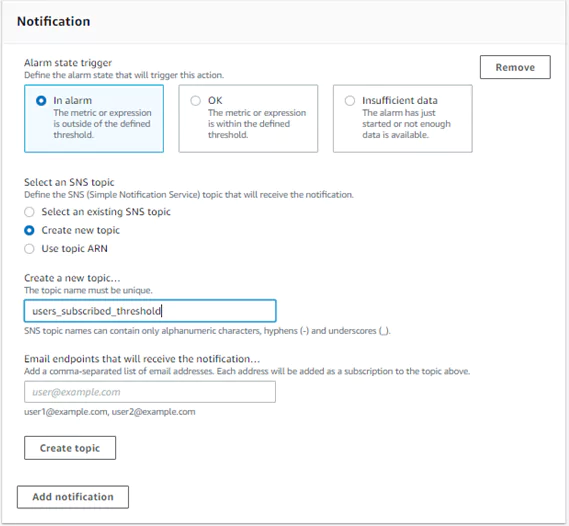
1. Send a Notification Action Using an SNS Topic
To configure a notification action, we first need to choose when actions should occur. The action could occur when the metric is in an alarm state, when the metric is not is an alarm state, or when the alarm has insufficient data to determine the alarm state.
I have chosen to have my alarm state trigger an action when the metric is in an alarm state. The action will proceed whenever more than 190 users have subscribed at a time.
If you do not already have an SNS topic setup, you can create one from this page. You need to name your topic and insert an email address to use when alarm actions are triggered.
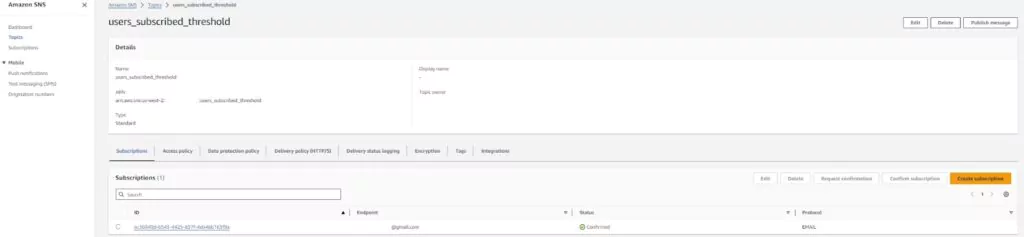
View the new SNS topic on the Amazon SNS page under the topics section. The name should appear as specified. Click on the topic to view more details and edit the topic.
Editing the topic allows you to add or change the email addresses used in the SNS topic. SNS will list the email addresses as unconfirmed until the email’s owner follows the confirmation link sent to that email. If the alarm is triggered, unconfirmed emails will not receive the notification.
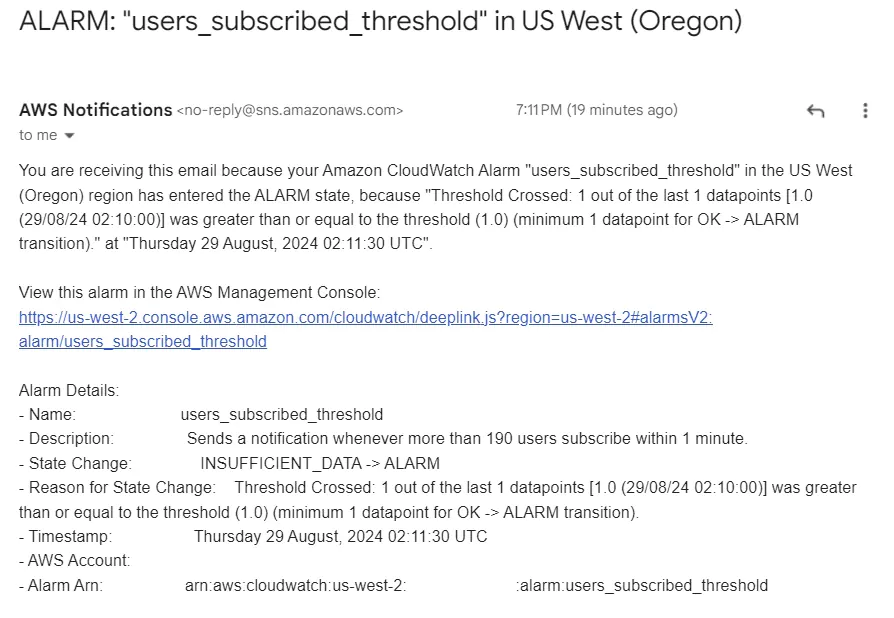
When an alarm is triggered, confirmed emails will receive an email notifying them of the event(s). The email contains crucial information that the user may want to take action on.
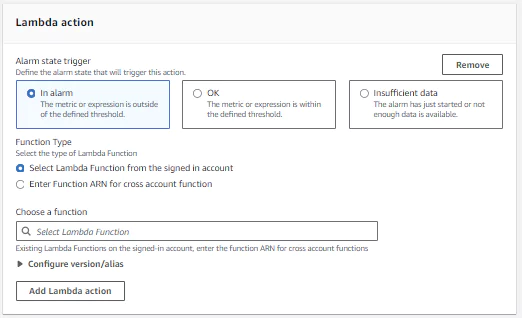
2. Lambda action
To configure a Lambda action, first determine which state should trigger the Lambda. Next determine which Lambda should be triggered. The input to the Lambda will contain event data and can be used in the Lambda logic.
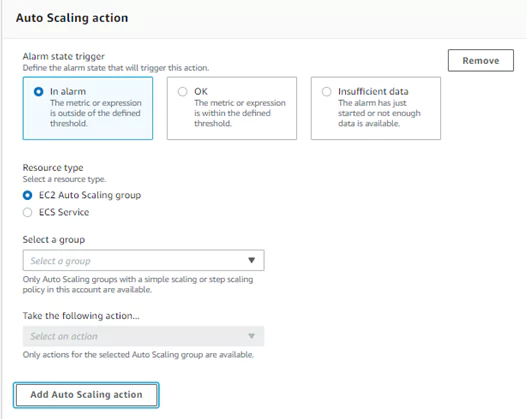
3. Auto Scaling action
To configure an auto-scaling action, first determine when the alarm state should trigger the action. These are the same options as provided in sending an SNS notification (above). Next, choose which resource type to scale between an EC2 Auto Scaling group and an ECS service. You must configure the ECS and EC2 instances separately before you can use them in an alarm. In each case, the alarm will trigger more EC2 instances within the set group or start more ECS tasks, respectively, to run.
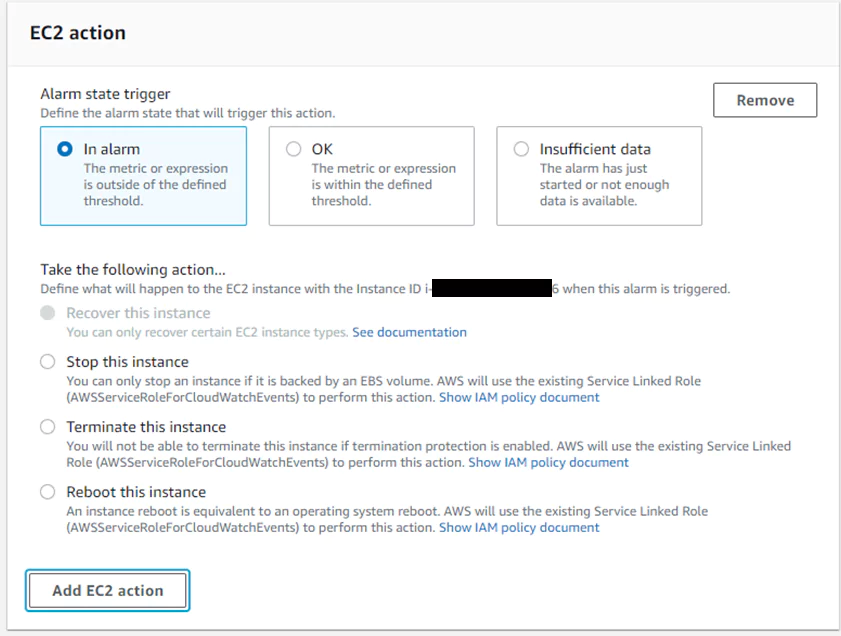
4. Take an EC2 Action
Use alarms to terminate, to reboot, or to recover EC2 instances. Since a lambda triggers this alarm, I will not use this option here. If the metric used in the alarm is anything other than an EC2 per-instance metric, this option is not available. If you have that metric configured, the menu will appear as in the image below to select which action is required.
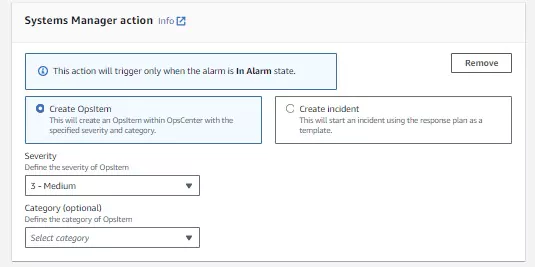
5. Systems Manager action
There are two options within Systems manager actions: create and OpsItem or create an incident.
OpsItem actions create event logs for sys-ops data. If the metric used for the CloudWatch alarm is tracking cost or performance, this action will log an event when those values reach a certain level. I will trigger a Cost event log with this configuration when the cost’s severity with this configuration is only considered medium. This will allow me to intervene before my price is beyond my budget.
Creating an incident will trigger a pre-made response plan. These plans are created in the Incident Manager service in AWS first and then can be linked to actions required for certain metrics.
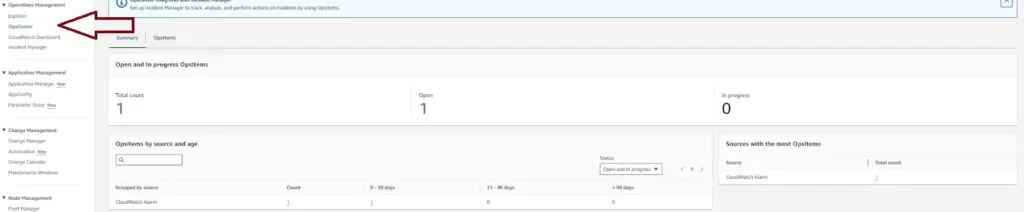
OpsItem Logs are found on the Systems Manager page of the AWS console. Click on OpsCenter in the left vertical menu to see the list of configured alarms.
When building a microservices system, configuring events to trigger additional logic using an event stream is highly valuable. One common use case is receiving notifications when errors are seen in one of your APIs. Ideally, when errors occur at a specific rate or frequency, you want your system to detect that and send your DevOps team a notification.
Since AWS APIs often use stateless functions like Lambdas, you need to include a tracking mechanism to send these notifications manually. Amazon saw a need for a service that will help development teams trigger events under custom conditions. To fill this need, they developed CloudWatch Events and subsequently EventBridge.
Introduction to CloudWatch Events
CloudWatch Events and EventBridge are AWS services that deliver data to a target upon occurrence of certain system events. They work on the same backend functionality, with EventBridge having a few more implemented features. System events supported include operational changes, logging events, and scheduled events.
CloudWatch Events will trigger a subsequent event when a system event occurs, sending data to another service based on your setup. Triggered services can include calling Lambda functions, sending SNS notifications, or writing data to a Kinesis Data Stream.
Event Triggers
AWS represents all events with JSON objects that have a similar structure. They all have the same top-level fields that help the Events service determine if an input matches your requested pattern. If an event matches your pattern, it will trigger your target functionality.
You can use commands to write directly to EventBridge from AWS services like Lambda. Some AWS services like CloudTrail and external tools can also automatically send data to EventBridge. External sources with AWS integrations can also be used as event triggers.
Event Buses
Event buses receive events from triggers. Event triggers and event rules both specify which bus to use so events can be separated logically. Event buses also have associated IAM policies that specify what can write to the bus and update or create event rules and event targets. Each event bus can support up to 100 rules. If you require more event rules, you must use another event bus.
Event Rules
Event rules are associated with specific event buses. Each rule determines whether events meet certain criteria. When they do, EventBridge sends the event to the associated target. Each rule can send up to 5 different targets which process the event in parallel.
AWS provides templates to create rules based on data sources. Users can also set up custom rules which further filter data based on its contents. For a complete list of available filtering operations, see the AWS specification for content-based filtering.
Event Targets
Event targets are AWS endpoints triggered by events matching your configured pattern. Targets may just receive some of the event trigger data directly for processing.
For example, you can trigger an AWS Lambda function with the incoming event data, using Lambda to process the event further. Targets can also be specific commands like terminating an EC2 instance.
How to Set Up CloudWatch Events in EventBridge
Now that we have covered some parameters of CloudWatch Events, let’s walk through an example of how to set up an event trigger and target.
In this example, we will use the EventBridge interface to set up a rule. The EventBridge interface is very similar to the interface available in CloudWatch. The rule we make will trigger a Lambda when an API Gateway is hit with invalid input. DevOps teams commonly see invalid inputs when nefarious users are trying to get into your API.
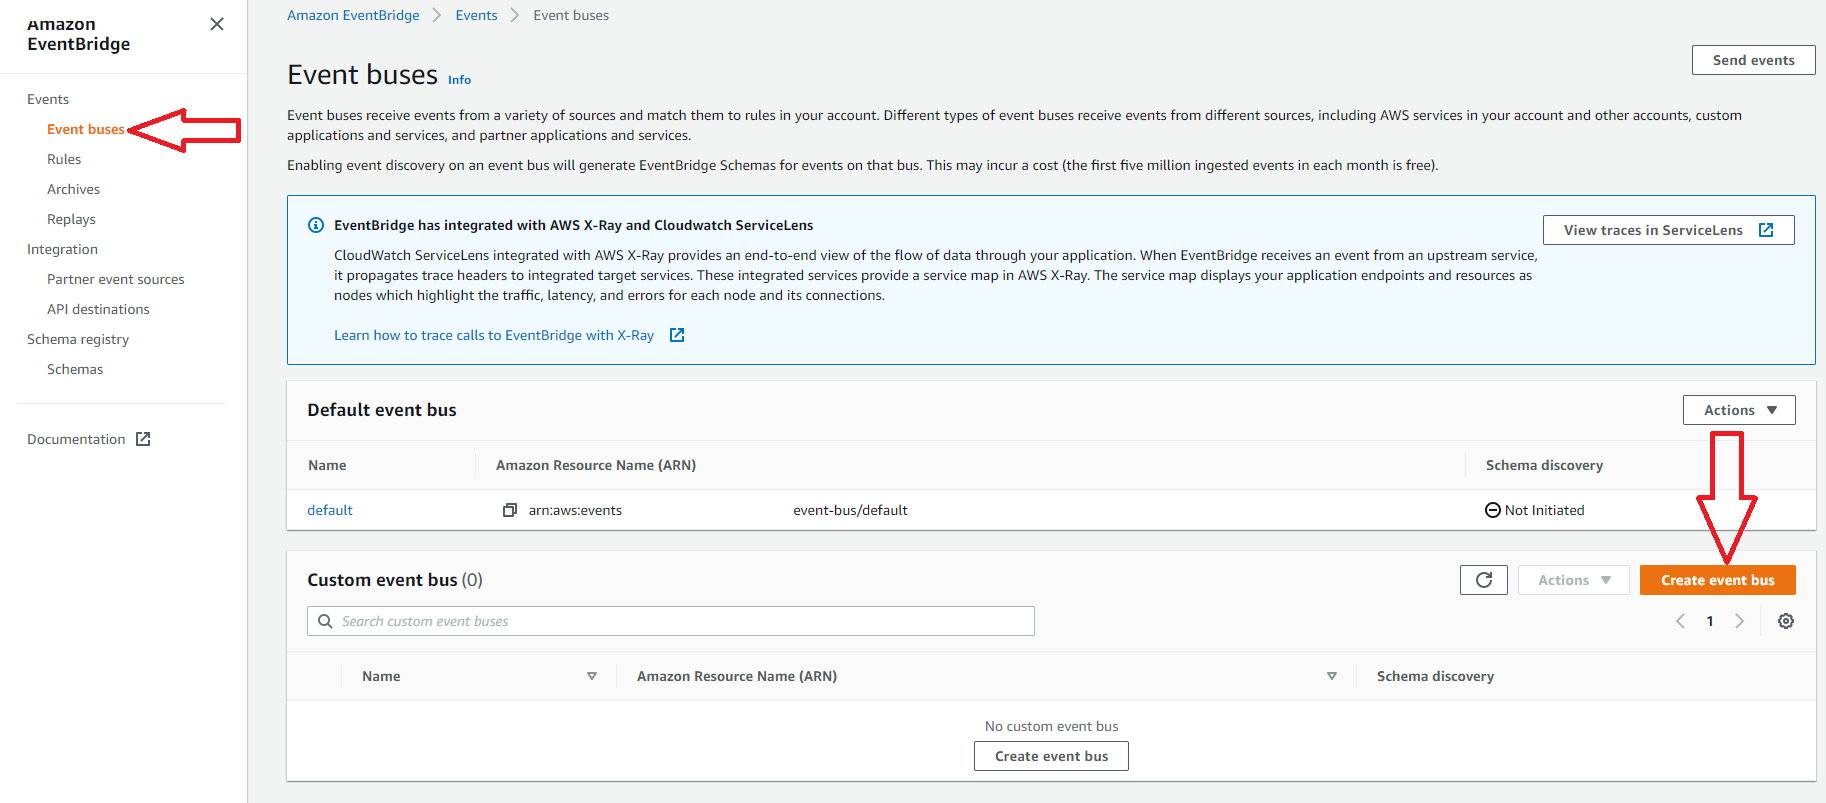
1. Create a New Event Bus
This step is optional since AWS does provide a default event bus to use. In this example, we will create a new event bus to use with our rule. Since rules apply to only one event bus, it is common to group similar rules together on a bus.
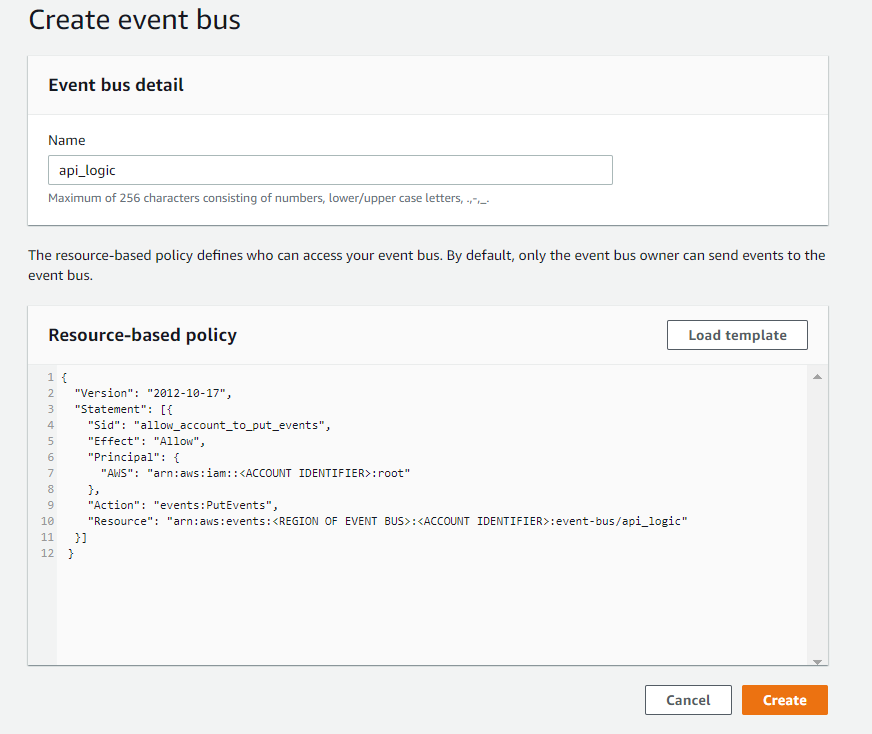
2. Name and Apply a Policy to the New Bus
To create your bus, add a name and a policy. There is an AWS template available for use by clicking the load template button, as shown below.
This template shows three common cases that could be used for permissions depending on the triggers and targets used. For more information about setting up the IAM policy, see the AWS security page for EventBridge.
The example below shows permissions for an account to write to this event bus. When ready, press the create button to finish creating your event bus.
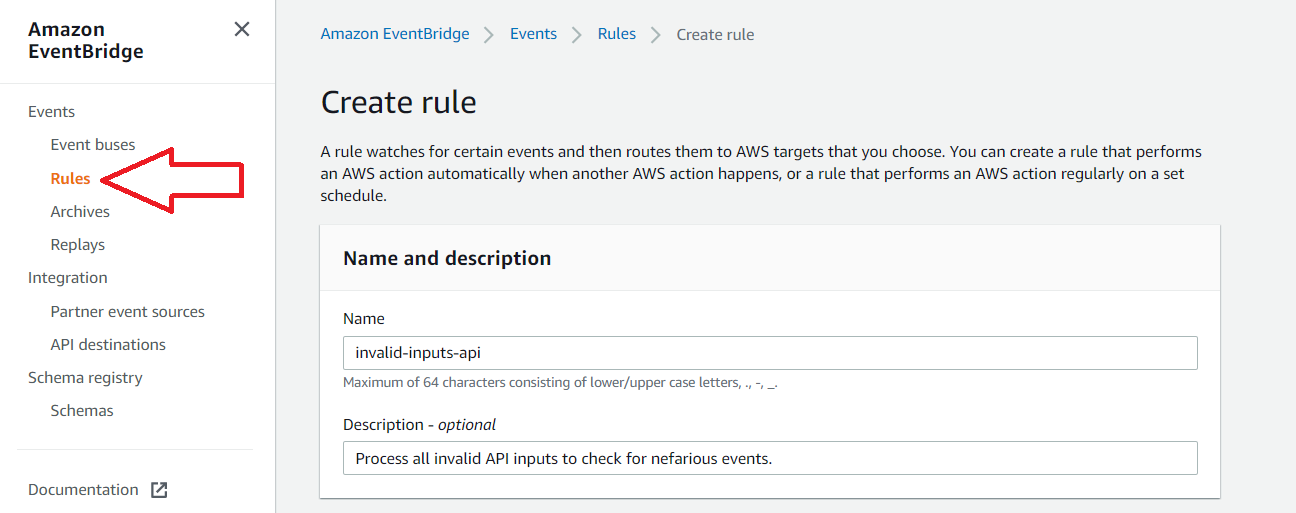
3. Navigate to the Rules Section in the Amazon EventBridge Service
In this example, we will skip creating an event bus and use the default provided by AWS. Add a name and optionally add a description for the new rule.
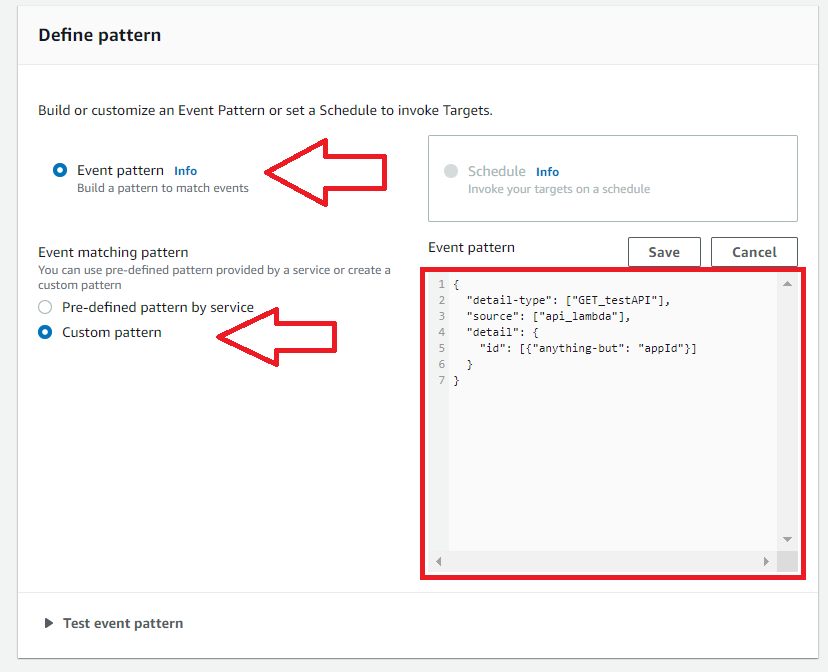
4. Select Event Pattern
Here there is an option between two types of rule: event pattern and schedule. Use event pattern when you want to trigger the rule whenever some specific event occurs. Use schedule when you want to trigger the rule periodically or using a cron.
5. Select Custom Pattern
Here there is an option between two types of pattern matching. AWS will route all data for the source through your event bus when you use pre-defined pattern by service.
Since we want only specific events from the Lambda behind our API, we will choose custom pattern. The pattern below will look at event values sent from our Lambda function to the event bus. If the event matches our requirements, EventBridge sends the event to the target.
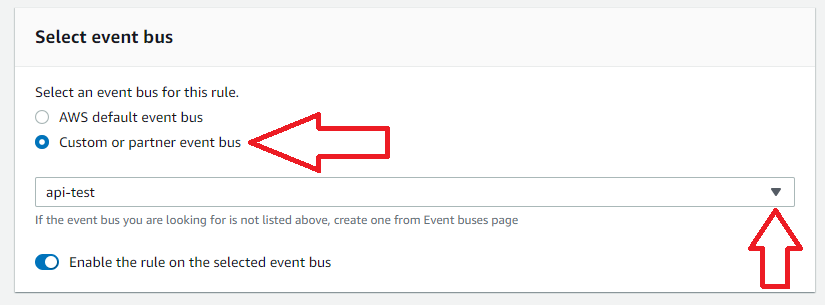
6. Select the Event Bus
Select the event bus for this rule. In this case, we will select our custom bus created in Step 2.
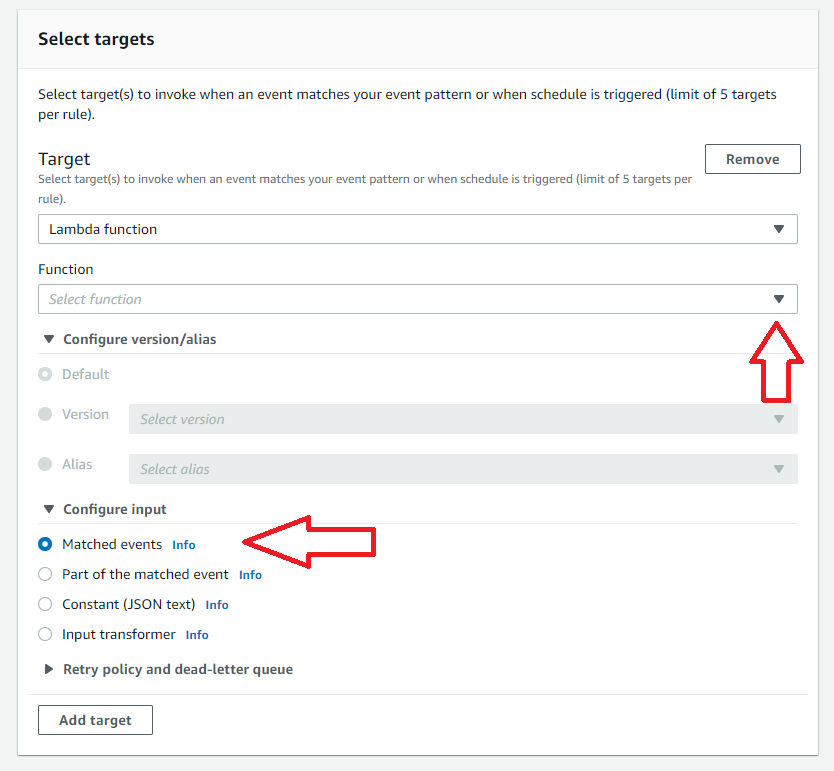
7. Select Targets
Select targets for your rule by selecting the target type and then the associated instance of the type. In this case, a Lambda function will be invoked when an event matching this rule is seen.
By selecting Matched events, the entire event content will be sent as the Lambda input. Note there is also the capability to set retry policies for events that cause errors in the target functions. After this step, press Create Rule to complete the EventBridge setup.
Once the event bus and rule are created as above, writing to the EventBridge inside the API’s Lambda function will trigger your target Lambda. If using a serverless deployment, the AWS-SDK can be used to accomplish this.
Processing in the target Lambda should track when errors occur. Developers can create metrics from the errors and track them using custom microservices or third-party tools like Coralogix’s metrics analytics platform.
You can also send raw data to Coralogix for review by directly writing to their APIs from EventBridge instead of hitting a Lambda first. EventBridge supports outputs that directly hit API Gateways, such as the one in front of Coralogix’s log analytics platform.
Wrap Up
Amazon enhanced CloudWatch Rules, creating a unique tool called EventBridge. EventBridge allows AWS users to process events from many different sources selectively. Processing data based on content is useful for processing large, disparate data sets.
Information tracked in EventBridge can also be used for gaining microservice observability. EventBridge uses triggers to send data to an event bus. Event rules are applied to each bus and specify which targets to invoke when an event matches the rule’s pattern.
In the example above, EventBridge’s configuration will detect invalid API call events. This data is helpful, but at scale will need further processing to differentiate between a nefarious attack and simple errors.
Developers can send data to an external tool such as Coralogix to handle the analysis of the API data and to detect critical issues.
One of the keys to CloudWatch’s success is its no bang, no buck billing cloud cost optimization system. The pricing structure has been designed from the outset to ensure that CloudWatch users only pay for what they actually use. In addition, the CloudWatch Free Tier allows first-time users to test the waters without shelling out.
The downside of this flexibility and adaptability is complexity. In order to optimize cloud cost fairly and accurately, the pricing structure needs to separately track the utilization of a diverse range of system tools and components.
Because developers in a business environment can’t always keep tabs on, say, the precise amount of logging data they collect, customers who aren’t accustomed to CloudWatch can find themselves in the position of a tourist who raided their hotel minibar and is now being billed by the said hotel.
The following article will explain how CloudWatch billing breaks down, and hopefully, give you a clear idea of what you can expect your monthly bill to be.
Dashboards
Dashboards are the simplest feature to cost. CloudWatch allows you to create three Dashboards with 50 metrics for no charge, beyond that each Dashboard you create costs $3 per month. In comparison, Coralogix charges nothing extra for dashboards and includes this as part of your processing costs.
Logging
AWS logging has three stages called Collect, Store, and Analyse. Collect involves the actual logging of events in a process called data ingestion. Store involves archiving log data for future use. Analyse is the process of running queries to extract data and insights from the log.
CloudWatch’s Free Tier allows you to process 5GB of logging data for no charge. Beyond this, AWS charges you a small amount to perform Collect, Analyse, and Store stages. Data ingestion in the Collect stage costs $0.50 per GB. Running queries in the Analyze stage costs $0.03 per GB. Archiving logs in the Store is billed at $0.005 per GB.
A good cost estimate for CloudWatch logs can be arrived at by adding these three costs together and multiplying them by the amount of logging data you want to process. Here’s a simple table to show monthly logging costs to process 100, 200, and 300GBs of data.
[table id=47 /]
Vended Logs
Vended logs, such as Amazon VPC flow logs, are published natively by AWS services. Vended logs may potentially save you money because they are available at volume discounts. While they have a number of different delivery outlets such as S3 and Kinesis, this article will focus on CloudWatch logs. The total cost per GB for CloudWatch logs delivery consists of two parts, data ingestion – which involves collecting raw performance data for logs, and data storage – storing the logs in CloudWatch for later viewing. Data ingestion is $0.50 per GB and data storage costs an extra $0.03 per GB. In total, this means vended logging has a cost per GB of $0.53.
The following table gives an estimate of the monthly logging costs for 100, 200, and 300GBs of data.
[table id=48 /]
Metrics
Metrics are one of CloudWatch’s most powerful tools. The ability to perform statistical analysis of metric data coupled with the ability to create custom metrics allows you to monitor system performance from lots of different angles.
CloudWatch allows you to have 50 metrics per Dashboard free of charge. Beyond that, there is a small monthly charge for each additional metric you have. Above the first 10,000 metrics, the monthly cost is tiered. Below is a table showing these tiers.
[table id=49 /]
Coralogix does not charge extra for metrics. The logs2metrics feature is bundled in with your fees when you initially process the data. Moreover, you can categorize your less “valuable” data and pay even less for it.
In addition to the cost of custom metrics, you also need to think about the cost of performing API requests. You can make an API request with get-metric data with up to five statistics per metric. If you request any more, it’s billed as if you created an additional metric. Here is a table showing costs for a range of API request commands.
[table id=50 /]
Billing in the Wild
To give an idea of how the above costs scale in an enterprise application, let’s do some calculations. Suppose you have an application with 200 instances and each instance has 10 custom metrics. AWS estimates that each EC2 Instance contains on average 7 metrics. In addition, applications are producing 10GB of logs per day.
VPC flow logs pricing
To calculate the monthly cost if this application runs 24×7, we first need to ascertain the total number of metrics. Since there are 200 instances with 10 metrics per instance, there are 2000 metrics in total. Now we need to account for the tiered pricing structure shown in the previous table.
It’s helpful to visualise our 2,000 metrics as a tower with the first 10,000 metrics at the base. By looking at our table we can see our 2,000 metrics are priced according to the bottom tier, each metric costing 30 cents per month. The total cost is $600.
Second is the simple cost of log retention. At 10GB per day, we’re producing 300GB of logs per month. We will use our previously declared cost of $241.
Now let’s calculate the cost of API requests. If we assume we’re dealing with a 30 day month and each instance makes one request every 5 minutes, our application makes 1,728,000 requests per month. Now we need to use the same trick we did with custom metrics, visualizing the total API request number as a banded tower. At the base, the first 1,000,000 API requests don’t cost anything. 1,728,000/1,000 * $0.01 = $17.28
The total CloudWatch costs for our application run to $859.28 per month.
Cloudwatch bills in several constituent parts and each of those components sums to a hefty bill. In contrast, Coralogix gives you one simple monthly cost.
Final Thoughts
CloudWatch’s billing system has a reputation for being complex and difficult to understand. The complex, tiered system makes it tricky to work out how much you’ll be paying at the end of the month. Rather than doing your own accounting, simplify your bills and save up to 70% on your logging costs, with Coralogix.
Be Our Partner
Complete this form to speak with one of our partner managers.
Thank You
Someone from our team will reach out shortly. Talk to you soon!
 The new standard of observability is here. Discover Olly, the industry’s first