Our team has been hard at work this month to introduce 2 new parsing rules, DataMap improvements, updated tracing visualizations for SLA monitoring & more.
Get up to speed on everything that’s new and improved in the Coralogix platform!
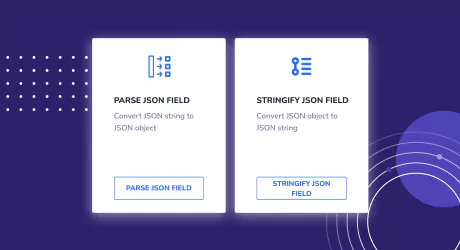
This month we are introducing 2 new parsing rules to bring more value to customers who have many fields and nested fields in their log data.
The new Stringify JSON Field and Parse JSON Field rules enable you to parse escaped JSON values within a field to a valid JSON object and vice versa – stringify a JSON object to an escaped string.
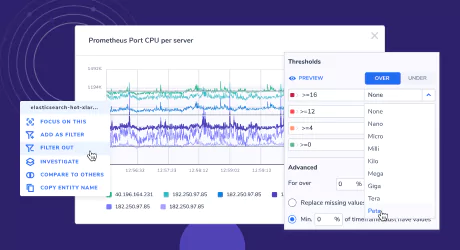
The DataMap allows you to build custom mappings of your infrastructure using metric data for monitoring system health and quickly identifying issues.
In the Group Editor, you’ll find new options to:
Sort the display by attributes (e.g. sort by severity for defined thresholds)
Scale threshold values to make metric graphs more readable
Limit the number of hexagons shown per group
In the DataMap display, use new ‘Compare to others’ functionality to compare an element with 10 others in the same group. Plus, expand and collapse specific groups to minimize the number of displayed elements.
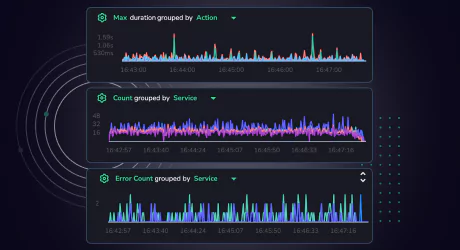
New dynamic graphs and saved views in the Tracing UI enable it to serve as SLA dashboards for any application or service.
In addition to the original default graph for Max duration by Action, there are now two additional default graphs for Count by Service and Error Count by Service.
All three graphs can be customized, and aggregation operators have been added for 99, 95, and 50th percentiles to help deepen your ability to monitor business SLOs.
When investigating traces in the explore section, you can now save your current view and load saved views just like you do in the Logs UI.
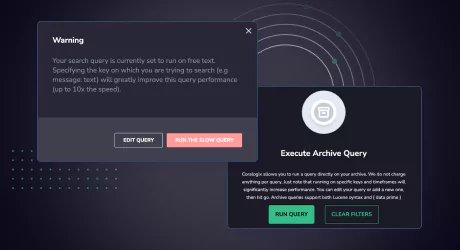
New Execute Archive Query function allows you to review active filters before clicking ‘Run Query’. To prevent unexpected wait times, queries will no longer run automatically when switching from Logs to Archive.
Non-optimal archive queries (e.g. “hello”) will trigger a warning pop up recommending to improve the query conditions.
Serverless computing is on the rise, having already earned the mantle of “The Next Big Thing”. For developers, serverless computing means less concern regarding infrastructure when deploying code, as all computing resources are dynamically provisioned by the cloud provider.
Azure pricing is generally on a pay-as-you-use model and is based on resources consumed – which is in line with modern business principles of “on-demand”, flexibility and rapid scaling.
We’ll look at some of the big players in this space, including what to look out for when considering the right partner when it comes to serverless computing for your organization.
The Serverless Landscape
As technology moved from mainframes to PCs, to the appearance of “the Cloud” in the mid-2000s, there has been a move towards increased efficiency, better use of resources, and lower costs.
A decade later, “serverless” entered the mainstream conversation and is now recognized almost universally. The term has been linked to Backend as a Service (BaaS), such as the authentication services offered by providers like Facebook; or Function as a Service (Faas), where applications with server-side logic are run over stateless containers, and completely managed by 3rd party providers.
This popularity has been further served by leading technology companies offering their own implementations: AWS offering its AWS Lambda since 2014, Microsoft with its Functions architecture for Azure, and of course Google Cloud Functions.
AWS Lambda
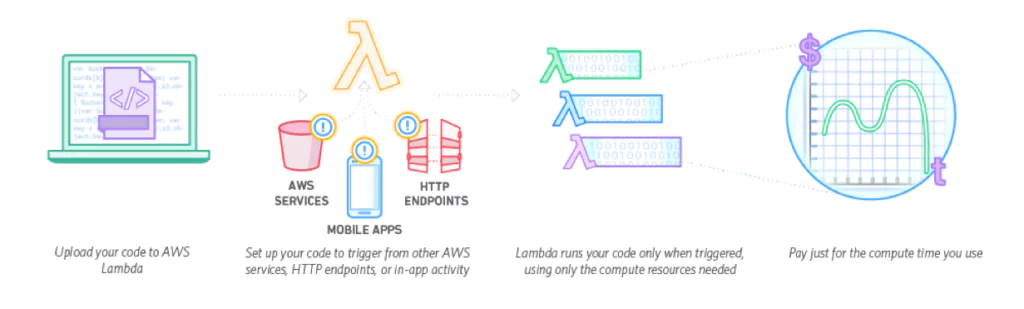
AWS Lambda is a serverless computing platform, implemented on top of AWS platforms such as EC2 and S3. AWS Lambda stores and encrypts your code in S3. When a function is requested to run, a “container” is created using your runtime specifications, deployed to one of the EC2 instances in its compute farm, and that function is executed.
When a Lambda function is created, you need to specify things like the runtime environment, memory allocation, roles, and the method to execute. You can build Lambda functions in Node, Java, Python, and C#, and AWS Lambda seamlessly deploys your code, does all the administration, maintenance, and security patches, and provides built-in logging and monitoring through Amazon CloudWatch.
General positive feedback about Lambda is that it’s simple to set up, pricing is excellent, and it integrates with other internal AWS products such as RDS and Elastic Beanstalk.
When it comes to drawbacks of the solution, there have been 2 main areas where there has been criticism:
“Cold Start”: Creating a temporary container (that is subsequently destroyed) can take between 100 milliseconds to 2 minutes, and this delay is referred to as “cold start”.There are various workarounds to negate this, but it is something important to be aware of.
Computational Restrictions: Being based on temporary containers means that usable memory is limited, so functions requiring a lot of processing cannot be handled by AWS Lambda. Again workarounds are available, such as using a step function.
Additionally, there is an element of “lock-in”, as choosing to go with AWS invariably means you’ll be integrating (and become reliant on) other AWS tools and products in the Amazon ecosystem.
Security for AWS Lambda is impressive, starting with securing your code’s access to other AWS services through the built-in AWS SDK, and integration with AWS Identity and Access Management (IAM). Code is run within a VPC by default, or you can choose to configure AWS Lambda to access resources behind your own VPC. AWS Lambda is SOC, HIPAA, PCI, ISO compliant.
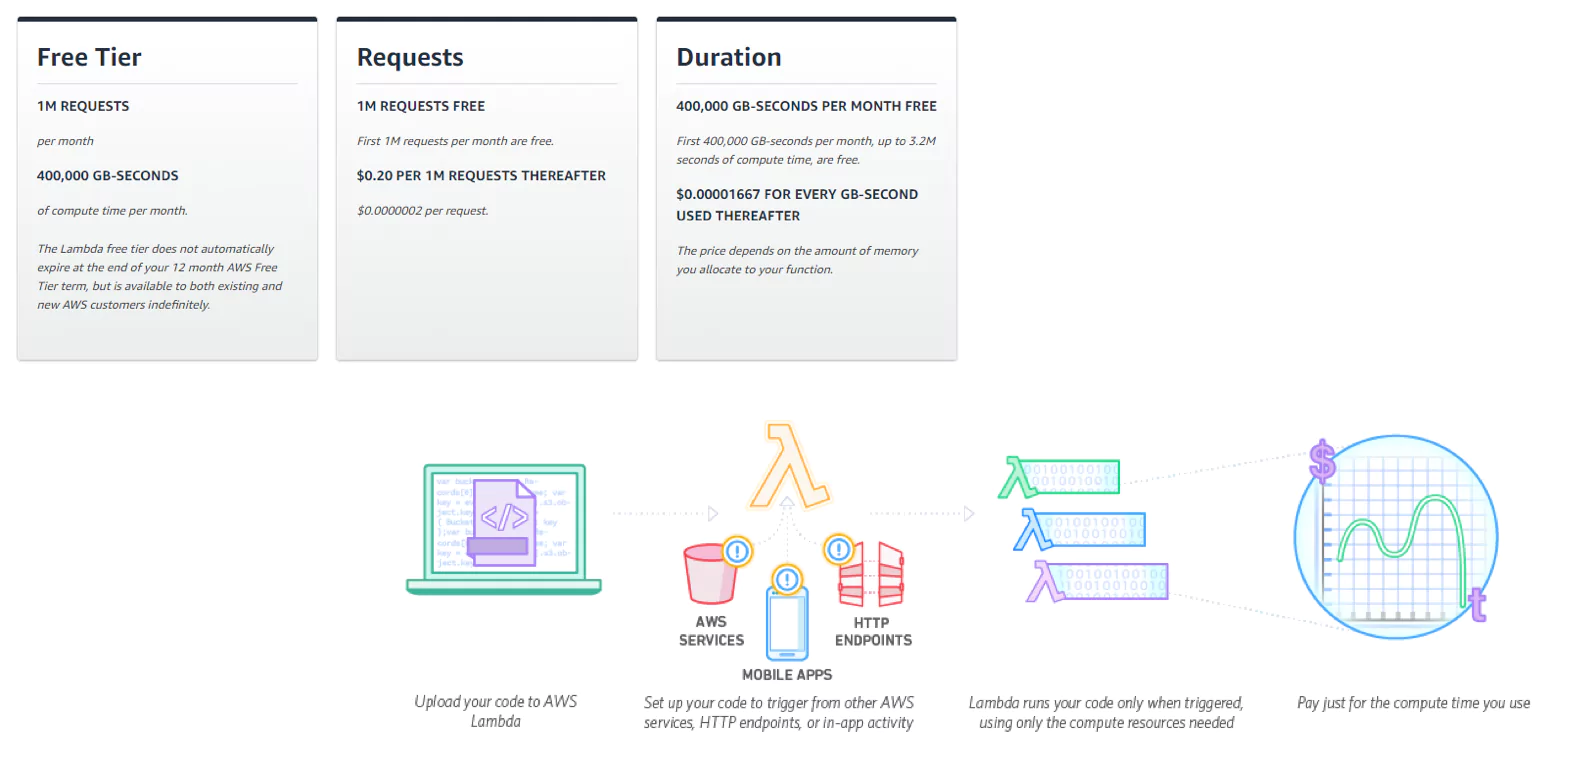
Pricing is per 100ms your code executes, and the number of times your code is triggered – meaning that you don’t pay anything when your code is not running.
The Lambda free tier includes 1m free requests per month and 400,000 GB-seconds of compute time per month. After this, it’s $0.20 per 1m requests, and $0.00001667 for every GB-second used.
Azure Functions
Azure Functions lets you develop serverless applications on Microsoft Azure. Like the other “serverless” solutions, with Microsoft’s Azure, you just need to write the code, without worrying about a whole application or the infrastructure to run it.
Languages supported include C#, F#, Node.js, Java, or PHP, and like AWS Lambda and Google’s Cloud Function offerings, you only pay for the time your code runs.
Advantages of Azure Functions include flexible development, where you can code your functions right in the portal or deploy through GitHub, Visual Studio Team Services, and other supported development tools; the Functions runtime is open-source and available on GitHub; you can use your favorite libraries with support for NuGet and NPM, and integrations with other products in the Microsoft ecosystem.
Integrations are impressive, with the following supported: Azure’s Cosmos DB, Event Hubs, Event Grid, Mobile Apps (tables), Notification Hubs, Service Bus (queues and topics), Storage (blob, queues, and tables), GitHub (webhooks) and Twilio (SMS messages).
Like the other solutions, one of the main disadvantages is vendor lock-in; by going the route of Microsoft Azure, you will in many ways be pinning your colors to the Microsoft mast, which is not for everyone.
Security-wise, you can protect HTTP-triggered functions using OAuth providers such as Azure Active Directory, Facebook, Google, Twitter, and Microsoft Account.
There are 2 types of pricing plans:
Consumption plan: You only pay for the time that your code runs
App Service plan: Run your functions just like your web, mobile, and API apps. When you are already using App Service for your other applications, you can run your functions on the same plan at no additional cost
The Consumption plan is billed on a per-second resource consumption and executions basis.
Execution time is at $0.000016 per GB-second, with 400,000 GB-seconds free per month, and Total Executions is billed at $0.20 per million executions, with 1 million executions free per month.
There are also various support plans available (with an additional cost element).
Google Cloud Functions
Google Cloud Functions is Google’s serverless solution for creating event-driven applications.
With Google Cloud Functions, you can create, manage, and deploy Cloud Functions via the Cloud SDK (Gcloud), Cloud Console web interface, and both REST and gRPC APIs, and build and test your functions using a standard Node.js runtime along with your favorite development tools.
Cloud Functions can be deployed from your local machine or from a source repository like GitHub or Bitbucket.
Pricing
Google cloud functions pricing is based on the number of requests to your functions and compute resources consumption, rounded to the nearest 100 milliseconds, and of course, only while your code is running.
The free tier includes 400,000 GB-seconds, and 200,000 GHz-seconds of compute time.
Advantages of Google Cloud Functions include an excellent free offering to get started ($300 free credit during the first year, and 5GB of storage free to use forever after that), easy integration with other Google Cloud Services like Kubernetes Engine, App Engine or Compute Engine; and detailed and well-managed documentation.
Criticisms of Google’s offering have included high support fees, a confusing interface, and higher (and more complex) pricing.
Serverless Simplicity
Going serverless has a number of advantages, including reduced complexity, lowering administrative overhead, cutting server costs, reduced time to market, quicker software releases, and developers not having to focus on server maintenance, among others. For some, it’s a no-brainer.
When it comes to which solution to go with, particularly when it comes to AWS Lambda, Azure Functions, and Google Cloud Functions, the answer is less obvious.
Each has its own advantages and quirks, and each one will try and tie you into its ecosystem. Overall, it seems that Google is lagging behind from a features perspective and that while Azure is offering a solid solution, AWS Lambda, the oldest on the block, offers a more complete product.
The choice is yours, as we look forward to many more exciting developments in this space.
This week, the world stopped for a few hours as Google users experienced an outage on a massive scale. The outage affected ALL services which require Google account authentication. This includes the Google Cloud Platform (Cloud Console, Cloud Storage, BigQuery, etc.), Google Workspace (Gmail, Calendar, Docs, Drive, etc.) and Google Classroom.
With the myriad of affected platforms, this particular outage was far from passing by unnoticed by users. In fact, it was reported by users even before being reported on Google’s Cloud Status Dashboard. The Wall Street Journal even reported it as the modern “snow day” with schools being cancelled for the day as many students are learning remotely.
This isn’t the first time software we rely on has fallen (and it certainly won’t be the last), so let’s quickly review what lessons we can all learn from this most recent Google outage.
Google’s Post Mortem on the Incident
We’ll start with Google’s incident report which is, in a word, lacking. There aren’t enough details there to really understand all of the steps that lead to this issue, and the information that is included is questionable at best.
When was the incident reported?
First, there are inconsistencies surrounding when the incident occurred. In the Preliminary Incident Statement, the incident is reported as starting at 03:45 PST, lasting 50 minutes, and ending at 04:35 PST. But the summary of the incident lists the start time as 04:07 PST and end time at 06:23 PST, putting the total incident time at 2 hours and 16 minutes.
On top of that, the first entry in the report was added only at 05:34:
Google Cloud services are experiencing issues and we have an other update at 5:30 PST
And the following entry at 06:23 claimed “as of 04:32 PST the affected system was restored and all services recovered shortly afterwards.”
That means that, according to Google’s timeline, the incident was reported 2 hours after it began, they had already resolved it, and somehow they still didn’t have the information about what happened.
What does this mean?
This raises a ton of questions regarding Google’s incidence response. First, what’s causing these inconsistencies? Is the incident response and reporting manual? Was the initial incident time altered to avoid exceeding a one-hour SLA? Also, as a side note, are the grammatical issues in the original statement due to the pressure faced by whoever was updating the report?
At 12:17 PST (8 and a half hours after the incident reportedly began), the Preliminary Incident Statement was published including the following information:
The root cause was an issue in our automated quota management system which reduced capacity for Google’s central identity management system, causing it to return errors globally.
It may be unreasonable to expect a corporation as big and powerful as Google to provide transparency into their error resolution process, but we should all take notice and try to learn from this as much as possible.
Lessons Learned From the Latest Google Outage
1. We can’t afford prolonged system outages
This first lesson is more of a warning which emphasizes the importance of the following lessons. Back in 2013, Venture Beat reported that a 5-minute outage cost Google more than half a million dollars in revenue. Similar to this most recent outage, all of Google’s services were affected including YouTube, Drive, and Gmail.
In the past 7 years, Google’s quarterly reported revenue has increased by 326% (from $14.1 billion in Q2 2013 to $46.02 billion in Q3 2020). The amount of money lost per minute of downtime has increased proportionately, meaning that this most recent outage could have cost Google as much as $47 million conservatively ($350,000 per minute).
The bottom line is that we need to do everything we can to avoid persistent outages. If Google had been able to resolve this issue in 5 minutes, their revenue loss would have been less than $2 million.
2. We all need automated, meaningful issue alerting
We don’t know what happened behind the scenes at Google during this latest outage. What we do know is that we need to know about any critical errors in our systems before our customers do.
Part of this comes with automated alerting, but that’s not enough on its own. Our alerting should be dynamic and optimized to reduce noise as much as possible. If our alerts contain too many false positives (i.e. if our teams are being constantly bombarded by meaningless noise), real issues are likely to slip through the cracks.
3. We need better insights from our system data
Google listed the root cause in this incident as a problem with their automated quota management system. Even without a deeper understanding of how the system works, I’m sure we can all still identify with the issue of exceeded data quotas.
We can all do better when it comes to understanding and handling our system data.
Log data, for example, is most commonly used for identifying and resolving system or application errors, but most of the tools for managing and analyzing them don’t provide the insights we need, when we need them.
Unlike other logging solutions, Coralogix is a modern Observability platform that analyzes log data in real-time before it’s indexed. This allows teams to get deeper insights about their application and system health immediately.
Be Our Partner
Complete this form to speak with one of our partner managers.
Thank You
Someone from our team will reach out shortly. Talk to you soon!
 The new standard of observability is here. Discover Olly, the industry’s first