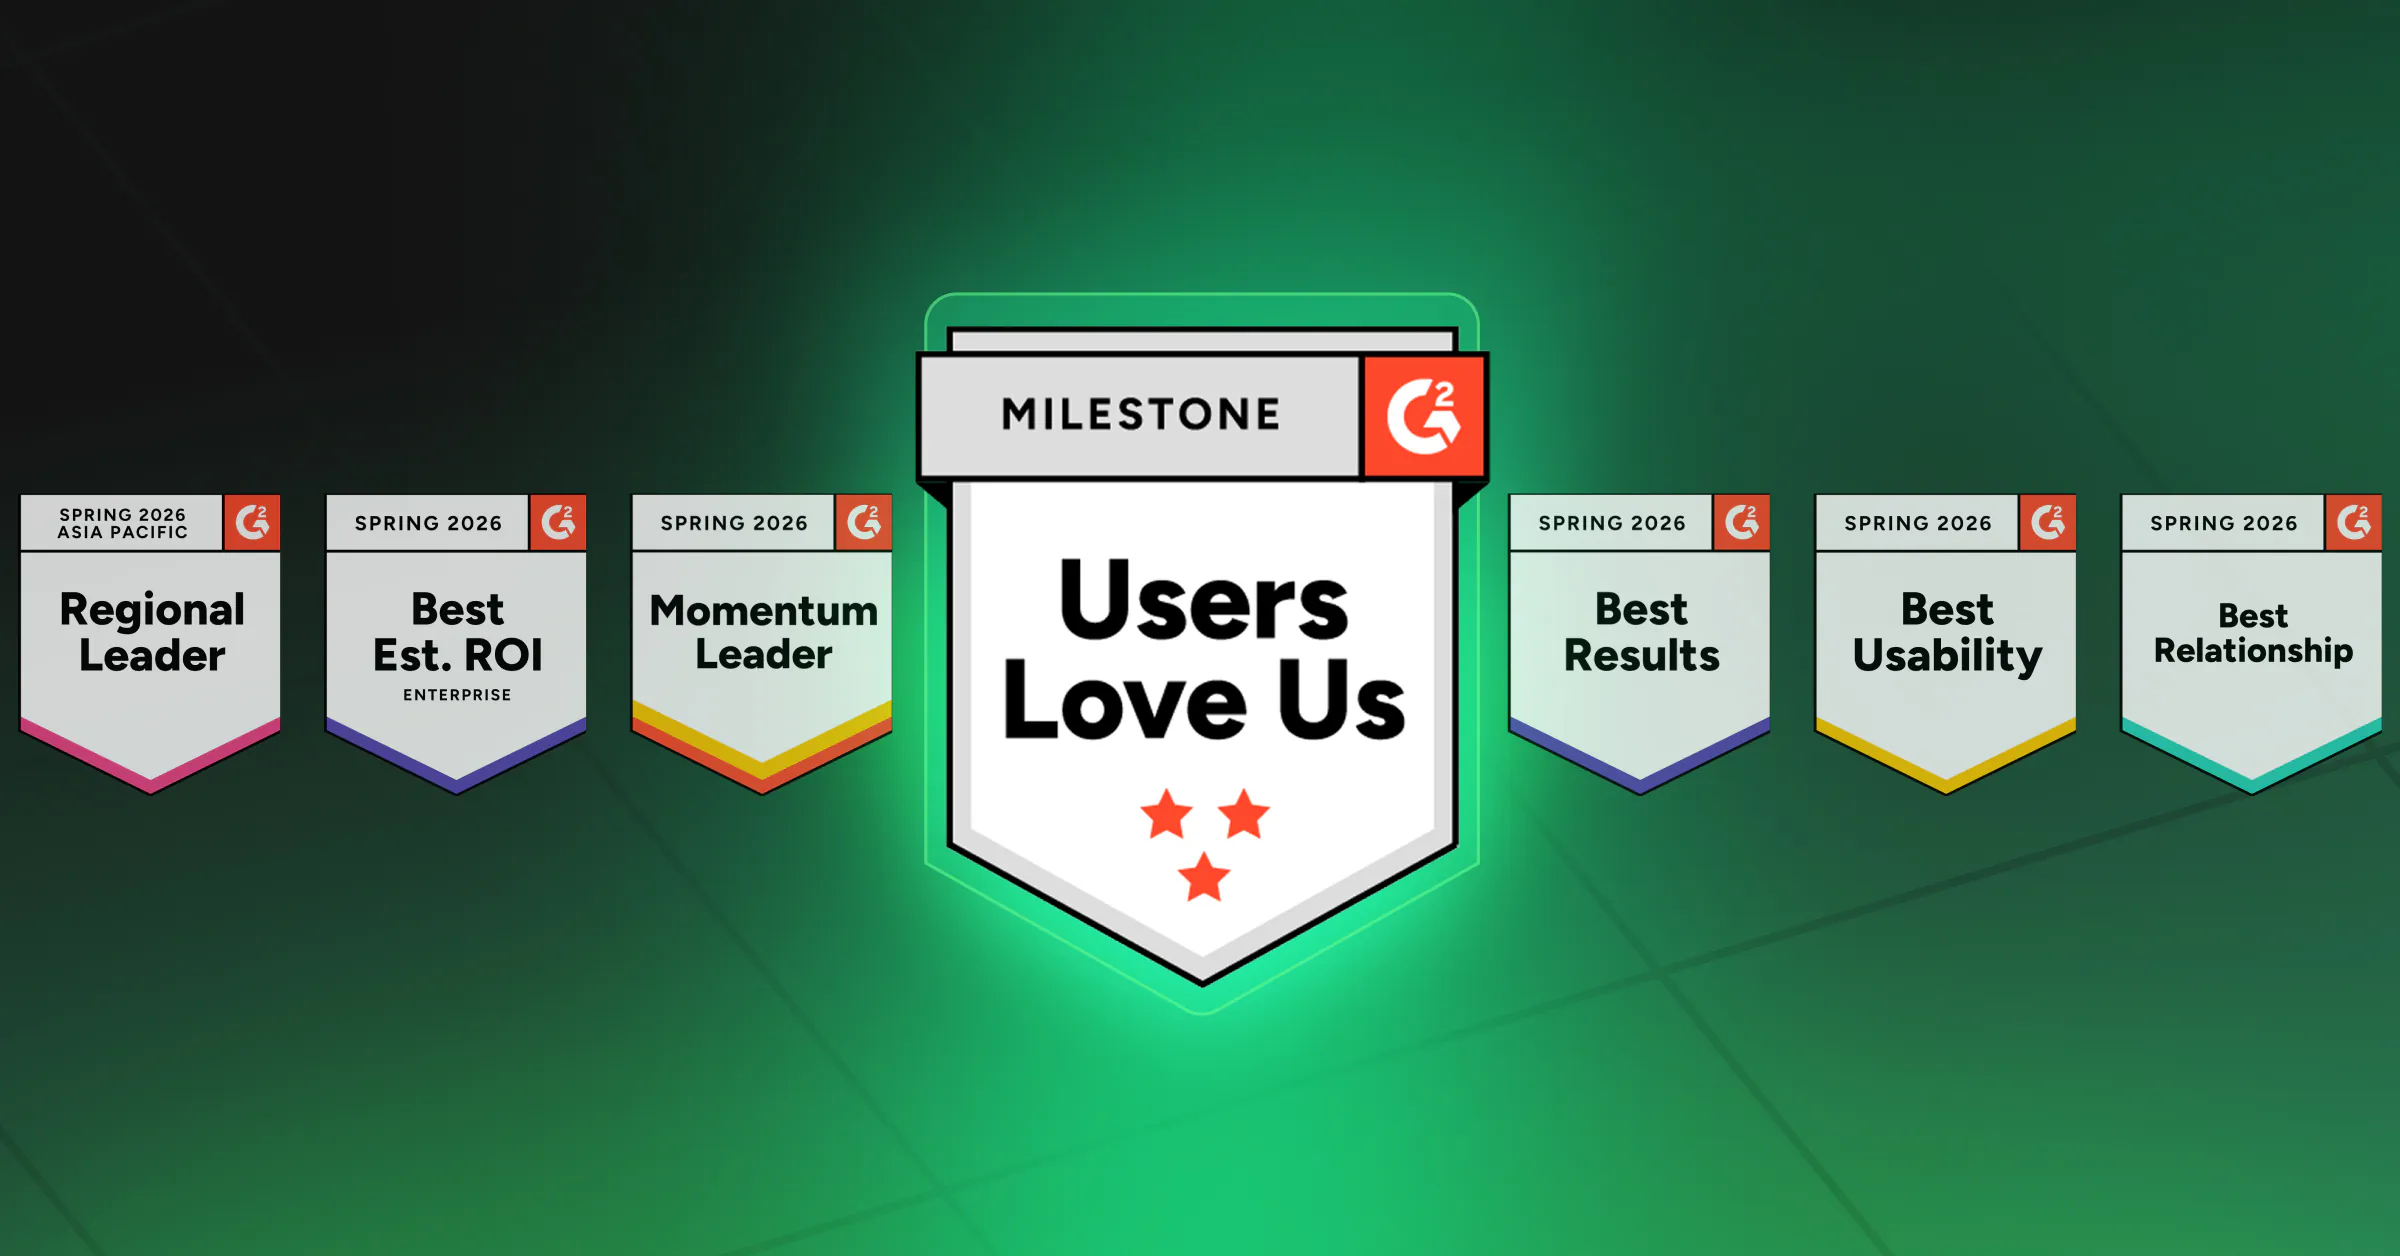
We’re proud to announce that Coralogix has earned 196 badges across 15 categories in the G2 Spring 2026 Reports, our strongest G2 performance to date. Placing in 369 reports, this represents a significant leap from Spring 2025, when we placed in 318 reports and earned 141 badges.
These results are a direct reflection of the trust our customers place in Coralogix and their willingness to share honest feedback on the world’s largest software review platform.
What Are the G2 Awards?
G2 is the world’s largest and most trusted B2B software marketplace, with more than 90 million buyers annually using peer reviews to make smarter purchasing decisions. Every quarter, G2 publishes thousands of reports covering tens of thousands of software products and awards badges only to top performers based on verified user reviews and satisfaction data.
Earning a G2 badge, especially a Leader or Momentum Leader designation, signals that real users consistently rank your product at the top of its category. These aren’t analyst opinions or sponsored rankings. They’re the voice of actual practitioners: engineers, DevOps teams, security analysts, and platform architects who rely on these tools every day.
For buyers evaluating observability and security platforms, G2 badges are a meaningful signal of product quality, customer satisfaction, and market momentum.
Coralogix Spring 2026: 196 Badges, 15 Categories, 369 Reports
Here’s the full breakdown of Coralogix’s Spring 2026 G2 performance:
Category
Badges
Log Analysis
24 – Leader | Momentum Leader
Application Performance Monitoring (APM)
20 – Leader | Momentum Leader
DevOps
20 – Leader
Cloud Infrastructure Monitoring
22 – Leader | Momentum Leader
Container Monitoring
16 – Leader | Momentum Leader
IT Alerting
16 – Leader | Momentum Leader
SIEM
15 – Leader | Momentum Leader
Network Monitoring
15 – Leader | Momentum Leader
Cloud Security Monitoring and Analytics
14 – Momentum Leader
Enterprise Monitoring
11 – Momentum Leader
AIOps Platform
6 – Momentum Leader
Network Traffic Analysis
8 – Momentum Leader
Cloud Security
4 – Leader Badge
Observability Software
4 – Leader | Momentum Leader
System Security
1 – Leader Badge
Total
196
Compared to Spring 2025, where Coralogix earned 141 badges across 318 reports, this represents a 39% increase in badges and a 16% increase in report placements year-over-year.
What This Means Across Our Core Categories
Log Analysis: 24 Badges
Log Analysis remains one of Coralogix’s strongest categories on G2. Our log analytics platform continues to earn recognition for its speed, flexibility, and the unique way we handle data across hot, warm, and frozen storage tiers, giving teams infinite retention without infinite cost, with data stored in their own cloud object storage. Coralogix has consistently been recognized as a G2 Momentum Leader in this space, ranking above Datadog, Splunk, New Relic, and Sumo Logic.
Application Performance Monitoring: 20 Badges
With 20 badges in APM, Coralogix continues to gain recognition as a leading alternative to legacy APM tools. Our APM capabilities, including distributed tracing, service maps, continuous profiling, and SLO management, provide full-stack visibility without the cost overhead of per-host or per-trace pricing.
Cloud Infrastructure Monitoring: 22 Badges
Cloud Infra Monitoring is one of our highest badge-count categories this season. Our infrastructure monitoring gives teams real-time visibility into cloud-native environments, including AWS, Azure, and GCP, all within a unified observability experience.
DevOps: 20 Badges
Coralogix’s strong showing in the DevOps category reflects our deep integrations with CI/CD pipelines, Kubernetes environments, and developer-first workflows. Engineers choose Coralogix because it fits into how modern teams actually work, not the other way around.
SIEM: 15 Badges
Security teams are increasingly turning to Coralogix for SIEM capabilities. Our cloud-native SIEM combines high-volume log ingestion with AI-powered security analysis and anomaly detection, helping security operations teams cut through noise and respond faster.
Cloud Security Monitoring and Analytics: 14 Badges
With 14 badges in Cloud Security Monitoring and Analytics, Coralogix is earning recognition as a platform that serves both observability and security use cases without requiring separate tools or data silos.
Container Monitoring: 16 Badges
Container and Kubernetes environments generate enormous volumes of telemetry data. Coralogix’s Kubernetes monitoring solution earns high marks for its ability to ingest and analyze that data efficiently, at scale, with meaningful cost controls.
IT Alerting: 16 Badges
Coralogix’s alerting and case management capabilities help teams cut through alert fatigue. Users consistently highlight the accuracy and configurability of our alerting engine as a differentiator.
AIOps Platform: 6 Badges
As AI-driven operations become the new standard, Coralogix is building capabilities that help teams use AI to detect anomalies, correlate signals, and automate responses, reducing MTTR.
Why Customers Choose Coralogix
G2 badges are earned through reviews, and those reviews consistently highlight a few key themes:
Cost-efficiency at scale. Coralogix’s unique data pipeline model, which processes and enriches data before indexing, helps teams dramatically reduce storage and query costs without sacrificing observability depth. We consistently outperform competitors on G2’s Satisfaction scoring.
Unified platform. Rather than stitching together separate tools for logs, metrics, traces, and security, Coralogix delivers all of these from a single platform. Users don’t have to context-switch between systems or reconcile data from different sources.
Outstanding support. Across categories, our G2 reviews cite Coralogix’s customer support team as a standout differentiator: responsive, knowledgeable, and genuinely invested in customer outcomes.
Innovation velocity. From the DataPrime query engine to AI observability and our Autonomous Observability Agent, Olly, Coralogix continues to invest heavily in capabilities that keep pace with how modern engineering and security teams operate.
A Note of Thanks to Our Customers
Every badge Coralogix earns on G2 starts with a customer taking time to share their honest experience. Real reviews with genuine feedback from practitioners who use Coralogix in production, every day.
To everyone who has reviewed Coralogix on G2: thank you. Your feedback shapes our roadmap, validates our direction, and helps other teams find a platform they can trust.
We earned the G2 “Users Love Us” badge again this season, a recognition reserved for vendors with consistently high satisfaction scores, and it means more to us than any analyst ranking.
See What Our Customers Are Saying
If you’re evaluating observability or security platforms, we encourage you to read our G2 reviews directly from the engineers and security teams who use Coralogix in production.
Python is a highly skilled language with a large developer community, which is essential in data science, machine learning, embedded applications, and back-end web and cloud applications.
And logging is critical to understanding software behavior in Python. Once logs are in place, log monitoring can be utilized to make sense of what is happening in the software. Python includes several logging libraries that create and direct logs to their assigned targets.
This article will go over Python logging best practices to help you get the best log monitoring setup for your organization.
What is Python logging?
Logging in Python, like other programming languages, is implemented to indicate events that have occurred in software. Logs should include descriptive messages and variable data to communicate the state of the software at the time of logging.
They also communicate the severity of the event using unique log levels. Logs can be generated using the Python standard library.
Python logging module
The Python standard library provides a logging module to log events from applications and libraries. Once the Python JSON logger is configured, it becomes part of the Python interpreter process that is running the code.
In other words, Python logging is global. You can also configure the Python logging subsystem using an external configuration file. The specifications for the logging configuration format are found in the Python standard library documentation.
The logging library is modular and offers four categories of components:
Loggers expose the interface used by the application code.
Handlers are created by loggers and send log records to the appropriate destination.
Filters can determine which log records are output.
Formatters specify the layout of the final log record output.
Multiple logger objects are organized into a tree representing various parts of your system and the different third-party libraries you have installed. When you send a message to one of the loggers, the message gets output on that logger’s handlers using a formatter attached to each handler.
The message then propagates the logger tree until it hits the root logger or a logger in the tree configured with .propagate=False. This hierarchy allows logs to be captured up the subtree of loggers, and a single handler could catch all logging messages.
Python loggers
The logging.Logger objects offer the primary interface to the logging library. These objects provide the logging methods to issue log requests along with the methods to query and modify their state. From here on out, we will refer to Logger objects as loggers.
Creating a new logger
The factory function logging.getLogger(name) is typically used to create loggers. By using the factory function, clients can rely on the library to manage loggers and access loggers via their names instead of storing and passing references to loggers.
The name argument in the factory function is typically a dot-separated hierarchical name, i.e. a.b.c. This naming convention enables the library to maintain a hierarchy of loggers. Specifically, when the factory function creates a logger, the library ensures a logger exists for each level of the hierarchy specified by the name, and every logger in the hierarchy is linked to its parent and child loggers.
Threshold logging level
Each logger has a threshold logging level to determine whether a log request should be processed. A logger processes a log request if the numeric value of the requested logging level is greater than or equal to the severity of the logger’s threshold logging level.
Clients can retrieve and change the threshold logging level of a logger via Logger.getEffectiveLevel() and Logger.setLevel(level) methods, respectively. When the factory function is used to create a logger, the function sets a logger’s threshold logging level to the threshold logging level of its parent logger as determined by its name.
Log levels
Log levels allow you to define event severity for each log so they are easily analyzed. Python supports predefined values, which can be found by calling logging.getLevelName(). Predefined log levels include CRITICAL, ERROR, WARNING, INFO, and DEBUG from highest to lowest severity. Developers can also maintain a dictionary of log levels by defining custom levels using logging.getLogger().
Python comes with different methods to read events from the software: print() and logging. Both will communicate event data but pass this information to different storage locations using different methods.
The print function sends data exclusively to the console. This can be convenient for fast testing as a function is developed, but it is not practical for use in functional software. There are two critical reasons to not use print() in software:
If your code is used by other tools or scripts, the user will not know the context of the print messages.
When running Python software in containers like Docker, the print messages will not be seen since containers cannot access the console.
The logging library also provides many features contributing to Python logging best practices. These include identifying the line of the file, function, and time of log events, distinguishing log events by their importance, and providing formatting to keep log messages consistent.
Python logging examples
Here are a few code snippets to illustrate how to use the Python logging library.
Snippet 1: Creating a logger with a handler and a formatter
# main.py
import logging, sys

def _init_logger():    #Create a logger named 'app'
    logger = logging.getLogger('app')
    #Set the threshold logging level of the logger to INFO
    logger.setLevel(logging.INFO)
    #Create a stream-based handler that writes the log entries    #into the standard output stream
    handler = logging.StreamHandler(sys.stdout)
    #Create a formatter for the logs
    formatter = logging.Formatter(       '%(created)f:%(levelname)s:%(name)s:%(module)s:%(message)s')
        #Set the created formatter as the formatter of the handler    handler.setFormatter(formatter)
    #Add the created handler to this logger
    logger.addHandler(handler)

_init_logger()
_logger = logging.getLogger('app')
In snippet 1, a logger is created with a log level of INFO. Any logs that have a severity less than INFO will not print (i.e. DEBUG logs). A new handler is created and assigned to the logger. New handlers can be added to send logging outputs to streams like sys.stdout or any file-like object.
A formatter is created and added to the handler to transform log messages into placeholder data. In this formatter, the time of the log request (as an epoch timestamp), the logging level, the logger’s name, the module name, and the log message will all print.
Snippet 2: Issuing log requests
# main.py
_logger.info('App started in %s', os.getcwd())
In snippet 2, an info log states the app has started. When the app is started in the folder /home/kali with the logger created in snippet 1, the following log entry will be generated in the std.out stream:
1586147623.484407:INFO:app:main:App started in /home/kali/
Snippet 3: Issuing log requests with positional arguments
# app/io.py
import logging

def _init_logger():
    logger = logging.getLogger('app.io')
    logger.setLevel(logging.INFO)

_init_logger()
_logger = logging.getLogger('app.io')

def write_data(file_name, data):
    try:
        # write data
        _logger.info('Successfully wrote %d bytes into %s', len(data), file_name)
    except FileNotFoundError:
        _logger.exception('Failed to write data into %s', file_name)
This snippet logs an informational message every time data is written successfully via write_data. If a write fails, the snippet logs an error message that includes the stack trace in which the exception occurred. The logs here use positional arguments to enhance the value of the logs and provide more contextual information.
With the logger created using snippet 1, successful execution of write_data would create a log similar to:
1586149091.005398:INFO:app.io:io:Successfully wrote 134 bytes into /tmp/tmp_data.txt
If the execution fails, then the created log will appear like:
1586149219.893821:ERROR:app:io:Failed to write data into /tmp1/tmp_data.txt
Traceback (most recent call last):
File “/home/kali/program/app/io.py”, line 12, in write_data
print(open(file_name), data)
FileNotFoundError: [Errno 2] No such file or directory: ‘/tmp1/tmp_data.txt’
Alternatively to positional arguments, the same outputs could be achieved using complete names as in:
_logger.info('Successfully wrote %(data_size)s bytes into %(file_name)s',
    {'data_size': len(data), 'file_name': file_name})
Types of Python logging methods
Every logger offers a shorthand method to log requests by level. Each pre-defined log level is available in shorthand; for example, Logger.error(msg, *args, **kwargs).
In addition to these shorthand methods, loggers also offer a general method to specify the log level in the arguments. This method is useful when using custom logging levels.
Logger.log(level, msg, *args, **kwargs)
Another useful method is used for logs inside exception handlers. It issues log requests with the logging level ERROR and captures the current exception as part of the log entry.
Logger.exception(msg, *args, **kwargs)
In each of the methods above, the msg and args arguments are combined to create log messages captured by log entries. They each support the keyword argument exc_info to add exception information to log entries and stack_info and stacklevel to add call stack information to log entries. Also, they support the keyword argument extra, which is a dictionary, to pass values relevant to filters, handlers, and formatters.
How to get started with Python logging
To get the most out of your Python logging, they need to be set up consistently and ready to analyze. When setting up your Python logging, use these best practices below.
Create loggers using .getlogger
The logging.getLogger() factory function helps the library manage the mapping from logger names to logger instances and maintain a hierarchy of loggers. In turn, this mapping and hierarchy offer the following benefits:
Clients can use the factory function to access the same logger in different application parts by merely retrieving the logger by its name.
Only a finite number of loggers are created at runtime (under normal circumstances).
Log requests can be propagated up the logger hierarchy.
When unspecified, the threshold logging level of a logger can be inferred from its ascendants.
The configuration of the logging library can be updated at runtime by merely relying on the logger names.
Use pre-defined logging levels
Use the shorthand logging.<logging level>() method to log at pre-defined logging levels. Besides making the code a bit shorter, the use of these functions helps partition the logging statements into two sets:
Those that issue log requests with pre-defined logging levels.
Those that issue log requests with custom logging levels.
The pre-defined logging levels capture almost all logging scenarios that occur. Most developers are universally familiar with these logging levels across different programming languages, making them easy to understand. The use of these values reduces deployment, configuration, and maintenance burdens.
Create module-level loggers
While creating loggers, we can create a logger for each class or create a logger for each module. While the first option enables fine-grained configuration, it leads to more loggers in a program, i.e., one per class. In contrast, the second option can help reduce the number of loggers in a program. So, unless such fine-grained configuration is necessary, create module-level loggers.
Use .LoggerAdapter to inject local contextual information
Use logging.LoggerAdapter() to inject contextual information into log records. The class can also modify the log message and data provided as part of the request. Since the logging library does not manage these adapters, they cannot be accessed with common names. Use them to inject contextual information local to a module or class.
Use filters or .setLogRecordFactor() to inject global contextual information
Two options exist to seamlessly inject global contextual information (common across an app) into log records. The first option is to use the filter support to modify the log record arguments provided to filters. For example, the following filter injects version information into incoming log records.
There are two downsides to this option. First, if filters depend on the data in log records, then filters that inject data into log records should be executed before filters that use the injected data. Thus, the order of filters added to loggers and handlers becomes crucial. Second, the option “abuses” the support to filter log records to extend log records.
The second option is to initialize the logging library with a log record creating a factory function via logging.setLogRecordFactory(). Since the injected contextual information is global, it can be injected into log records when created in the factory function. This ensures the data will be available to every filter, formatter, logger, and handler in the program.
The downside of this option is that we have to ensure factory functions contributed by different components in a program play nicely with each other. While log record factory functions could be chained, such chaining increases the complexity of programs.
Use .disable() to inhibit processing of low-level requests
A logger will process a log request based on the effective logging level. The effective logging level is the higher of two logging levels: the logger’s threshold level and the library-wide level. Set the library-wide logging level using the logging.disable(level) function. This is set to 0 by default so that every log request will be processed.
Using this function, the software will throttle the logging output of an app by increasing the logging level across the whole app. This can be important to keep log volumes in check in production software.
Advantages and disadvantages of python logging
Python’s logging library is more complicated than simple print() statements. The library has many great features that provide a complete solution for obtaining log data needed to achieve full-stack observability in your software.
Here we show the high-level advantages and disadvantages of the library.
Configurable logging
The Python logging library is highly configurable. Logs can be formatted before printing, can have placeholder data filled in automatically, and can be turned on and off as needed. Logs can also be sent to a number of different locations for easier reading and debugging. All of these settings are codified, so are well-defined for each logger.
Save Tracebacks
In failures, it is useful to log debugging information showing where and when a failure occurred. These tracebacks can be generated automatically in the Python logging library to help speed up troubleshooting and fixes.
Difficulty using consistent logging levels
Log levels used in different scenarios can be subjective across a development team. For proper analysis, it is important to keep log levels consistent. Create a well-defined strategy for your team about when to use each logging level available and when a custom level is appropriate.
Design of multiple loggers
Since the logging module is so flexible, logging configurations can quickly get complicated. Create a strategy for your team for how each logging module will be defined to keep logs consistent across developers.
Python logging platforms
Let’s look at an example of a basic logger in Python:
Line 2: create a basicConf function and pass some arguments to create the log file. In this case, we indicate the severity level, date format, filename and file mode to have the function overwrite the log file.
Line 3 to 5: messages for each logging level.
The default format for log records is SEVERITY: LOGGER: MESSAGE. Hence, if you run the code above as is, you’ll get this output:
Regarding the output, you can set the destination of the log messages. As a first step, you can print messages to the screen using this sample code:
import logging
logging.basicConfig(level=logging.DEBUG, format='%(asctime)s - %(levelname)s - %(message)s')
logging.debug('This is a log message.')
If your goals are aimed at the Cloud, you can take advantage of Python’s set of logging handlers to redirect content. Currently in beta release, you can write logs to Stackdriver Logging from Python applications by using Google’s Python logging handler included with the Stackdriver Logging client library, or by using the client library to access the API directly. When developing your logger, take into account that the root logger doesn’t use your log handler. Since the Python Client for Stackdriver Logging library also does logging, you may get a recursive loop if the root logger uses yourPython log handler.
Basic Python logging concepts
When we use a logging library, we perform/trigger the following common tasks while using the associated concepts (highlighted in bold).
A client issues a log request by executing a logging statement. Often, such logging statements invoke a function/method in the logging (library) API by providing the log data and the logging level as arguments. The logging level specifies the importance of the log request. Log data is often a log message, which is a string, along with some extra data to be logged. Often, the logging API is exposed via logger objects.
To enable the processing of a request as it threads through the logging library, the logging library creates a log record that represents the log request and captures the corresponding log data.
Based on how the logging library is configured (via a logging configuration), the logging library filters the log requests/records. This filtering involves comparing the requested logging level to the threshold logging level and passing the log records through user-provided filters.
Handlers process the filtered log records to either store the log data (e.g., write the log data into a file) or perform other actions involving the log data (e.g., send an email with the log data). In some logging libraries, before processing log records, a handler may again filter the log records based on the handler’s logging level and user-provided handler-specific filters. Also, when needed, handlers often rely on user-provided formatters to format log records into strings, i.e., log entries.
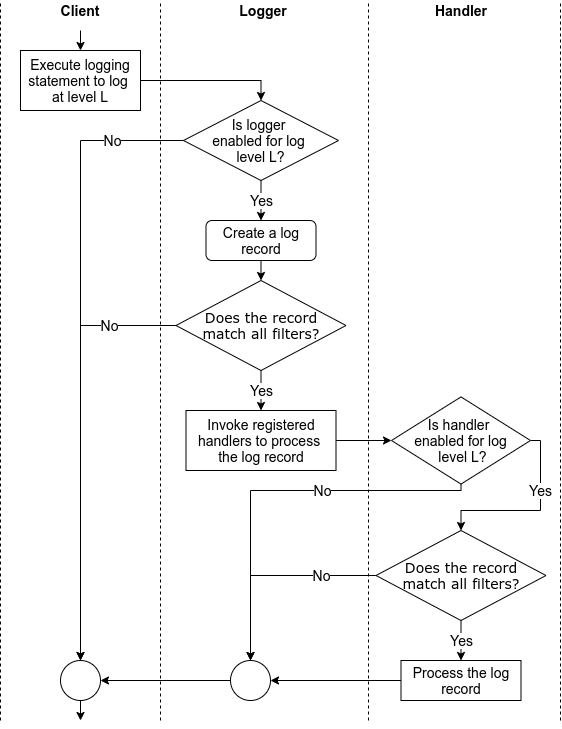
Independent of the logging library, the above tasks are performed in an order similar to that shown in Figure 1.
Figure 1: The flow of tasks when logging via a logging library
Python logging methods
Every logger offers the following logging methods to issue log requests.
Each of these methods is a shorthand to issue log requests with corresponding pre-defined logging levels as the requested logging level.
In addition to the above methods, loggers also offer the following two methods:
Logger.log(level, msg, *args, **kwargs) issues log requests with explicitly specified logging levels. This method is useful when using custom logging levels.
Logger.exception(msg, *args, **kwargs) issues log requests with the logging level ERROR and that capture the current exception as part of the log entries. Consequently, clients should invoke this method only from an exception handler.
msg and args arguments in the above methods are combined to create log messages captured by log entries. All of the above methods support the keyword argument exc_info to add exception information to log entries and stack_info and stacklevel to add call stack information to log entries. Also, they support the keyword argument extra, which is a dictionary, to pass values relevant to filters, handlers, and formatters.
When executed, the above methods perform/trigger all of the tasks shown in Figure 1 and the following two tasks:
After deciding to process a log request based on its logging level and the threshold logging level, the logger creates a LogRecord object to represent the log request in the downstream processing of the request. LogRecord objects capture the msg and args arguments of logging methods and the exception and call stack information along with source code information. They also capture the keys and values in the extra argument of the logging method as fields.
After every handler of a logger has processed a log request, the handlers of its ancestor loggers process the request (in the order they are encountered walking up the logger hierarchy). The Logger.propagate field controls this aspect, which is True by default.
Beyond logging levels, filters provide a finer means to filter log requests based on the information in a log record, e.g., ignore log requests issued in a specific class. Clients can add and remove filters to/from loggers using Logger.addFilter(filter) and Logger.removeFilter(filter) methods, respectively.
Python logging configuration
The logging classes introduced in the previous section provide methods to configure their instances and, consequently, customize the use of the logging library. Snippet 1 demonstrates how to use configuration methods. These methods are best used in simple single-file programs.
When involved programs (e.g., apps, libraries) use the logging library, a better option is to externalize the configuration of the logging library. Such externalization allows users to customize certain facets of logging in a program (e.g., specify the location of log files, use custom loggers/handlers/formatters/filters) and, hence, ease the deployment and use of the program. We refer to this approach to configuration as data-based approach.
Configuring the library
Clients can configure the logging library by invoking logging.config.dictConfig(config: Dict) function. The config argument is a dictionary and the following optional keys can be used to specify a configuration.
filters key maps to a dictionary of strings and dictionaries. The strings serve as filter ids used to refer to filters in the configuration (e.g., adding a filter to a logger) while the mapped dictionaries serve as filter configurations. The string value of the name key in filter configurations is used to construct logging.Filter instances.
"filters": {
  "io_filter": {
    "name": "app.io"
  }
}
This configuration snippet results in the creation of a filter that admits all records created by the logger named ‘app.io’ or its descendants.
formatters key maps to a dictionary of strings and dictionaries. The strings serve as formatter ids used to refer to formatters in the configuration (e.g., adding a formatter to a handler) while the mapped dictionaries serve as formatter configurations. The string values of the datefmt and format keys in formatter configurations are used as the date and log entry formatting strings, respectively, to construct logging.Formatter instances. The boolean value of the (optional) validate key controls the validation of the format strings during the construction of a formatter.
This configuration snippet results in the creation of two formatters. A simple formatter with the specified log entry and date formatting strings and detailed formatter with specified log entry formatting string and default date formatting string.
handlers key maps to a dictionary of strings and dictionaries. The strings serve as handler ids used to refer to handlers in the configuration (e.g., adding a handler to a logger) while the mapped dictionaries serve as handler configurations. The string value of the class key in a handler configuration names the class to instantiate to construct a handler. The string value of the (optional) level key specifies the logging level of the instantiated handler. The string value of the (optional) formatter key specifies the id of the formatter of the handler. Likewise, the list of values of the (optional) filters key specifies the ids of the filters of the handler. The remaining keys are passed as keyword arguments to the handler’s constructor.
This configuration snippet results in the creation of two handlers:
A stderr handler that formats log requests with INFO and higher logging level log via the simple formatter and emits the resulting log entry into the standard error stream. The stream key is passed as keyword arguments to logging.StreamHandler constructor. The value of the stream key illustrates how to access objects external to the configuration. The ext:// prefixed string refers to the object that is accessible when the string without the ext:// prefix (i.e., sys.stderr) is processed via the normal importing mechanism. Refer to Access to external objects for more details. Refer to Access to internal objects for details about a similar mechanism based on cfg:// prefix to refer to objects internal to a configuration.
An alert handler that formats ERROR and CRITICAL log requests via the detailed formatter and emails the resulting log entry to the given email addresses. The keys mailhost, formaddr, toaddrs, and subject are passed as keyword arguments to logging.handlers.SMTPHandler’s constructor.
loggers key maps to a dictionary of strings that serve as logger names and dictionaries that serve as logger configurations. The string value of the (optional) level key specifies the logging level of the logger. The boolean value of the (optional) propagate key specifies the propagation setting of the logger. The list of values of the (optional) filters key specifies the ids of the filters of the logger. Likewise, the list of values of the (optional) handlers key specifies the ids of the handlers of the logger.
This configuration snippet results in the creation of two loggers. The first logger is named app, its threshold logging level is set to WARNING, and it is configured to forward log requests to stderr and alert handlers. The second logger is named app.io, and its threshold logging level is set to INFO. Since a log request is propagated to the handlers associated with every ascendant logger, every log request with INFO or a higher logging level made via the app.io logger will be propagated to and handled by both stderr and alert handlers.
root key maps to a dictionary of configuration for the root logger. The format of the mapped dictionary is the same as the mapped dictionary for a logger.
incremental key maps to either True or False (default). If True, then only logging levels and propagate options of loggers, handlers, and root loggers are processed, and all other bits of the configuration is ignored. This key is useful to alter existing logging configuration. Refer to Incremental Configuration for more details.
disable_existing_loggers key maps to either True (default) or False. If False, then all existing non-root loggers are disabled as a result of processing this configuration.
Also, the config argument should map the version key to 1.
Here’s the complete configuration composed of the above snippets.
The configuration schema for filters supports a pattern to specify a factory function to create a filter. In this pattern, a filter configuration maps the () key to the fully qualified name of a filter creating factory function along with a set of keys and values to be passed as keyword arguments to the factory function. In addition, attributes and values can be added to custom filters by mapping the . key to a dictionary of attribute names and values.
For example, the below configuration will cause the invocation of app.logging.customFilterFactory(startTime='6PM', endTime='6AM') to create a custom filter and the addition of local attribute with the value True to this filter.
Configuration schemas for formatters, handlers, and loggers also support the above pattern. In the case of handlers/loggers, if this pattern and the class key occur in the configuration dictionary, then this pattern is used to create handlers/loggers. Refer to User-defined Objects for more details.
Configuring using Configparse-Format Files
The logging library also supports loading configuration from a configparser-format file via the <a href="https://docs.python.org/3/library/logging.config.html#logging.config.fileConfig" target="_blank" rel="noopener noreferrer">logging.config.fileConfig() function. Since this is an older API that does not provide all of the functionalities offered by the dictionary-based configuration scheme, the use of the dictConfig() function is recommended; hence, we’re not discussing the fileConfig() function and the configparser file format in this tutorial.
Configuring over the wire
While the above APIs can be used to update the logging configuration when the client is running (e.g., web services), programming such update mechanisms from scratch can be cumbersome. The logging.config.listen() function alleviates this issue. This function starts a socket server that accepts new configurations over the wire and loads them via dictConfig() or fileConfig() functions. Refer to logging.config.listen() for more details.
Loading and storing configuration
Since the configuration provided to dictConfig() is nothing but a collection of nested dictionaries, a logging configuration can be easily represented in JSON and YAML format. Consequently, programs can use the json module in Python’s standard library or external YAML processing libraries to read and write logging configurations from files.
For example, the following snippet suffices to load the logging configuration stored in JSON format.
import json, logging.config

with open('logging-config.json', 'rt') as f:
  config = json.load(f)
  logging.config.dictConfig(config)
Limitations
In the supported configuration scheme, we cannot configure filters to filter beyond simple name-based filtering. For example, we cannot create a filter that admits only log requests created between 6 PM and 6 AM. We need to program such filters in Python and add them to loggers and handlers via factory functions or the addFilter() method.
Python logging performance
While logging statements help capture information at locations in a program, they contribute to the cost of the program in terms of execution time (logging statements in loops) and storage (logging lots of data). Although cost-free yet useful logging is impossible, we can reduce the cost of logging by making choices that are informed by performance considerations.
Configuration-based considerations
After adding logging statements to a program, we can use the support to configure logging (described earlier) to control the execution of logging statements and the associated execution time. In particular, consider the following configuration capabilities when making decisions about logging-related performance.
Change logging levels of loggers: This change helps suppress log messages below a certain log level. This helps reduce the execution cost associated with unnecessary creation of log records.
Change handlers: This change helps replace slower handlers with faster handlers (e.g., during testing, use a transient handler instead of a persistent handler) and even remove context-irrelevant handlers. This reduces the execution cost associated with unnecessary handling of log records.
Change format: This change helps exclude unnecessary parts of a log record from the log (e.g., exclude IP addresses when executing in a single node setting). This reduces the execution cost associated with unnecessary handling of parts of log records.
The above changes the range over coarser to finer aspects of logging support in Python.
Code-based considerations
While the support to configure logging is powerful, it cannot help control the performance impact of implementation choices baked into the source code. Here are a few such logging-related implementation choices and the reasons why you should consider them when making decisions about logging-related performance.
Do not execute inactive logging statements
Upon adding the logging module to Python’s standard library, there were concerns about the execution cost associated with inactive logging statements — logging statements that issue log requests with logging level lower than the threshold logging level of the target logger. For example, how much extra time will a logging statement that invokes logger.debug(...) add to a program’s execution time when the threshold logging level of logger is logging.WARN? This concern led to client-side coding patterns (as shown below) that used the threshold logging level of the target logger to control the execution of the logging statement.
# client code
...
if logger.isEnabledFor(logging.DEBUG):
    logger.debug(msg)
...
Today, this concern is not valid because the logging methods in the logging.Logger class perform similar checks and process the log requests only if the checks pass. For example, as shown below, the above check is performed in the logging.Logger.debug method.
Consequently, inactive logging statements effectively turn into no-op statements and do not contribute to the execution cost of the program.
Even so, one should consider the following two aspects when adding logging statements.
Each invocation of a logging method incurs a small overhead associated with the invocation of the logging method and the check to determine if the logging request should proceed, e.g., a million invocations of logger.debug(...) when threshold logging level of logger was logging.WARN took half a second on a typical laptop. So, while the cost of an inactive logging statement is trivial, the total execution cost of numerous inactive logging statements can quickly add up to be non-trivial.
While disabling a logging statement inhibits the processing of log requests, it does not inhibit the calculation/creation of arguments to the logging statement. So, if such calculations/creations are expensive, then they can contribute non-trivially to the execution cost of the program even when the corresponding logging statement is inactive.
Do not construct log messages eagerly
Clients can construct log messages in two ways: eagerly and lazily.
The client constructs the log message and passes it on to the logging method, e.g., logger.debug(f'Entering method Foo: {x=}, {y=}'). This approach offers formatting flexibility via f-strings and the format() method, but it involves the eager construction of log messages, i.e., before the logging statements are deemed as active.
The client provides a printf-style message format string (as a msg argument) and the values (as a args argument) to construct the log message to the logging method, e.g., logger.debug('Entering method %s: x=%d, y=%f', 'Foo', x, y). After the logging statement is deemed as active, the logger constructs the log message using the string formatting operator %. This approach relies on an older and quirky string formatting feature of Python but it involves the lazy construction of log messages.
While both approaches result in the same outcome, they exhibit different performance characteristics due to the eagerness and laziness of message construction.
For example, on a typical laptop, a million inactive invocations of logger.debug('Test message {0}'.format(t)) takes 2197ms while a million inactive invocations of logger.debug('Test message %s', t) takes 1111ms when t is a list of four integers. In the case of a million active invocations, the first approach takes 11061ms and the second approach took 10149ms. A savings of 9–50% of the time taken for logging!
So, the second (lazy) approach is more performant than the first (eager) approach in cases of both inactive and active logging statements. Further, the gains would be larger when the message construction is non-trivial, e.g., use of many arguments, conversion of complex arguments to strings.
Do not gather unnecessary under-the-hood information
By default, when a log record is created, the following data is captured in the log record:
Identifier of the current process.
Identifier and name of the current thread.
Name of the current process in the multiprocessing framework.
Filename, line number, function name, and call stack info of the logging statement.
Unless these bits of data are logged, gathering them unnecessarily increases the execution cost. So, if these bits of data will not be logged, then configure the logging framework to not gather them by setting the following flags.
logging.logProcesses = False
logging.logThreads = False
logging.logMultiProcessing = False
logging._srcFile = None
Do not block the main thread of execution
There are situations where we may want to log data in the main thread of execution without spending almost any time logging the data. Such situations are common in web services, e.g., a request processing thread needs to log incoming web requests without significantly increasing its response time. We can tackle these situations by separating concerns across threads: a client/main thread creates a log record while a logging thread logs the record. Since the task of logging is often slower as it involves slower resources (e.g., secondary storage) or other services (e.g., logging services such as Coralogix, pub-sub systems such as Kafka), this separation of concerns helps minimize the effort of logging on the execution time of the main/client thread.
The Python logging library helps handle such situations via the QueueHandler and QueueListener classes as follows.
A pair of QueueHandler and QueueListener instances are initialized with a queue.
When the QueueHandler instance receives a log record from the client, it merely places the log request in its queue while executing in the client’s thread. Given the simplicity of the task performed by the QueueHandler, the client thread hardly pauses.
When a log record is available in the QueueListener queue, the listener retrieves the log record and executes the handlers registered with the listener to handle the log record. In terms of execution, the listener and the registered handlers execute in a dedicated thread that is different from the client thread.
Note: While QueueListener comes with a default threading strategy, developers are not required to use this strategy to use QueueHandler. Instead, developers can use alternative threading strategies that meet their needs.
That about wraps it up for this Python logging guide. If you’re looking for a log management solution to centralize your Python logs, check out our easy-to-configure Python integration.
Whether it’s Apache, Nginx, ILS, or anything else, web servers are at the core of online services, and web log monitoring and analysis can reveal a treasure trove of information. These logs may be hidden away in many files on disk, split by HTTP status code, timestamp, or agent, among other possibilities. Web access log monitoring is typically analyzed to troubleshoot operational issues, but there is so much more insight that you can draw from this data, from SEO to user experience. Let’s explore what you can do when you really dive into web log analysis.
1. Spotting errors and troubleshooting with web log analysis
Right now, online Internet traffic is exceeding 333 Exabytes per month. This has been growing year on year since the founding of the Internet. With this increase in traffic comes the increased complexity of operational observability. Your web access logs are crucial in the fight to maintain operational excellence. While the details vary, some fields you can expect in all of your web logs include:
Latency
Source IP address
HTTP status code
Resource requested
Request and response size in bytes
These fields are fundamental measures in building a clear picture of your operational excellence. You can use these fields to capture abnormal traffic arriving at your site, which may indicate malicious activity like “bad bot” web scraping. You could also detect an outage in your site by looking at a sudden increase in errors in your HTTP status codes.
2. SEO diagnostics with web logs
68% of online activity begins with a user typing something into a search engine. This means that if you’re not harnessing the power of SEO, you’re potentially missing out on a massive volume of potential traffic and customers. Despite this, almost 90% of content online receives no organic traffic from Google. An SEO-optimized site represents a serious edge in the competitive online market. Web access logs can give you an insight into several key SEO dimensions that will provide you with clear measurements for the success of your SEO campaigns.
42.7% of online users are currently using an ad-blocker, which means that you may see serious disparities between the traffic to your site and the impressions you’re seeing on the PPC ads that you host. Your web log analysis can alert you to this disparity very easily by giving you a clear overall view of the traffic you’re receiving because they are taken on the server-side and don’t depend on the client’s machine to track usage.
You can also verify the IP addresses connected to your site to determine whether Googlebot is scraping and indexing your site. This is crucial because it won’t just tell you if Googlebot is present but also which pages it has accessed, using a combination of the URI field and IP address in your web access logs.
3. Site performance and user experience insights from web log analysis
Your web access logs can also give you insight into how your site performs for your user. This is different from the operational challenge of keeping the site functional and more of a marketing challenge to keep the website snappy, which is vital. Users make decisions about your site in the first 50ms, and if all they see is a white loading page, they’re not going to make favorable conclusions.
The bounce rate increases sharply with increased latency. If your page takes 4 seconds to load, you’ve lost 20% of your potential visitors. Worse, those users will view an average of 3.4 fewer pages than they would if the site took 2 seconds to load. Every second makes a difference.
Your web access logs are the authority on your latency because they tell you the duration of the whole HTTP connection. You can then combine these values with more specific measurements, like the latency of a database query or disk I/O latencies. By optimizing for these values, you can ensure that you’re not losing any of your customers to slow latencies.
Your web access logs may also give you access to the User-Agent header. This header can tell you the browser and operating system that initiated the request. This is essential because it will give you an idea of your customers’ devices and browsers. 52.5% of all online traffic comes from smartphones, so you’re likely missing out if you’re not optimizing for mobile usage.
Wrapping up
Web access log analysis is one of the fundamental pillars of observability; however, the true challenge isn’t simply viewing and analyzing the logs, but in getting all of your observability data into one place to correlate them with one another. Your Nginx logs are powerful, but if you combine them with your other logs, metrics, and traces from CDNs, applications, and more, they form part of an observability tapestry that can yield actionable insights across your entire system.
Log file monitoring tools plays a central role in enhancing the observability of your IT estate, helping operations teams and SRE engineers to identify issues as they emerge and track down the cause of failures quickly.
As the number of log entries generated on any given day in a medium-sized business easily numbers in the thousands, viewing and analyzing logs manually to realize these benefits is not a realistic option. This is where automated real-time log analysis comes in.
In this article, we’ll go through the steps involved in conducting log analysis effectively. To find out more about what log analysis can do for your organization, head over to our Introduction to Log Analysis resource guide.
Generating log files
The very first step to implementing log analysis is to enable logging so that log entries are actually generated, and to configure the appropriate logging level.
The logic that determines when a log entry may be generated forms part of the software itself, which means that unless you’re building the application or program in-house you generally can’t add new triggers for writing a log.
However, you should be able to specify the logging level. This allows you to determine how much information is written to your log files.
While both the number and names of log levels can vary between systems, most will include:
ERROR – for problems that prevent the software from functioning. This could be a serious error that causes the system to crash, or a workflow not completing successfully.
WARNING (or WARN) – for unexpected behavior that does not prevent the program from functioning, but may do so in the future if the cause of the warning is not addressed. Examples include disk space reaching capacity or a query holding database locks.
INFORMATION (or INFO) – for normal behavior, such as recording user logins or access to files.
DEBUG – for more detailed information about what is happening in the background, useful when troubleshooting an issue, both in development and in production.
When you enable logging on a system, you can also specify the minimum logging level. For example, if you set the level to WARNING, any warning and error level logs will be output by the system, but information and debug logs will not. You may also come across TRACE, which is lower than DEBUG, and SEVERE, CRITICAL or FATAL, which are all higher than ERROR.
Collecting logs
By using log file monitoring tools like Filebeat, you can centralize your logs into a single, queryable place. These tools will listen to changes to your local log files and push them into a central location. This is commonly an Elasticsearch cluster, but there are many options out there. When your logs are in the same place, you can go to a single site to get the bigger picture. This limits the toil of jumping between servers.
But now you’ve got to look after your logging platform
Elasticsearch is notoriously tricky to maintain. It has many different configuration options, and that’s before you look to optimize the cluster. Node outages can cause the loss of critical operational data, and the engineering effort, combined with the hosting costs, can quickly become expensive. At Coralogix, we aim to make this simple for you. We have experts with the Elasticsearch toolset who can ensure a smooth experience with no operational overhead.
Normalizing and parsing your logging data
The great challenge with your logs is to make them consistent. Logs are a naturally unstructured format, so parsing them can become a complex task. One strategy that teams employ is to always log in the same format, for example, JSON. Logs in JSON format are simple to parse and consistent. You can also add custom fields into your logs to surface application or business-specific information.
But what about 3rd party log analysis?
Our systems are increasingly made up of homegrown and external services, and our observability platform needs to be able to view everything, in order to enable us to perform log analysis. So what do we do about 3rd party logs? The challenge is that we can’t reliably mutate 3rd party logs, since they may change beyond our control, but what if we can add to them?
Log enrichment is key to full log analysis
It’s difficult to parse, mutate, and normalize all of your 3rd party logs, but enrichment is a great way to create some basic fields to enable log analysis. In addition, if you’re debugging an issue, the addition of tracing data to your logs can help you link together multiple events into the same logical group. This allows you to connect your logs to your business more closely. Now your logs are in great shape, it’s time to really unlock the power of log analysis.
Visualizing log data
Data visualizations are a powerful tool for identifying trends and spotting anomalies. By collating your logs in a central location, you can plot data from multiple sources to run cross-analyses and identify correlations.
Your log analytics platform should provide you with the option to run queries and apply filters to dashboards so that you can interrogate your data. For example, by plotting log data over time, you can understand what normal currently looks like in your system or correlate that data with known events such as downtime or releases.
Adding tags for these events will also make it easier to interpret the data in the future. Log analytics tools that allow you to drill down from the dashboard to specific data points significantly speed up the process of investigating anything unusual so that you can quickly determine whether it’s a sign of a real problem.
Using graphical representations of your log data can help you spot emerging trends, which is useful for capacity and resource planning. By staying ahead of the curve and anticipating spikes in demand, you can provision additional infrastructure or optimize particular workflows in order to maintain a good user experience and stay within your SLAs.
Actionable insights from your log analysis
This is where things become interesting. Now you’ve got the data and the graphs, you can process data in new and interesting ways. This is where the benefits of a mature, centralized logging platform become key. What can you do with a centralized logging platform?
Machine learning log analysis to detect unknown issues
Machine learning log analysisis very difficult to master, but it can work wonders once you have a working ML platform in place. The problem is the upfront effort and cost. It requires a great deal of analysis and expertise to get an operating ML model in place. A mature logging analysis platform with this functionality in place can help you get straight to the benefit without messing around.
Setting up alerts when your log analysis reveals something scary
Sometimes, your logs will indicate that there is a severe problem. You don’t want to wait until you glance at the monitoring board. Observability is all about giving your system a voice. By using a central log analysis platform, you can alert on complex occurrences between many applications to provide specific, tangible alerts that teams can act on quickly.
Conclusion
Log data analysis can provide you with a wealth of insights into the usage, health, and security of your systems, together with powerful and efficient tools for detecting and troubleshooting issues. Key to this endeavor is a log analytics platform that can not only simplify and accelerate the process of collating, normalizing, and parsing your log data to make it available for analysis, but also identify patterns and detect potential anomalies automatically.
By choosing a log analytics tool that leverages machine learning to keep pace with your systems as they evolve, you’ll ensure that you get maximum value from your logs while freeing up your operations and SRE teams to focus on investigating true positives or making targeted improvements to your platform and infrastructure.
Coralogix provides integrations for a wide range of log sources, including Windows Event Viewer, AWS S3, ECS and Lambda, Kubernetes, Akamai, and Heroku, support for popular log shipping agents such as Fluentd, Logstash, and Filebeat, as well as SDKs for Python, Ruby, Java, and others. Parsing rules enable you to normalize and structure your log data automatically on ingest, ready for filtering, sorting, and visualizing.
Coralogix includes multiple dashboards for visualizing, filtering, and querying log data, together with support for Kibana, Tableau, and Grafana. Our Loggregation feature uses machine learning to cluster logs based on patterns automatically, while flow and error volume anomaly alerts notify you of emerging issues while minimizing noise from false positives.
To find out more about how Coralogix can enhance the observability of your systems with log analytics, sign up for a free trial or request a demo.
If you think log files are only necessary for satisfying audit and compliance requirements, or to help software engineers debug issues during development, you’re certainly not alone. With proactive log monitoring, you configure thresholds for key health metrics and trigger alerts when these are exceeded.
Although log files may not sound like the most engaging or valuable assets, for many organizations, they are an untapped reservoir of insights that can offer significant benefits to your business.
With the proper analysis tools and techniques, your log data can help you prevent failures in your systems, reduce resolution times, improve security, and deliver a better user experience.
Understanding log files
Before we look at the benefits that log analysis can offer you, let’s take a moment to understand what logs actually are. Logs – or log entries – are messages that are generated automatically while the software is running.
That software could be an application, operating system, firewall, networking logic, or embedded program running on an IoT device, to name just a few. Logs are generated from every level of the software stack.
Each entry (or log line) provides a record of what was happening or the state of the system at a given moment in time. They can be triggered by a wide range of events, from everyday routine behavior, such as users logging in to workstations or requests made to servers, to error conditions and unexpected failures.
The precise format and content of a log entry varies, but will typically include a timestamp, log severity level, and message. Each log line is written to a log file and stored – sometimes for a few days or weeks (if the data is not required for regulatory reasons) and sometimes for months or even years.
Benefits of log analysis
Log analysis is the process of collating and normalizing log data to be parsed and processed for easier querying and providing visualizations of that data to identify patterns and anomalies.
Analyzing the data recorded in the log files from across your organization’s systems and applications will help you improve your offer’s services, enhance your security posture, and give you a better understanding of how your systems are used.
Troubleshooting failures
The primary use of log files is to provide visibility into how your software is behaving so that you can track down the cause of a problem. As computing trends towards more distributed systems, with applications made up of multiple services running on separate but connected machines, investigating the source of an issue has become more complex.
Collating and analyzing logs from the various components in a system makes it possible to join the dots and make sense of the events that led up to an error or failure. Automated log analysis speeds up this process by identifying patterns and anomalies to help you fix issues faster. Log data analysis can also be used to identify early warning signs that can alert you to similar problems earlier in the future.
Proactive monitoring and observability
The benefits of automated log analysis go further than troubleshooting issues that have already occurred. By analyzing log data in real-time, you can spot emerging issues before any real damage is done.
Observability solutions take these techniques a step further, using machine learning to maintain a constantly evolving picture of normal operations, with alerts triggered whenever anomalous behavior patterns are detected.
Taking a proactive approach to anomaly detection and troubleshooting can significantly reduce the number of serious and critical failures that occur in your production systems and reduce mean time to resolution (MTTR) for issues that arise. The result is a better experience for your users and fewer interruptions to business activities.
Security forensics
Observability and monitoring play an essential role in detecting early signs of an attack and containing threats. If a malicious actor does breach your defenses, log files often provide clues regarding how the attack was executed and the extent of the damage perpetrated or the data leaked.
Log data analysis expedites this process by drawing connections between activities, such as user account activity taking place out of hours coupled with unusual data access patterns or privilege escalation.
As well as providing the data required for reporting and audit compliance, this knowledge of how an attack was executed is essential for strengthening your defenses against similar threats in the future.
System design
As users’ expectations of software systems continue to rise, maintaining high-performance levels, stability and uptime are essential. Analyzing log data from across your IT estate can help you build a fuller picture of how your systems are used, providing you with data to inform your decisions to make targeted enhancements.
By tracking resource usage over time, you can be proactive about provisioning additional infrastructure to increase capacity or decommissioning it to save costs. Identifying slow-running database queries so that you can optimize them improves not only page load time but also reduces the risk of locks or resource saturation slowing down the rest of your system.
Using log data to understand how users interact with your application or website can also provide valuable insights into user behavior, including popular features, common requests, referring sites, and conversion rates. This information is invaluable when deciding where to next invest your development efforts.
Wrapping up
Log file analysis enables you to leverage the full benefits of your log data, transforming log files from a business cost required for regulatory reasons to a business asset that helps you streamline your operations and improve your services.
Logs play a key role in understanding your system’s performance and health. Good logging practice is also vital to power an observability platform across your system. A log monitoring software, in general, involves the collection and analysis of logs and other system metrics. Log analysis involves deriving insights from logs, which then feeds into observability.
Observability, as we’ve said before, is really the gold standard for knowing everything about your system. In this article, we’re going to examine how to work with logs from collection through to analysis, as well as some ways to get the most out of your logs.
Working with logs
To carry out a log analysis, you first need to generate the logs, collect them, and then store them. These steps are vital for log analysis and observability.
Log generation
Nearly all applications and components in your system will generate logs by default. For the most part, it’s simply a matter of enabling logs and knowing where the application, platform, or network deposits them. Some providers, like AWS’s Cloudwatch, have freemium logging as standard, where you have to pay for more granular data.
Log collection
Collecting logs for analysis is the next logical step, once you’ve got your applications producing logs. You might think about writing a workflow to draw all of these logs into one place, but really, it’s much simpler to let an application do it for you. Coralogix has native integrations with numerous AWS services, GCP, Azure, Kubernetes, Java, Logstash, firewalls, and much more. These integrations allow Coralogix to collect the logs for you automatically.
Log storage and retention
If you’re implementing a logging solution from scratch, it’s difficult to know exactly which logs you want to keep and for how long. The longer you store log data for, the higher the cost. Retention lengths are often determined by compliance requirements, as well as external factors such as cyber threats.
Now that you’ve got the logs, querying them is the next step in your analysis. Querying logs is the least sophisticated way of analyzing log data, but sometimes it’s exactly what you need to find what you’re looking for.
Querying logs with syntax
Log queries are traditionally written in a structure that allows you to return a set number of corresponding results that meet the terms of your query. While this is relatively simple, it can become tricky. Logs, for example, can come in a structured or unstructured format. Different applications may present logs in different ways – AWS, Azure, and Google all have different logging guidelines – making a broader cross-system search more difficult.
Querying logs for observability
Coralogix has several capabilities that make querying logs an enabler for observability. Log Query allows for all log data under management to be queried in a single, uniform way. This means you could cross-compare logs from different applications and platforms in one query.
You can also query logs in Coralogix using SQL, which enables more complex syntax than you’ll find in visualization tools like Kibana. You can then visualize the results of these advanced queries in Kibana, getting you on your way to observability.
Aggregating logs
Log aggregation is an important part of log analysis and observability. It allows trends to be identified, which are pivotal to build an understanding of your system performance. Traditionally, this might be done in a single database but, as mentioned above, the lack of standardization between applications will make this a difficult target for log analysis.
From aggregation to insight
Aggregating logs is a powerful way of getting rid of the “noise” that a complex system creates. From known errors to new ones caused by your latest release, your log repository is a busy place. Manually digging through gigabytes of logs to isolate the relevant data, looking for a trend, will not get you far.
Loggregation automates log clustering using machine learning, grouping together noisy dumps of data into useful insights. You can customize the templates Loggregation uses to tailor your insights and supercharge your observability platform.
Log trends
Once your logs have been aggregated and clustered, you’re ready to spot the trends. Log trends are the peak of log analysis and a key part of observability.
Log trends use aggregated log data to help you identify bottlenecks, performance problems, or even cyber threats, based on data gathered over time.
Visualizing trends for observability
Observability gives you the true view of every aspect of your system and infrastructure, at any given time. This might be your firewall, your AWS infrastructure, or even metrics from your marketing system – all can be correlated to help understand where things are going right or wrong.
Coralogix not only aggregates and clusters this data for you but gives you the option to view real-time data in a native Kibana view. There are numerous other plugins available for tools such as Tableau or Grafana, so your team is comfortable viewing and manipulating the data.
After all, it’s easier to spot a spike on a graph than it is to see it in a few hundred rows of logs.
Identifying anomalies with log observability
With all of the above in place, you’re in a great position to carry out log analysis. However, it’s important to know how to use this capability to spot anomalies quickly. Once again, technology is here to help in some of the most critical areas prone to failures.
Imperceptible anomalies
Even with all your logs aggregated and nicely visualized on a Grafana dashboard, you might struggle to spot small deviations from your system’s baseline performance. That’s where machine learning tools can come to the rescue. For example, a rise in error volume is a key indicator that you’re having performance or authentication issues somewhere. Error Volume Anomaly and Flow Anomaly are two machine learning tools that formulate a baseline of your system and help identify when there’s a deviation from the norm.
Bouncing back from releases
When customer-facing platforms undergo hundreds of micro-releases per day, keeping track of their impact on your system is important. It makes rolling back to a stable point so much easier and helps you quantify the effect of a change on your system. Benchmark Reports and Version Tags allow you to trace every change to your system, the overall effect, and visualize the outcomes. Pretty cool, eh?
Don’t Do It Yourself
As you might have detected throughout this article, there is a lot of “heavy lifting” that goes into standing up log analytics for observability. It’s challenging to gather all of your logs, collate, store, aggregate, and then analyze all by yourself, or even with a team of devs. On top of that, you have to maintain logging best practices.
Do the smart thing. Coralogix is the enterprise-grade observability and logs analytics platform, built to scale for you. With machine learning and years of experience built-in, you won’t find a better companion to get you to total system observability.
The Internet of Things (IoT) has quickly become a huge part of how people live, communicate and do business. All kinds of everyday things make up this network – fridges, kettles, light switches – you name it. If it’s connected to WiFi, it’s part of the Internet of Things.
IoT raises significant challenges that could stand in your way of fully realizing its potential benefits. The matter of widespread adoption to a secure, functioning global device network still needs to be addressed. Plus, other concerns related to the hacking of Internet-connected devices and privacy fears have captured public attention.
Many of the challenges related to IoT are wide reaching and may be outside the scope of whatever you’re working on. That said, with effective IoT log management, you’ll be able to manage and troubleshoot these challenges and allow stakeholders to derive insights from data embedded in log events.
Key Challenges Facing IoT and How Your Logs Can Help You Handle Them
Here are some of the key IoT logging challenges along with some potential solutions that you can use to overcome them.
1. Log Management
In general, log management is especially important for IoT applications because of their dynamic, distributed, and fleeting nature. In a short period of time, IoT devices can generate millions of logged events. This in itself is a challenge. You’ll need to ensure that the data captured is accurate, that the common data types are standardized across all logs, and that the logs are protected.
Logs provide value to both troubleshooting and business insights. You can extract interesting metadata for optimization such as improving the onboarding process and making it more secure for connectivity purposes. In order to derive such insights, you’ll need to centralize your logs.
As IoT becomes more and more complex, so does the task of managing it. The goal is to get ahead of problems, and logging lets you do that. Rather than reacting to issues, proactively cut them off and fix them immediately.
IoT Log management has key functions that, if followed, will ensure your logging and monitoring go smoothly. This includes:
Log aggregation to centralized log storage. This means collectIng only the required logs from the needed source or endpoints and having dedicated servers that does buffering, parsing and enriching
Log search and analysis. Stored and indexed, your aggregated log files are now searchable
Log monitoring and alerting. Log management helps keep you on your toes, constantly providing data about how your IoT applications are performing
A log management policy for IoT will provide guidelines as to what types of actions need to be logged in order to trace inappropriate use (privacy), performance issues, and security breaches.
2. Communication Protocols
Message Queuing Telemetry Transport (MQTT) is a very common example of a communication protocol widely used in IoT. A challenge with MQTT is exposed endpoints and the potential deployment of thousands of unsecure MQTT hosts. This results from a lack of secure configurations and the likelihood of misconfigurations in devices that use MQTT.
The use of any communication protocol of this nature has to ensure secure endpoints. Unsecure endpoints can expose records and leak information, some of which can be related to critical sectors, for any casual attacker to see. Then, of course, remains the risk of vulnerabilities that enable denial of service, or worse.
As MQTT does not check the data or payload that they transport, the information they carry can be really anything, posing data validation issues on the connected systems. Organizations should pay adequate attention to IoT security.
As an example, AWS IoT, part of Amazon Web Services (AWS), is essentially a managed MQTT service with strong and enforced security policies. It monitors AWS IoT using CloudWatch Logs to monitor, store, and access your log files. It can send progress events about each message, as it passes from your devices through the message broker and rules engine.
Security teams with the right analytics tools, can use these captured logs for cyber forensic analysis. This can help to understand how to design secure IoT and ensure users do not connect an IoT device in an unsecure way. Otherwise cyber attackers will continue to take advantage of any exposed data that includes personal or potentially company sensitive information.
3. Application of Security in IoT
Each new IoT device provides a potential entry point for hackers to target your IoT network. Rather than allowing any device onto the network, new devices should be “provisioned”. This means you’ll need a robust, predictable process.
Data transmitted over IoT networks is at risk of being intercepted by criminal parties, so organizations should use only secure, password-protected wireless networks to ensure data is encrypted.
To guard against potential threats, organizations should build their networks with the assumption that any device connected to it is ’zero trust network’. Even if someone makes it into your network, they should still need authentication in order to access anything.
4. Connectivity Bottlenecks
The growth of IoT devices has already placed strain on many networks. Without the right ‘edge’ computing framework in place, company networks can become bogged down by latency and sub par bandwidth.
Device connectivity can be unreliable. 4G connections regularly disconnect and reconnect and don’t offer the same stability available to a typical broadband connection. Take a jogger with their smartwatch going out for a run, for example. They’re going from areas with strong connectivity to areas with poor connectivity and back again. Prolonged disconnections can result in the device running out of buffer memory to store its logs.
The biggest part of logging in IoT in these situations, is to understand where to store the generated data. Having a centralized log management system and a requirement that devices are connected to the Internet when they are updating, will ensure greater stability and reduce these types of bottlenecks.
It is important for companies developing IoT technology, to carefully examine their IoT connectivity providers and choose one with a strong record of service and innovation. If you want to take it to the next level, you can intelligently switch between networks, based on their relative strength at any given time.
5. Power Management
With a growing number of IoT devices comes growing power management requirements. Some IoT devices, like kitchen appliances, are located in accessible locations and draw on stable power sources. As we know, this isn’t always the case. Many devices rely solely on a battery for power.
Power consumption is not just a hardware issue. Greedy software can consume more resources than it needs and drain the limited power available to the device.
Power consumption is best captured using device log management and having a centralized location for those logs to be analyzed.
Modern device data capture techniques integrating with cloud platform services, will help with power problems in IoT devices. Techniques captured from hardware-based power measurements, software-based power measurements embedded in devices and power tracking with anomaly detection, improve efficiency in power management requirements. It will ensure the storage, RAM and CPU capacities of IoT devices are more effective and efficient in their use.
The analysis of this data using forensics, security auditing, network tracing, or data analytics, enables the deep dive into power consumption details. This also gives context to historical power consumption.
6. Data Management
IoT networks generate huge amounts of data. Keeping track of all this data is a challenge in and of itself.
Edge computing can help here. Edge computing is an architectural decision to process data at or near the source. This pushes processing overhead down to the client, lowering the burden on some central system to keep track of everything. We do this instinctively in normal software, with fluentbit and fluentd transformations that format logs on the box, before sending them to a log collection server like Elasticsearch.
Edge computing, data governance policies, and metadata management help organizations deal with issues of scalability and agility, security, and usability. This further assists them to decide whether to manage data on the edge or only after sending it to the cloud.
Organizations need to ensure they are collecting the specific data logging they are looking to isolate. They must then find the right software to keep track of this data and analyze it effectively. Whether in a centralized location or processed near the data source, the right storage is needed. Cloud storage is a solution but others options can rely on the local IoT device itself.
7. Device Management
From an organizational perspective, the advent of the IoT has made the range of devices IT needs to administer limitlessly. Devices need to be regularly patched and inspected to ensure they are at the highest possible level of performance and reliability. Remember, in an IoT system, someone can spill a glass of water and fry one of your devices. The hardware matters just as much as the software.
With the introduction of IoT device management software, this enables an onboarding process of device provisioning and provides a capability to monitor usage and performance metrics. The metrics captured locally and stored in a centralized data storage location for analytics purposes.
This software provides secure on-boarding, organizing, monitoring, troubleshooting, and sending of firmware updates ‘over the air’ (OTA). It will assign them to devices and makes connected devices ready for service quickly. Device management software allows you to quickly zone in on one specific device, in a network of thousands.
8. Complexity of Data Captured
A major challenge of capturing IoT data is due to its complex nature. Often, organizations must not only prepare timestamp or geotag data, but combine it with more structured sources. Today an organization must figure out a way to leverage the resources they have in order to prepare the increasingly complex IoT data.
Organizations must equip their teams with data preparation platforms that can handle the volume and complexity of IoT data, as well as understand how this data can and will be joined with other sources across the organization. By adopting intelligent data preparation solutions and integrating them with a centralized logging repository, the universe of IoT and big data no longer overwhelms. This can be provided from IoT cloud services and ensures organizations are only collecting data that is useful for analytics, forensics, and intelligence purposes.
9. Threat of Cyber Attacks
One of the biggest security challenges is the creation of Distributed Destruction of Service (DDoS) attacks that employ swarms of poorly protected IoT devices, to attack public infrastructure through coordinated misuse of communication channels. An example is the use of IoT botnets that can direct enormous swarms of connected sensors, to cause damaging and unpredictable spikes in infrastructure use, leading to things like power surges, destructive water hammer attacks, or reduced availability of critical infrastructure on a wide scale.
A very large percentage of traffic from IoT devices to our honeypots is automated. A honeypot being the computer security mechanism set to detect, deflect, or counteract attempts at unauthorized use of information. This is a dangerous scenario, given that most modern bot armies and malware are scripted to attack at scale.
Centralizing all access logs will allow organizations to maintain all vulnerable devices under their control. The captured logs can be used for cyber forensic work and allows us to connect the dots and find correlations between events that may otherwise look unrelated.
10. Compatibility and Updates
New waves of technology often feature a large stable of competitors jockeying for market share, and IoT is certainly no exception. When it comes to home automation using mesh networking, several competitors have sprung up to challenge Bluetooth’s mesh network offerings. Continued compatibility for IoT devices also depends upon users keeping their devices updated and patched. Unpatched IoT devices present serious security vulnerabilities and increase consumer risk.
Wrap-Up
IoT is one of the most exciting engineering developments of the past decade. It opens up a whole world of new capabilities and tooling, that can bring convenience and support to many consumers. With all of these new features, however, comes risk.
Without focusing on our observability responsibilities, a thousand disparate devices is a maintenance and security nightmare. Check out how Coralogix can make your life easier and consume all of those logs for you, in real-time.
By now DevOps are hopefully aware that among the multitude of modern analytics methods available to them, an advanced log monitoring tool provides the most complete view into how a product is functioning. Cases of log files among DevOpsare broad, ranging from the expected, like production monitoring and development debugging, to the less obvious, like business analytics.
But when faced with the dizzying list of third-party logging tools on the market, what key features should DevOps look for before making a choice? And is it possible to find a single platform that combines all the essential features for today’s SDLC?
The Must-Haves When Choosing a Logging and Monitoring Tool
Functionalities you might assume as standard among logging tools may not be universally offered, and the most recent developments in log management — particularly via machine learning — might pleasantly surprise you. This list of features is a good starting point for narrowing down the large market selection and choosing the best logging and enterprise monitoring tools for your needs:
Range and Scalability – As a product’s user base expands, the range of log sources that DevOps need to monitor grows as well. A logging tool should collect logs from each system component, application-side or server-side, and provide access to them in one centralized location. Not all logging platforms are capable ofmaintaining speed as the number of logs they process grows. Therefore, you should keep a critical eye on the process when trying out different solutions.
Advanced Aggregation – It’s easy to be overwhelmed by all the data that a logging tool collects. Good aggregation features should allow DevOps to group their logs together according to a variety of shared characteristics, including log origin (devices, servers, databases, applications), feature usage, user action, error type, etc. As logs are generated they can be automatically analyzed to determine which of the existing groups they fit into, and then categorized accordingly.
Intelligent Pattern Recognition – Advancements in machine learning allow contemporary logging and monitoring tools to quickly (within two weeks, in Coralogix’s case) learn the standard log syntaxes within a given system. This gives the platform a sense of what the logs look like when components of the system are running optimally, and saves DevOps time that would be spent programming the platform with standard log patterns.
Automatic Anomaly Flagging –The days of static reporting are over. Once a platform has learned log patterns, it cangenerate DevOps alerts notifying DevOps of deviations in those patterns, including possible bugs, security vulnerabilities, sudden changes in user behavior, and more.
Deep Storage – In order to discover the history behind certain product behaviors, or to really get a clear sense ofevolving trends in your business, you’ll need to dig deep. Extended storage times for old log files may also be necessary for terms ofcompliance, be it with externally-mandated laws and practices or for your specific organization’s internal standards.
Search Functionality – In the event that a bug is reported by users, rather than automatically identified by your logging tool, you need a high-performing search function to track the issue down among the heap of log files. Note that it’s not a given for all logging platforms to provide code context (what occurred before and after the issue) for a search result, or extensive filtering options to narrow down returns of false leads.
Minimal Footprint – What’s the point of using logs to monitor signs of potential resource abuse within your environment if the log management platform you’re using contributes to that abuse? When you test run a logging tool, it’s crucial to be mindful of the impact it has on your system’s overall performance.
Keep It Consolidated
There’s nothing cohesive, practical, or fiscally sound about using a conveyor belt of different enterprise tools. Time is wasted by constantly readjusting to the workflow of each, and money is wasted by virtue of adding 5-10 line items to a budget rather than one.
The checklist in this article is lengthy, but surprisingly attainable within a single logging platform. If a DevOps team finds itself piecing together multiple logging and monitoring tools in order to satisfy its full range of needs across development, testing, and production, it might be time to move to a moreholistic solution.
Be Our Partner
Complete this form to speak with one of our partner managers.
Thank You
Someone from our team will reach out shortly. Talk to you soon!
 The new standard of observability is here. Discover Olly, the industry’s first