In recent years, microservices have emerged as a popular architectural pattern. Although these self-contained services offer greater flexibility, scalability, and maintainability compared to monolithic applications, they can be difficult to manage without dedicated tools.
Kubernetes, a scalable platform for orchestrating containerized applications, can help navigate your microservices. In this article, we will explore the relationship between Kubernetes and microservices, key components and benefits of Kubernetes and best practices for deploying microservices on the platform.
Before we dive in, let’s take a moment to understand the concept of microservices and examine some of the challenges they present, such as log management.
What are microservices?
Microservices are an architectural style in software development where an application is built as a collection of small, loosely coupled, and independently deployable services.
Each service represents a specific business capability and operates as a separate unit, communicating with other services through well-defined APIs. These services are designed to perform a single task or function, following a single responsibility principle.
In contrast to traditional monolithic architectures, where the entire application is tightly integrated and deployed as a single unit, microservices break down the application into smaller, more manageable pieces.
Adopting a microservice architecture has several benefits. The decentralized nature of microservices enables them to operate independently, allowing separate development, deployment, and scalability. This autonomy leads to decentralized decision-making, fostering an environment where teams can work autonomously.
Additionally, it allows developers to use different technologies and frameworks across microservices, as long as they adhere to standardized APIs and communication protocols.
The modular structure of microservices brings flexibility and agility to development, facilitating easy modifications and updates without disrupting the entire application.
This flexibility enables development teams to swiftly respond to changing requirements, accelerating time-to-market. It also means that a failure in one service does not cascade to affect others, resulting in a more robust overall system.
Lastly, microservices support horizontal scaling. Each service can replicate itself to handle varying workloads, ensuring optimal resource utilization and scalability as the application grows.
Challenges of microservices
While microservices offer many advantages, they also introduce complexities in certain areas, such as observability. In a monolithic application, it is relatively easy to understand the system’s behavior and identify issues since everything is tightly coupled. As an application is divided into independent microservices, the complexity naturally rises, requiring a shift in how observability is employed within the system. This is especially true for log observability for microservices, since we now have independent services that generate an important amount of logs when interacting with each other and handling requests.
Other challenges of microservices include managing inter-service communication, data consistency, and orchestrating deployments across multiple services. Thus Kubernetes can help you by offering a robust and efficient solution to handle these challenges and streamline the management of microservices.
Components of Kubernetes
Before delving into the advantages of using Kubernetes for microservices, let’s take a brief look at its key components.
A Kubernetes cluster is composed of a Control Plane and Worker Nodes. Each worker node is like a stage where your applications perform. Inside these nodes, you have small units called pods, which are like mini-containers for your applications.
These pods contain your application’s code and everything it needs to run. The control plane is like the mastermind, managing the entire show and keeping track of all the worker nodes and pods, making sure they work together harmoniously. The pods will also orchestrate the deployment, scaling, and health of your applications.
Kubernetes also provides other valuable features, including:
Deployments
With Deployments, you can specify the desired state for pods, ensuring that the correct number of replicas is always running. It simplifies the process of managing updates and rollbacks, making application deployment a smooth process..
Services
Kubernetes Services facilitate seamless communication and load balancing between pods. They abstract away the complexity of managing individual pod IP addresses and enable stable access to your application services.
ConfigMaps and Secrets
ConfigMaps and Secrets offer a neat way to separate configuration data from container images. This decoupling allows you to modify configurations without altering the container itself and enables secure management of sensitive data.
Horizontal Pod Autoscaling (HPA)
HPA is a powerful feature that automatically adjusts the number of pods based on resource utilization. It ensures that your applications can handle varying workloads efficiently, scaling up or down as needed.
Benefits of using Kubernetes for microservices
Kubernetes provides several advantages when it comes to managing microservices effectively.
Scalability
Kubernetes excels at horizontal scaling, allowing you to scale individual microservices based on demand. This ensures that your applications can handle varying workloads effectively without over-provisioning resources.
High availability
Kubernetes provides built-in self-healing capabilities. If a microservice or a node fails, Kubernetes automatically restarts the failed components or replaces them with new ones, ensuring high availability and minimizing downtime.
Resource management
Kubernetes enables efficient resource allocation and utilization. You can define resource limits and requests for each microservice, ensuring fair distribution of resources and preventing resource starvation.
Rolling updates and rollbacks
With Kubernetes Deployments, you can seamlessly perform rolling updates for your microservices, enabling you to release new versions without service disruption. In case of issues, you can quickly roll back to the previous stable version.
Service discovery and load balancing
Kubernetes provides a built-in service discovery mechanism that allows microservices to find and communicate with each other. Additionally, Kubernetes automatically load-balances incoming traffic across multiple replicas of a service.
Automated deployment
Kubernetes enables the automation of microservices deployment. By integrating CI/CD pipelines with Kubernetes, you can automate the entire deployment process, reducing the risk of human errors and speeding up the delivery cycle.
Declarative configuration
Kubernetes follows a declarative approach, where you specify the desired state of your microservices in YAML manifests. Kubernetes then ensures that the actual state matches the desired state, handling the complexities of deployment and orchestration.
Version compatibility
Kubernetes supports various container runtimes, such as Docker and containerd, allowing you to run containers built with different versions of the runtime. This makes it easier to migrate and manage microservices developed with diverse technology stacks.
Community and ecosystem
Kubernetes has a vibrant and active open-source community, leading to continuous development, innovation, and support. Additionally, an extensive ecosystem of tools, plugins, and add-ons complements Kubernetes, enriching the overall user experience.
Observability and monitoring
Kubernetes integrates well with various monitoring and observability tools, providing insights into the performance and health of microservices.
12 tips for using microservices on Kubernetes
Creating and deploying microservices on Kubernetes involves several steps, from containerizing your microservices to defining Kubernetes resources for their deployment. Here’s a step-by-step guide, featuring our Kubernetes tips, to help you get started:
1. Containerize your microservices
Containerize each microservice and Include all dependencies and configurations required for the service to run.
2. Set up Kubernetes cluster
Install and set up Kubernetes. Depending on your requirements, you can use a managed Kubernetes service (e.g., GKE, AKS, EKS) or set up your own Kubernetes cluster using tools like kubeadm, kops, or k3s.
3. Create Kubernetes deployment manifest
Write a Kubernetes Deployment YAML manifest for each microservice: Define the desired state of the microservice, including the container image, resource limits, number of replicas, and any environment variables or ConfigMaps needed.
4. Create Kubernetes service manifest
If your microservices require external access or communication between services, define a Service resource to expose the microservice internally or externally with a Kubernetes Service YAML manifest.
5. Apply the manifests
Use the kubectl apply command to apply the Deployment and Service manifests to your Kubernetes cluster. This will create the necessary resources and start the microservices.
6. Monitor and scale
Observability is especially important in microservices due to the challenges posed by the distributed and decentralized nature of microservices architecture. To ensure the best user experience, it is essential to have robust tools and observability practices in place. .
Once your observability tools are up and running, consider setting up Horizontal Pod Autoscaler (HPA) to automatically scale the number of replicas based on the metrics you gather on resource utilization.
7. Continuous integration and continuous deployment
Integrate your Kubernetes deployments into your CI/CD pipeline to enable automated testing, building, and deployment of microservices.
8. Service discovery and load balancing
Leverage Kubernetes’ built-in service discovery and load balancing mechanisms to allow communication between microservices. Services abstract the underlying Pods and provide a stable IP address and DNS name for accessing them.
9. Configure ingress controllers
If you need to expose your microservices to the external world, set up an Ingress Controller. This will manage external access and enable features like SSL termination and URL-based routing.
10. Manage configurations and secrets
Use ConfigMaps and Secrets to manage configurations and sensitive data separately from your container images. This allows you to change settings without redeploying the microservices.
11. Rolling updates and rollbacks
Utilize Kubernetes Deployments to perform rolling updates and rollbacks seamlessly. This allows you to release new versions of microservices without service disruption and easily revert to a previous stable version if needed.
12. Security best practices
Implement Kubernetes security best practices, such as Role-Based Access Control (RBAC), Network Policies, and Pod Security Policies, to protect your microservices and the cluster from potential threats.
Python is a highly skilled language with a large developer community, which is essential in data science, machine learning, embedded applications, and back-end web and cloud applications.
And logging is critical to understanding software behavior in Python. Once logs are in place, log monitoring can be utilized to make sense of what is happening in the software. Python includes several logging libraries that create and direct logs to their assigned targets.
This article will go over Python logging best practices to help you get the best log monitoring setup for your organization.
What is Python logging?
Logging in Python, like other programming languages, is implemented to indicate events that have occurred in software. Logs should include descriptive messages and variable data to communicate the state of the software at the time of logging.
They also communicate the severity of the event using unique log levels. Logs can be generated using the Python standard library.
Python logging module
The Python standard library provides a logging module to log events from applications and libraries. Once the Python JSON logger is configured, it becomes part of the Python interpreter process that is running the code.
In other words, Python logging is global. You can also configure the Python logging subsystem using an external configuration file. The specifications for the logging configuration format are found in the Python standard library documentation.
The logging library is modular and offers four categories of components:
Loggers expose the interface used by the application code.
Handlers are created by loggers and send log records to the appropriate destination.
Filters can determine which log records are output.
Formatters specify the layout of the final log record output.
Multiple logger objects are organized into a tree representing various parts of your system and the different third-party libraries you have installed. When you send a message to one of the loggers, the message gets output on that logger’s handlers using a formatter attached to each handler.
The message then propagates the logger tree until it hits the root logger or a logger in the tree configured with .propagate=False. This hierarchy allows logs to be captured up the subtree of loggers, and a single handler could catch all logging messages.
Python loggers
The logging.Logger objects offer the primary interface to the logging library. These objects provide the logging methods to issue log requests along with the methods to query and modify their state. From here on out, we will refer to Logger objects as loggers.
Creating a new logger
The factory function logging.getLogger(name) is typically used to create loggers. By using the factory function, clients can rely on the library to manage loggers and access loggers via their names instead of storing and passing references to loggers.
The name argument in the factory function is typically a dot-separated hierarchical name, i.e. a.b.c. This naming convention enables the library to maintain a hierarchy of loggers. Specifically, when the factory function creates a logger, the library ensures a logger exists for each level of the hierarchy specified by the name, and every logger in the hierarchy is linked to its parent and child loggers.
Threshold logging level
Each logger has a threshold logging level to determine whether a log request should be processed. A logger processes a log request if the numeric value of the requested logging level is greater than or equal to the severity of the logger’s threshold logging level.
Clients can retrieve and change the threshold logging level of a logger via Logger.getEffectiveLevel() and Logger.setLevel(level) methods, respectively. When the factory function is used to create a logger, the function sets a logger’s threshold logging level to the threshold logging level of its parent logger as determined by its name.
Log levels
Log levels allow you to define event severity for each log so they are easily analyzed. Python supports predefined values, which can be found by calling logging.getLevelName(). Predefined log levels include CRITICAL, ERROR, WARNING, INFO, and DEBUG from highest to lowest severity. Developers can also maintain a dictionary of log levels by defining custom levels using logging.getLogger().
Python comes with different methods to read events from the software: print() and logging. Both will communicate event data but pass this information to different storage locations using different methods.
The print function sends data exclusively to the console. This can be convenient for fast testing as a function is developed, but it is not practical for use in functional software. There are two critical reasons to not use print() in software:
If your code is used by other tools or scripts, the user will not know the context of the print messages.
When running Python software in containers like Docker, the print messages will not be seen since containers cannot access the console.
The logging library also provides many features contributing to Python logging best practices. These include identifying the line of the file, function, and time of log events, distinguishing log events by their importance, and providing formatting to keep log messages consistent.
Python logging examples
Here are a few code snippets to illustrate how to use the Python logging library.
Snippet 1: Creating a logger with a handler and a formatter
# main.py
import logging, sys

def _init_logger():    #Create a logger named 'app'
    logger = logging.getLogger('app')
    #Set the threshold logging level of the logger to INFO
    logger.setLevel(logging.INFO)
    #Create a stream-based handler that writes the log entries    #into the standard output stream
    handler = logging.StreamHandler(sys.stdout)
    #Create a formatter for the logs
    formatter = logging.Formatter(       '%(created)f:%(levelname)s:%(name)s:%(module)s:%(message)s')
        #Set the created formatter as the formatter of the handler    handler.setFormatter(formatter)
    #Add the created handler to this logger
    logger.addHandler(handler)

_init_logger()
_logger = logging.getLogger('app')
In snippet 1, a logger is created with a log level of INFO. Any logs that have a severity less than INFO will not print (i.e. DEBUG logs). A new handler is created and assigned to the logger. New handlers can be added to send logging outputs to streams like sys.stdout or any file-like object.
A formatter is created and added to the handler to transform log messages into placeholder data. In this formatter, the time of the log request (as an epoch timestamp), the logging level, the logger’s name, the module name, and the log message will all print.
Snippet 2: Issuing log requests
# main.py
_logger.info('App started in %s', os.getcwd())
In snippet 2, an info log states the app has started. When the app is started in the folder /home/kali with the logger created in snippet 1, the following log entry will be generated in the std.out stream:
1586147623.484407:INFO:app:main:App started in /home/kali/
Snippet 3: Issuing log requests with positional arguments
# app/io.py
import logging

def _init_logger():
    logger = logging.getLogger('app.io')
    logger.setLevel(logging.INFO)

_init_logger()
_logger = logging.getLogger('app.io')

def write_data(file_name, data):
    try:
        # write data
        _logger.info('Successfully wrote %d bytes into %s', len(data), file_name)
    except FileNotFoundError:
        _logger.exception('Failed to write data into %s', file_name)
This snippet logs an informational message every time data is written successfully via write_data. If a write fails, the snippet logs an error message that includes the stack trace in which the exception occurred. The logs here use positional arguments to enhance the value of the logs and provide more contextual information.
With the logger created using snippet 1, successful execution of write_data would create a log similar to:
1586149091.005398:INFO:app.io:io:Successfully wrote 134 bytes into /tmp/tmp_data.txt
If the execution fails, then the created log will appear like:
1586149219.893821:ERROR:app:io:Failed to write data into /tmp1/tmp_data.txt
Traceback (most recent call last):
File “/home/kali/program/app/io.py”, line 12, in write_data
print(open(file_name), data)
FileNotFoundError: [Errno 2] No such file or directory: ‘/tmp1/tmp_data.txt’
Alternatively to positional arguments, the same outputs could be achieved using complete names as in:
_logger.info('Successfully wrote %(data_size)s bytes into %(file_name)s',
    {'data_size': len(data), 'file_name': file_name})
Types of Python logging methods
Every logger offers a shorthand method to log requests by level. Each pre-defined log level is available in shorthand; for example, Logger.error(msg, *args, **kwargs).
In addition to these shorthand methods, loggers also offer a general method to specify the log level in the arguments. This method is useful when using custom logging levels.
Logger.log(level, msg, *args, **kwargs)
Another useful method is used for logs inside exception handlers. It issues log requests with the logging level ERROR and captures the current exception as part of the log entry.
Logger.exception(msg, *args, **kwargs)
In each of the methods above, the msg and args arguments are combined to create log messages captured by log entries. They each support the keyword argument exc_info to add exception information to log entries and stack_info and stacklevel to add call stack information to log entries. Also, they support the keyword argument extra, which is a dictionary, to pass values relevant to filters, handlers, and formatters.
How to get started with Python logging
To get the most out of your Python logging, they need to be set up consistently and ready to analyze. When setting up your Python logging, use these best practices below.
Create loggers using .getlogger
The logging.getLogger() factory function helps the library manage the mapping from logger names to logger instances and maintain a hierarchy of loggers. In turn, this mapping and hierarchy offer the following benefits:
Clients can use the factory function to access the same logger in different application parts by merely retrieving the logger by its name.
Only a finite number of loggers are created at runtime (under normal circumstances).
Log requests can be propagated up the logger hierarchy.
When unspecified, the threshold logging level of a logger can be inferred from its ascendants.
The configuration of the logging library can be updated at runtime by merely relying on the logger names.
Use pre-defined logging levels
Use the shorthand logging.<logging level>() method to log at pre-defined logging levels. Besides making the code a bit shorter, the use of these functions helps partition the logging statements into two sets:
Those that issue log requests with pre-defined logging levels.
Those that issue log requests with custom logging levels.
The pre-defined logging levels capture almost all logging scenarios that occur. Most developers are universally familiar with these logging levels across different programming languages, making them easy to understand. The use of these values reduces deployment, configuration, and maintenance burdens.
Create module-level loggers
While creating loggers, we can create a logger for each class or create a logger for each module. While the first option enables fine-grained configuration, it leads to more loggers in a program, i.e., one per class. In contrast, the second option can help reduce the number of loggers in a program. So, unless such fine-grained configuration is necessary, create module-level loggers.
Use .LoggerAdapter to inject local contextual information
Use logging.LoggerAdapter() to inject contextual information into log records. The class can also modify the log message and data provided as part of the request. Since the logging library does not manage these adapters, they cannot be accessed with common names. Use them to inject contextual information local to a module or class.
Use filters or .setLogRecordFactor() to inject global contextual information
Two options exist to seamlessly inject global contextual information (common across an app) into log records. The first option is to use the filter support to modify the log record arguments provided to filters. For example, the following filter injects version information into incoming log records.
There are two downsides to this option. First, if filters depend on the data in log records, then filters that inject data into log records should be executed before filters that use the injected data. Thus, the order of filters added to loggers and handlers becomes crucial. Second, the option “abuses” the support to filter log records to extend log records.
The second option is to initialize the logging library with a log record creating a factory function via logging.setLogRecordFactory(). Since the injected contextual information is global, it can be injected into log records when created in the factory function. This ensures the data will be available to every filter, formatter, logger, and handler in the program.
The downside of this option is that we have to ensure factory functions contributed by different components in a program play nicely with each other. While log record factory functions could be chained, such chaining increases the complexity of programs.
Use .disable() to inhibit processing of low-level requests
A logger will process a log request based on the effective logging level. The effective logging level is the higher of two logging levels: the logger’s threshold level and the library-wide level. Set the library-wide logging level using the logging.disable(level) function. This is set to 0 by default so that every log request will be processed.
Using this function, the software will throttle the logging output of an app by increasing the logging level across the whole app. This can be important to keep log volumes in check in production software.
Advantages and disadvantages of python logging
Python’s logging library is more complicated than simple print() statements. The library has many great features that provide a complete solution for obtaining log data needed to achieve full-stack observability in your software.
Here we show the high-level advantages and disadvantages of the library.
Configurable logging
The Python logging library is highly configurable. Logs can be formatted before printing, can have placeholder data filled in automatically, and can be turned on and off as needed. Logs can also be sent to a number of different locations for easier reading and debugging. All of these settings are codified, so are well-defined for each logger.
Save Tracebacks
In failures, it is useful to log debugging information showing where and when a failure occurred. These tracebacks can be generated automatically in the Python logging library to help speed up troubleshooting and fixes.
Difficulty using consistent logging levels
Log levels used in different scenarios can be subjective across a development team. For proper analysis, it is important to keep log levels consistent. Create a well-defined strategy for your team about when to use each logging level available and when a custom level is appropriate.
Design of multiple loggers
Since the logging module is so flexible, logging configurations can quickly get complicated. Create a strategy for your team for how each logging module will be defined to keep logs consistent across developers.
Python logging platforms
Let’s look at an example of a basic logger in Python:
Line 2: create a basicConf function and pass some arguments to create the log file. In this case, we indicate the severity level, date format, filename and file mode to have the function overwrite the log file.
Line 3 to 5: messages for each logging level.
The default format for log records is SEVERITY: LOGGER: MESSAGE. Hence, if you run the code above as is, you’ll get this output:
Regarding the output, you can set the destination of the log messages. As a first step, you can print messages to the screen using this sample code:
import logging
logging.basicConfig(level=logging.DEBUG, format='%(asctime)s - %(levelname)s - %(message)s')
logging.debug('This is a log message.')
If your goals are aimed at the Cloud, you can take advantage of Python’s set of logging handlers to redirect content. Currently in beta release, you can write logs to Stackdriver Logging from Python applications by using Google’s Python logging handler included with the Stackdriver Logging client library, or by using the client library to access the API directly. When developing your logger, take into account that the root logger doesn’t use your log handler. Since the Python Client for Stackdriver Logging library also does logging, you may get a recursive loop if the root logger uses yourPython log handler.
Basic Python logging concepts
When we use a logging library, we perform/trigger the following common tasks while using the associated concepts (highlighted in bold).
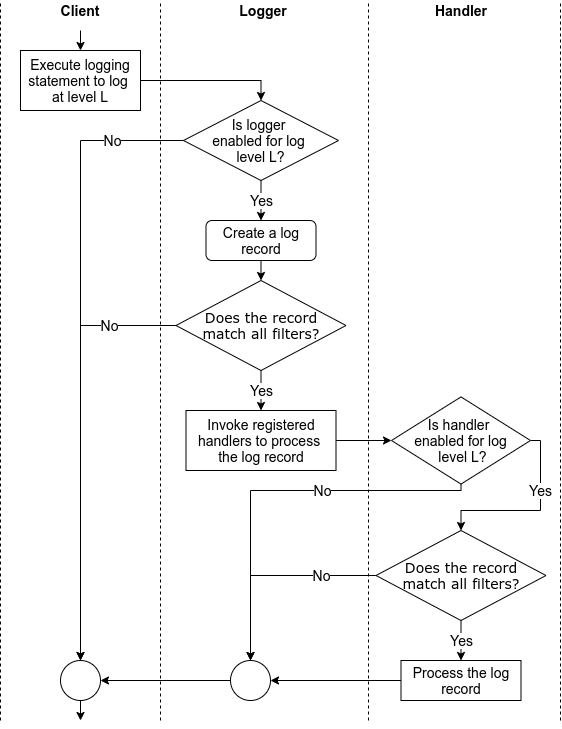
A client issues a log request by executing a logging statement. Often, such logging statements invoke a function/method in the logging (library) API by providing the log data and the logging level as arguments. The logging level specifies the importance of the log request. Log data is often a log message, which is a string, along with some extra data to be logged. Often, the logging API is exposed via logger objects.
To enable the processing of a request as it threads through the logging library, the logging library creates a log record that represents the log request and captures the corresponding log data.
Based on how the logging library is configured (via a logging configuration), the logging library filters the log requests/records. This filtering involves comparing the requested logging level to the threshold logging level and passing the log records through user-provided filters.
Handlers process the filtered log records to either store the log data (e.g., write the log data into a file) or perform other actions involving the log data (e.g., send an email with the log data). In some logging libraries, before processing log records, a handler may again filter the log records based on the handler’s logging level and user-provided handler-specific filters. Also, when needed, handlers often rely on user-provided formatters to format log records into strings, i.e., log entries.
Independent of the logging library, the above tasks are performed in an order similar to that shown in Figure 1.
Figure 1: The flow of tasks when logging via a logging library
Python logging methods
Every logger offers the following logging methods to issue log requests.
Each of these methods is a shorthand to issue log requests with corresponding pre-defined logging levels as the requested logging level.
In addition to the above methods, loggers also offer the following two methods:
Logger.log(level, msg, *args, **kwargs) issues log requests with explicitly specified logging levels. This method is useful when using custom logging levels.
Logger.exception(msg, *args, **kwargs) issues log requests with the logging level ERROR and that capture the current exception as part of the log entries. Consequently, clients should invoke this method only from an exception handler.
msg and args arguments in the above methods are combined to create log messages captured by log entries. All of the above methods support the keyword argument exc_info to add exception information to log entries and stack_info and stacklevel to add call stack information to log entries. Also, they support the keyword argument extra, which is a dictionary, to pass values relevant to filters, handlers, and formatters.
When executed, the above methods perform/trigger all of the tasks shown in Figure 1 and the following two tasks:
After deciding to process a log request based on its logging level and the threshold logging level, the logger creates a LogRecord object to represent the log request in the downstream processing of the request. LogRecord objects capture the msg and args arguments of logging methods and the exception and call stack information along with source code information. They also capture the keys and values in the extra argument of the logging method as fields.
After every handler of a logger has processed a log request, the handlers of its ancestor loggers process the request (in the order they are encountered walking up the logger hierarchy). The Logger.propagate field controls this aspect, which is True by default.
Beyond logging levels, filters provide a finer means to filter log requests based on the information in a log record, e.g., ignore log requests issued in a specific class. Clients can add and remove filters to/from loggers using Logger.addFilter(filter) and Logger.removeFilter(filter) methods, respectively.
Python logging configuration
The logging classes introduced in the previous section provide methods to configure their instances and, consequently, customize the use of the logging library. Snippet 1 demonstrates how to use configuration methods. These methods are best used in simple single-file programs.
When involved programs (e.g., apps, libraries) use the logging library, a better option is to externalize the configuration of the logging library. Such externalization allows users to customize certain facets of logging in a program (e.g., specify the location of log files, use custom loggers/handlers/formatters/filters) and, hence, ease the deployment and use of the program. We refer to this approach to configuration as data-based approach.
Configuring the library
Clients can configure the logging library by invoking logging.config.dictConfig(config: Dict) function. The config argument is a dictionary and the following optional keys can be used to specify a configuration.
filters key maps to a dictionary of strings and dictionaries. The strings serve as filter ids used to refer to filters in the configuration (e.g., adding a filter to a logger) while the mapped dictionaries serve as filter configurations. The string value of the name key in filter configurations is used to construct logging.Filter instances.
"filters": {
  "io_filter": {
    "name": "app.io"
  }
}
This configuration snippet results in the creation of a filter that admits all records created by the logger named ‘app.io’ or its descendants.
formatters key maps to a dictionary of strings and dictionaries. The strings serve as formatter ids used to refer to formatters in the configuration (e.g., adding a formatter to a handler) while the mapped dictionaries serve as formatter configurations. The string values of the datefmt and format keys in formatter configurations are used as the date and log entry formatting strings, respectively, to construct logging.Formatter instances. The boolean value of the (optional) validate key controls the validation of the format strings during the construction of a formatter.
This configuration snippet results in the creation of two formatters. A simple formatter with the specified log entry and date formatting strings and detailed formatter with specified log entry formatting string and default date formatting string.
handlers key maps to a dictionary of strings and dictionaries. The strings serve as handler ids used to refer to handlers in the configuration (e.g., adding a handler to a logger) while the mapped dictionaries serve as handler configurations. The string value of the class key in a handler configuration names the class to instantiate to construct a handler. The string value of the (optional) level key specifies the logging level of the instantiated handler. The string value of the (optional) formatter key specifies the id of the formatter of the handler. Likewise, the list of values of the (optional) filters key specifies the ids of the filters of the handler. The remaining keys are passed as keyword arguments to the handler’s constructor.
This configuration snippet results in the creation of two handlers:
A stderr handler that formats log requests with INFO and higher logging level log via the simple formatter and emits the resulting log entry into the standard error stream. The stream key is passed as keyword arguments to logging.StreamHandler constructor. The value of the stream key illustrates how to access objects external to the configuration. The ext:// prefixed string refers to the object that is accessible when the string without the ext:// prefix (i.e., sys.stderr) is processed via the normal importing mechanism. Refer to Access to external objects for more details. Refer to Access to internal objects for details about a similar mechanism based on cfg:// prefix to refer to objects internal to a configuration.
An alert handler that formats ERROR and CRITICAL log requests via the detailed formatter and emails the resulting log entry to the given email addresses. The keys mailhost, formaddr, toaddrs, and subject are passed as keyword arguments to logging.handlers.SMTPHandler’s constructor.
loggers key maps to a dictionary of strings that serve as logger names and dictionaries that serve as logger configurations. The string value of the (optional) level key specifies the logging level of the logger. The boolean value of the (optional) propagate key specifies the propagation setting of the logger. The list of values of the (optional) filters key specifies the ids of the filters of the logger. Likewise, the list of values of the (optional) handlers key specifies the ids of the handlers of the logger.
This configuration snippet results in the creation of two loggers. The first logger is named app, its threshold logging level is set to WARNING, and it is configured to forward log requests to stderr and alert handlers. The second logger is named app.io, and its threshold logging level is set to INFO. Since a log request is propagated to the handlers associated with every ascendant logger, every log request with INFO or a higher logging level made via the app.io logger will be propagated to and handled by both stderr and alert handlers.
root key maps to a dictionary of configuration for the root logger. The format of the mapped dictionary is the same as the mapped dictionary for a logger.
incremental key maps to either True or False (default). If True, then only logging levels and propagate options of loggers, handlers, and root loggers are processed, and all other bits of the configuration is ignored. This key is useful to alter existing logging configuration. Refer to Incremental Configuration for more details.
disable_existing_loggers key maps to either True (default) or False. If False, then all existing non-root loggers are disabled as a result of processing this configuration.
Also, the config argument should map the version key to 1.
Here’s the complete configuration composed of the above snippets.
The configuration schema for filters supports a pattern to specify a factory function to create a filter. In this pattern, a filter configuration maps the () key to the fully qualified name of a filter creating factory function along with a set of keys and values to be passed as keyword arguments to the factory function. In addition, attributes and values can be added to custom filters by mapping the . key to a dictionary of attribute names and values.
For example, the below configuration will cause the invocation of app.logging.customFilterFactory(startTime='6PM', endTime='6AM') to create a custom filter and the addition of local attribute with the value True to this filter.
Configuration schemas for formatters, handlers, and loggers also support the above pattern. In the case of handlers/loggers, if this pattern and the class key occur in the configuration dictionary, then this pattern is used to create handlers/loggers. Refer to User-defined Objects for more details.
Configuring using Configparse-Format Files
The logging library also supports loading configuration from a configparser-format file via the <a href="https://docs.python.org/3/library/logging.config.html#logging.config.fileConfig" target="_blank" rel="noopener noreferrer">logging.config.fileConfig() function. Since this is an older API that does not provide all of the functionalities offered by the dictionary-based configuration scheme, the use of the dictConfig() function is recommended; hence, we’re not discussing the fileConfig() function and the configparser file format in this tutorial.
Configuring over the wire
While the above APIs can be used to update the logging configuration when the client is running (e.g., web services), programming such update mechanisms from scratch can be cumbersome. The logging.config.listen() function alleviates this issue. This function starts a socket server that accepts new configurations over the wire and loads them via dictConfig() or fileConfig() functions. Refer to logging.config.listen() for more details.
Loading and storing configuration
Since the configuration provided to dictConfig() is nothing but a collection of nested dictionaries, a logging configuration can be easily represented in JSON and YAML format. Consequently, programs can use the json module in Python’s standard library or external YAML processing libraries to read and write logging configurations from files.
For example, the following snippet suffices to load the logging configuration stored in JSON format.
import json, logging.config

with open('logging-config.json', 'rt') as f:
  config = json.load(f)
  logging.config.dictConfig(config)
Limitations
In the supported configuration scheme, we cannot configure filters to filter beyond simple name-based filtering. For example, we cannot create a filter that admits only log requests created between 6 PM and 6 AM. We need to program such filters in Python and add them to loggers and handlers via factory functions or the addFilter() method.
Python logging performance
While logging statements help capture information at locations in a program, they contribute to the cost of the program in terms of execution time (logging statements in loops) and storage (logging lots of data). Although cost-free yet useful logging is impossible, we can reduce the cost of logging by making choices that are informed by performance considerations.
Configuration-based considerations
After adding logging statements to a program, we can use the support to configure logging (described earlier) to control the execution of logging statements and the associated execution time. In particular, consider the following configuration capabilities when making decisions about logging-related performance.
Change logging levels of loggers: This change helps suppress log messages below a certain log level. This helps reduce the execution cost associated with unnecessary creation of log records.
Change handlers: This change helps replace slower handlers with faster handlers (e.g., during testing, use a transient handler instead of a persistent handler) and even remove context-irrelevant handlers. This reduces the execution cost associated with unnecessary handling of log records.
Change format: This change helps exclude unnecessary parts of a log record from the log (e.g., exclude IP addresses when executing in a single node setting). This reduces the execution cost associated with unnecessary handling of parts of log records.
The above changes the range over coarser to finer aspects of logging support in Python.
Code-based considerations
While the support to configure logging is powerful, it cannot help control the performance impact of implementation choices baked into the source code. Here are a few such logging-related implementation choices and the reasons why you should consider them when making decisions about logging-related performance.
Do not execute inactive logging statements
Upon adding the logging module to Python’s standard library, there were concerns about the execution cost associated with inactive logging statements — logging statements that issue log requests with logging level lower than the threshold logging level of the target logger. For example, how much extra time will a logging statement that invokes logger.debug(...) add to a program’s execution time when the threshold logging level of logger is logging.WARN? This concern led to client-side coding patterns (as shown below) that used the threshold logging level of the target logger to control the execution of the logging statement.
# client code
...
if logger.isEnabledFor(logging.DEBUG):
    logger.debug(msg)
...
Today, this concern is not valid because the logging methods in the logging.Logger class perform similar checks and process the log requests only if the checks pass. For example, as shown below, the above check is performed in the logging.Logger.debug method.
Consequently, inactive logging statements effectively turn into no-op statements and do not contribute to the execution cost of the program.
Even so, one should consider the following two aspects when adding logging statements.
Each invocation of a logging method incurs a small overhead associated with the invocation of the logging method and the check to determine if the logging request should proceed, e.g., a million invocations of logger.debug(...) when threshold logging level of logger was logging.WARN took half a second on a typical laptop. So, while the cost of an inactive logging statement is trivial, the total execution cost of numerous inactive logging statements can quickly add up to be non-trivial.
While disabling a logging statement inhibits the processing of log requests, it does not inhibit the calculation/creation of arguments to the logging statement. So, if such calculations/creations are expensive, then they can contribute non-trivially to the execution cost of the program even when the corresponding logging statement is inactive.
Do not construct log messages eagerly
Clients can construct log messages in two ways: eagerly and lazily.
The client constructs the log message and passes it on to the logging method, e.g., logger.debug(f'Entering method Foo: {x=}, {y=}'). This approach offers formatting flexibility via f-strings and the format() method, but it involves the eager construction of log messages, i.e., before the logging statements are deemed as active.
The client provides a printf-style message format string (as a msg argument) and the values (as a args argument) to construct the log message to the logging method, e.g., logger.debug('Entering method %s: x=%d, y=%f', 'Foo', x, y). After the logging statement is deemed as active, the logger constructs the log message using the string formatting operator %. This approach relies on an older and quirky string formatting feature of Python but it involves the lazy construction of log messages.
While both approaches result in the same outcome, they exhibit different performance characteristics due to the eagerness and laziness of message construction.
For example, on a typical laptop, a million inactive invocations of logger.debug('Test message {0}'.format(t)) takes 2197ms while a million inactive invocations of logger.debug('Test message %s', t) takes 1111ms when t is a list of four integers. In the case of a million active invocations, the first approach takes 11061ms and the second approach took 10149ms. A savings of 9–50% of the time taken for logging!
So, the second (lazy) approach is more performant than the first (eager) approach in cases of both inactive and active logging statements. Further, the gains would be larger when the message construction is non-trivial, e.g., use of many arguments, conversion of complex arguments to strings.
Do not gather unnecessary under-the-hood information
By default, when a log record is created, the following data is captured in the log record:
Identifier of the current process.
Identifier and name of the current thread.
Name of the current process in the multiprocessing framework.
Filename, line number, function name, and call stack info of the logging statement.
Unless these bits of data are logged, gathering them unnecessarily increases the execution cost. So, if these bits of data will not be logged, then configure the logging framework to not gather them by setting the following flags.
logging.logProcesses = False
logging.logThreads = False
logging.logMultiProcessing = False
logging._srcFile = None
Do not block the main thread of execution
There are situations where we may want to log data in the main thread of execution without spending almost any time logging the data. Such situations are common in web services, e.g., a request processing thread needs to log incoming web requests without significantly increasing its response time. We can tackle these situations by separating concerns across threads: a client/main thread creates a log record while a logging thread logs the record. Since the task of logging is often slower as it involves slower resources (e.g., secondary storage) or other services (e.g., logging services such as Coralogix, pub-sub systems such as Kafka), this separation of concerns helps minimize the effort of logging on the execution time of the main/client thread.
The Python logging library helps handle such situations via the QueueHandler and QueueListener classes as follows.
A pair of QueueHandler and QueueListener instances are initialized with a queue.
When the QueueHandler instance receives a log record from the client, it merely places the log request in its queue while executing in the client’s thread. Given the simplicity of the task performed by the QueueHandler, the client thread hardly pauses.
When a log record is available in the QueueListener queue, the listener retrieves the log record and executes the handlers registered with the listener to handle the log record. In terms of execution, the listener and the registered handlers execute in a dedicated thread that is different from the client thread.
Note: While QueueListener comes with a default threading strategy, developers are not required to use this strategy to use QueueHandler. Instead, developers can use alternative threading strategies that meet their needs.
That about wraps it up for this Python logging guide. If you’re looking for a log management solution to centralize your Python logs, check out our easy-to-configure Python integration.
Distributed microservices and cloud computing have been game changers for developers and enterprises. These services have helped enterprises develop complex systems easily and deploy apps faster.
That being said, these new system architectures have also introduced some modern challenges. For example, monitoring data logs generated across various distributed systems can be problematic.
With strong log monitoring tools and strategies in your developer’s toolkit, you’ll be able to centralize, monitor and analyze any wealth of data. In this article, we’ll first go over different log management issues you could potentially face down the line, and how to effectively overcome each one along the way.
Common log management problems
Monitoring vast data logs across a distributed system poses multiple challenges. When talking about a full-stack observability guide, here are some of the most common log management issues, and ways to fix them.
1. Your log management system is too complex
Overcomplexity is one of the primary causes of inefficient log systems. Traditional log monitoring tools are designed to handle data in a single monolithic system. Therefore, cross-platform interactions and integrations require the aid of third-party integration apps.
In the worst-case scenario, you might have to implement different integration procedures for different platforms to understand disparate outputs. This complicates your log monitoring system and drives up maintenance costs.
Coralogix resolves this with a simple, centralized, and actionable log dashboard built for maximum efficiency. With a clear and simple graphical representation of your logs, you can easily drill down and identify issues.
2. Dealing with an overwhelming amount of data
Traditional legacy and modern cloud computing systems often produce vast amounts of unstructured data. Not just that, these different data formats are often incompatible with each other, resulting in data silos and hindered data integration efforts. The incompatibility between various data formats poses significant challenges for businesses in terms of data management, analysis, and decision-making processes.
Data volume also drives up the cost of traditional monitoring strategies. As your system produces more data, you will have to upgrade your monitoring stack to handle the increased volume. Having a modern log observability and monitoring tool can help you manage this data effectively.
You need an automated real-time log-parsing tool that converts data logs into structured events. These structured events can help you extract useful insights into your system’s health and operating conditions.
3. Taking too long to fix system bugs, leading to downtime
Log data is extremely useful for monitoring potential threats, containing time-stamped data of system conditions when incidents occur. However, the lack of visibility in distributed systems can make systems logs with bugs difficult to pinpoint.
Therefore, you often have to spend a lot of time shifting through large amounts of data to system bugs. The longer it takes to find the bugs, the higher the likelihood that your system might face downtime. Modern distributed systems make this even harder, since system elements are scattered across many platforms.
Coralogix’s real-time log monitoring dashboard helps you streamline this by providing a centralized view of the layers of connections between your distributed systems. This makes it possible to monitor and trace the path of individual requests and incidents without combing through tons of data logs.
With this, you can greatly improve the accuracy of your log monitoring efforts, identify and resolve bugs faster and reduce the frequency of downtimes in your system.
4. Be proactive to prevent problems
Threat hunting and incident management is another common log monitoring problem. Traditional log monitoring software makes detecting threats in real time and deflecting them nearly impossible.
In some situations, you only become aware of a threat after the system experiences downtime. Downtime has massive detrimental effects on a business, leading to loss of productivity, revenue and customer trust. Real-time log monitoring helps you resolve this by actively parsing through your data logs in real time and identifying unusual events and sequences.
With a tool like Coralogix’s automated alerting system and AI prevention mechanism for log management, you can set up active alerts that are triggered by thresholds. The AI sets off alerts when your system encounters a previously unknown threshold. Thus, you can prevent threats before they affect your system.
Simplifying your log management system for better efficiency
Log monitoring is an essential task for forward-facing enterprises and developers. The simpler your log monitoring system, the faster you can find useful information from your data logs.
However, the data size involved in log management might make it challenging to eliminate problems manually. There are different log monitoring dashboards that can streamline your entire log monitoring journey. Choose the right one for your business.
In today’s fast-paced and highly-competitive gaming industry, providing a seamless and enjoyable gaming experience is essential to retain users. Games need to be responsive, offer high-resolution graphics, continuous uptime, and handle a huge amount of transactions through log monitoring.
Having strong log analytics solution is essential to improve performance, identify issues, and fine-tune the player experience. From gameplay patterns to errors and failures across different layers of the software stack, logs provide valuable insights into various aspects of the game. These raw data points enable game developers to stay ahead of the curve by addressing bugs promptly and improving the game’s design.
That being said, with the sheer volume of data generated, you’ll need the right tools and strategies in place to parse through the noise and identify relevant information. This article will go over the different sources of logs, why they are important for the gaming industry and the insights they provide.
Sources of gaming logs
A primary source of system logs is the game engine used to build the game. The game engine captures data related to physics, rendering and game architecture. Each engine has its own way of enabling logs and configuring them, which can be found in the documentation.
There are different levels of log severity, such as “error” or “fatal” that happen when an error causes the game to crash, and “warning” which signals unwanted behavior or “info,” indicating a triggered action.
System logs are also collected by the build system that assembles the game. Logs are essential for smooth releases or deployments of the game, since they collect data about successes and issues encountered during the build process.
The game server is another significant source of logs and includes server containers, serverless functions, proxies, and CDNs, all of which are involved in delivering the game. The servers record data on user sessions, authentication, matchmaking, and in-game transactions, helping improve player experience by reducing latency, enhancing matchmaking algorithms and guaranteeing the security of user data. These improvements not only have an impact on player experience but also user retention, especially for online games.
The game’s client-side logs generated on the player’s device offer insights into in-game events, user interactions and errors encountered during gameplay. These system logs provide information that can be used to identify and fix bugs, rectify performance issues that may be specific to certain devices, operating systems or hardware configurations. This is particularly helpful for games with high-quality graphics since game developers need to get access to screen size and resolution as well as OS information to understand which aspects of the system are affecting rendering speed.
In some cases, games may rely on third-party integrations, for example for payment processing. These integrations can also provide logs, which become particularly critical if the third-party integration can strongly affect the performance of the game or deals with sensitive data. Lastly, the telemetry data generated during gameplay captures information about player actions, decisions and preferences and can help adjust the game mechanics.
Gaming insights with log management software
A complex game can generate terabytes of logs in a relatively short period of time. It is incredibly difficult and time-consuming for an operations team to create systems from scratch to collect all the logs coming from different sources, sort through them and extract essential information. Thankfully, log management software can help overcome the challenge
Log management software offers a powerful log monitoring solution to analyze and interpret the huge amounts of data generated by the different sources of logs. The software can collect and aggregate logs in one place – and analyze them to derive valuable insights to improve the overall gaming experience. For example, some insights include identifying and resolving performance bottlenecks, uncovering potential security vulnerabilities, and pinpointing root causes of bugs or crashes.
Furthermore, they allow proactive monitoring of uptime, a vital metric for user retention. By analyzing telemetry data, log management software can also help to better understand user behavior, preferences, and engagement patterns. As a result, game developers can make data-driven decisions to refine gameplay, balance game mechanics, and optimize level design.
Log management tools assist in monitoring the efficiency of server infrastructure, ensuring optimal matchmaking and reducing latency, all of which contribute to a smoother and more enjoyable experience for the players. Overall, log management software plays a pivotal role in turning raw log data into invaluable insights, thus empowering developers to create better games and maintain high levels of player satisfaction.
Another crucial aspect of log management is addressing the signal-to-noise ratio A log management platform assists in filtering out irrelevant information, allowing developers to focus on the most pertinent data. The process becomes more efficient through the use of advanced features, such as log tagging, parsing, and customizable dashboards, which facilitate quicker identification of patterns, trends, and anomalies.
Wrapping up
Logs are critical in the gaming industry, providing insights into game performance, user experience, and potential issues across the software stack.
Log management software is essential for efficiently collating, aggregating, and analyzing logs from multiple sources, such as game engines, build systems, servers, client devices, third-party integrations, and telemetry data.
Log management software enables developers to extract meaningful insights from large amounts of data, addressing performance bottlenecks, monitoring uptime, uncovering security vulnerabilities, and refining gameplay mechanics.
Log management software also helps developers to address the signal-to-noise ratio, making it easier to focus on relevant information and improve the gaming experience.
In modern observability, Lucene is the most commonly used language for log analysis. Lucene has earned its place as a query language. Still, as the industry demands change and the challenge of observability grows more difficult, Lucene’s limitations become more obvious.
How is Lucene limited?
Lucene is excellent for key value querying. For example, if I have a log with a field userId and I want to find all logs pertaining to the user Alex, then I can run a simple query: userId: Alex.
To understand Lucene limitations, ask a more advanced question: Who are the top 10 most active users on our site? Unfortunately, this is complex, requiring functionality that is not found in Lucene. So something new is necessary at this point. More than just a query language, observability needs a syntax that will help us explore new insights within our data.
DataPrime – The Full Stack Observability Syntax
DataPrime is the Coralogix query syntax that allows users to explore their data, perform schema on read transformations, group and aggregate fields, extract data, and much more. Let’s look at a few examples.
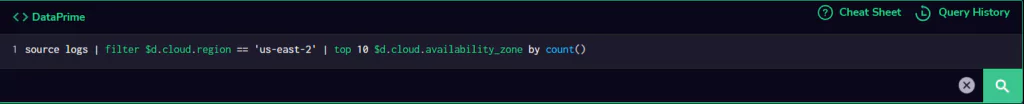
Aggregating Data – “Who are our Top 10 most active users?”
To answer a question like this, let’s break down our problem into stages:
First, filter the data by logs that indicate “activity”
Aggregate our data to count the logs
Sort the results into descending order
Limit the response to only the top 10
Most of these activities are completely impossible in Lucene, so let’s explore how they look in DataPrime:
DataPrime transforms this complex problem into a flattened series of processes, allowing users to think about their data as it transforms through their query rather than nesting and forming complex hierarchies of functionality.
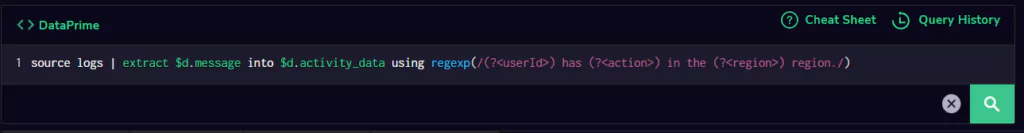
Extracting Embedded Data – “How do we analyze unstructured strings?”
Extracting data in DataPrime is entirely trivial, using the extract command. This command allows users to transform unstructured data into parsed objects that are included as part of the schema (a capability known as schema on read). Extract supports a number of methods:
JSON parsing will take unparsed JSON and add it to the schema of the document
The key-value parser will automatically process key value pairs, using custom delimiters
The Regex parser will allow users to define lookup groups to specify exactly where keys are in unstructured data.
The following example shows how simple it is to use regular expressions to capture multiple values from unstructured data.
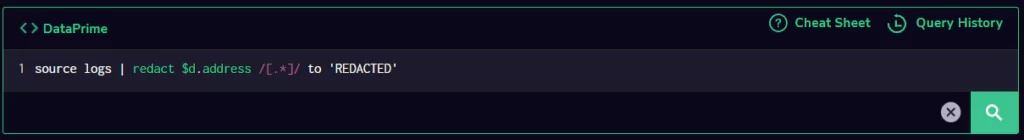
Redacting – “We want to generate a report, but there’s sensitive data in here.”
Logs often contain personal information. A common solution to this problem is to extract the data, redact it in another tool and send the redacted version. All this does is copy personal data and increase the attack surface. Instead, use DataPrime to redact data as it’s queried.
This makes it impossible for data to leak out of the system, and helps companies analyze their data while maintaining data integrity and confidentiality.
DataPrime Changes how Customers Explore Their Data
With access to a much more sophisticated set of tools, users can explore and analyze their data like never before. Don’t settle for simple queries and complex syntax. Flatten your processing, and generate entirely new fields on the fly using DataPrime.
IoT has rapidly moved from a fringe technology to a mainstream collection of techniques, protocols, and applications that better enable you to support and monitor a highly distributed, complex system. One of the most critical challenges to overcome is processing an ever-growing stream of analytics data, from IoT security data to business insights, coming from each device. Many protocols have been implemented for this, but could logs provide a powerful option for IoT data and IoT monitoring?
Data as the unit of currency
The incredible power of a network of IoT devices comes from the sheer volume and sophistication of the data you can gather. All of this data can be combined and analyzed to create actionable insights for your business and operations teams. This data is typically time-series data, meaning that snapshots of values are taken at time intervals. For example, temperature sensors will regularly broadcast updated temperatures with an associated timestamp. Another example might be the number of requests to non-standard ports when you’re concerned with IoT security. The challenge is, of course, how to transmit this much data to a central server, where it can be processed. IoT data collection typically produces a large volume of information for a centralized system to process.
The thing is, this is already a very well-understood problem in the world of log analytics. We typically have hundreds, if not thousands, of sources (virtual machines, microservices, operating system logs, databases, load balancers, and more) that are constantly broadcasting information. IoT software doesn’t pose any new challenges here! Conveniently, logs are almost always broadcast with an associated timestamp too. Rather than reinventing the wheel, you can simply use logs as your vehicle for transmitting your IoT data to a central location.
Using the past to predict the future
When your data is centralized, you can also begin to make predictions. For example, in the world of IoT security, you may wish to trigger alarms when certain access logs are detected on your IoT device because they may be the footprint of a malicious attack. In a business context, you may wish to conclude certain trends in your measurements, for example, if the temperature has begun to increase on a thermostat sharply, and its current trajectory means it’s going to exceed operational thresholds soon. It’s far better to tell the user before it happens than after it has already happened.
This is regularly done with log analytics and metrics. Rather than introducing highly complex and sophisticated time-series databases into your infrastructure, why not leverage the infrastructure you already have?
You’ll need your observability infrastructure anyway!
When you’re building out your complex IoT system, you’re inevitably going to need to build out your observability stack. With such a complex, distributed infrastructure, IoT monitoring and the insights it brings will be essential in keeping your system working.
This system will need to handle a high volume of traffic and will only increase when your logging system is faced with the unique challenges of IoT software. For example, logs indicate the success of a firmware rollout across thousands of devices worldwide. This is akin to having thousands of tiny servers that must be updated. Couple that with the regular operating logs that a single server can produce, which should put your IoT monitoring challenge into perspective.
Log analytics provide a tremendous amount of information and context that will help you get to the bottom of a problem and understand the overall health of your system. This is even more important when you consider that your system could span across multiple continents, with varying degrees of connectivity, and these devices may be moving around, being dropped, or worse! Without a robust IoT monitoring stack that can process the immense volumes associated with IoT data collection, you’re going to be left confused as to why a handful of your devices have just disappeared.
Improving IoT Security
With this increased observability comes the power to detect and mitigate security threats immediately. Take the recent Log4Shell vulnerability. These types of vulnerabilities that exist in many places are challenging to track and mitigate. With a robust observability system optimized for the distributed world of IoT security, you will already have many of the tools you need to avoid these kinds of serious threats.
Your logs are also in place for as long as you like, with many long-term archiving options if you need them. This means that you can respond instantly, and you can reflect on your performance in the long term, giving you vital information to inspect and adapt your ways of working.
Conclusion
IoT security, observability, and operational success are a delicate balance to achieve, but what we’ve explored here is the potential for log analytics to take a much more central role than simply an aspect of your monitoring stack. A river of information, from your devices, can be analyzed by a wealth of open source and SaaS tools and provide you with actionable insights that can be the difference between success and failure.
When you’re working with large data sets, having that data structured in a way that means you can use software to process and understand it will enable you to derive insights far more quickly than any manual approach. Logfile data is no exception.
As increasing numbers of organizations embrace the idea that log files can offer far more than an aid to troubleshooting or a regulatory requirement, the importance of log file monitoring and structuring the data in those log files so that it can be extracted, manipulated, and analyzed efficiently is quickly moving up the priority list. In this article, we’re going to explore one of the most popular formats for structuring log files: JSON.
What is JSON?
JSON, or JavaScript Object Notation to give it its full form, is a machine-readable syntax for encoding and exchanging data. Despite the name, you’ll find JSON in use far outside its original realm of web servers and browsers. With all major computing languages supporting it, JSON is one of the most widely used formats for exchanging data in machine-to-machine communications.
One of the advantages of JSON over other data exchange formats, such as XML, is that it’s easy for us humans to both read and write. Unlike XML, JSON doesn’t rely on a complex schema and completely avoids the forest of angle brackets that results from requiring everything to be enclosed within tags. This makes it much easier for first-time users to get started with JSON.
A JSON document is made up of a simple syntax of key-value pairs ordered and nested within arrays. For example, a key called “status” might have values “success,” “warning,” and “error.” Keys are defined within the document and are always quoted, meaning there are no reserved words to avoid, and arrays can be nested to create hierarchies.
That means you can create whatever keys make sense for your context, and structure them however you need. The keys and how they are nested (the JSON specification) need to be agreed upon between the sender and the recipient, which can then read the file and extract the data as required.
The simplicity and flexibility of JSON make it an ideal candidate for generating structured log statements; log data can be extracted and analyzed programmatically, while the messages remain easy for individuals to understand. JSON logging is supported by all major programming languages, either natively or via libraries.
Benefits of JSON logging
Given that log messages are always generated by software, you might expect that they are always structured and be wondering what JSON can add. While it’s true that log messages will always follow a particular syntax (in accordance with how the software has been programmed to output logs), that syntax could be one long string of characters, multiple lines of obscure codes and statuses, or a series of values delimited by a character of the programmer’s choice.
In order to make sense of these logs, you first need to decipher their syntax and then write logic to parse the messages and extract the data you need. Unfortunately, that logic is often quite brittle, so if something changes in the log format – perhaps a new piece of data is included, or the order of items is changed – then the parser will break.
If you’re only dealing with logs from a single system that you have control over, that might be manageable. But the reality in many enterprises is that you’re working with multiple systems and services, some developed in-house and others that are open-source or commercial, and all of them are generating log messages.
Those log messages are a potential mine of information that can be used to gain insights into how your systems – and therefore your business – are performing. However, before you can derive those insights, you first need to make sense of the information that is being provided. Writing and maintaining custom logic to parse logs for dozens of pieces of software is no small task.
That’s where a structured format such as JSON can help. The key-value pairs make it easy to extract specific values and to filter and search across a data set. If new key-value pairs are added, the software parsing the log messages will just ignore those keys it doesn’t expect, rather than failing completely.
Writing logs in JSON format
So what does a log message written in JSON look like? The following is an example log line generated by an Nginx web server and formatted in JSON:
With the JSON format, it’s easy for someone unfamiliar with web server logs to understand what the message contains, as each field is labeled. With a common log format, you need to know what you’re looking at.
Of course, common log format is widely used by web servers, and most log analysis platforms can parse it natively, without further manual configuration. But what about log files generated by other software, such as a custom-built application or third-party software? Looking at this unstructured log file from an iOS application you’d be forgiven for wondering what it’s telling you:
08:51:08 [DataLogger:27]: G L 35.76 +/- 12m <+52.55497710,-0.38856690> +/- 15.27m 0.60
With this format, it’s easy to understand the values and see how the fields are related.
JSON logging best practices
Now that we’ve covered the what, why, and how of JSON logging, let’s discuss some tips to help you get the most out of your JSON logs. Most of these apply whether you’re writing software in-house or are using third-party or open-source tools that allow you to configure the format of the logs they output.
Invest time in designing your logs
Just as you wouldn’t jump in and start writing code for the next ticket on the backlog without first thinking through the problem you’re trying to solve and how it fits into the wider solution, it’s important to take the time to design your log format. There is no standard format for JSON logs – just the JSON syntax – so you can decide on a structure to serve your needs.
When defining keys, think about what level of granularity makes sense. For example, do you need a dedicated “error” key, or is it more useful to have a key labeled “message” that is used for any type of message, and another labeled “status” that will record whether the message was an error, warning, or just information? With the latter approach, you can filter log data by status to view only error messages while reducing the number of columns and filter options.
Add log lines as you code
If you’re developing software in-house, make adding log lines as much a part of your code hygiene as writing unit tests. It’s much easier to decide what information would be useful to output, and at what level (for example, is this a critical error or just useful to know when debugging) when you’re writing that particular piece of functionality, than after you’ve finished the development work.
Capture as much detail as possible
When you’re thinking about what data to capture, it’s easy to focus on the parameters you want to be able to filter, sort, and query by, while losing sight of what you might want to learn from your logs when drilling down into more detail.
Log files provide value on both a macro and micro level: by aggregating and analyzing log files, we can identify patterns of behavior and spot changes that might indicate a problem. Once we know where to look, we can zoom into the individual log files to find out more about what’s going on. This is where capturing as much detail as possible pays dividends.
For application logs, details such as the module name and line number will help you identify the cause of the problem quickly. In the case of server access logs, details such as the requester’s IP, their time zone, logged-in username, and authentication method can be invaluable when investigating a potential security breach.
Keep in mind that not all data needs to be broken down into separate fields; you can create a key to capture more verbose information that you wouldn’t want to filter by, but which is useful when reading individual log messages.
Consistency is king
Being consistent in the way you name keys and the way you record values will help you to analyze logs more efficiently. This applies both within a single piece of software and when designing logs across multiple systems and services.
For example, using the same set of log levels across applications means you can easily filter by a particular type while being consistent in writing status codes, as either strings or numbers will ensure you can manipulate the data effectively.
Unstructured logs – parsing to JSON
Although structuring logs with JSON offers many advantages, in some cases it’s not possible to output logs in this format. For some third-party software, you may not have the ability to configure the format or content of log messages.
If you’re dealing with a legacy system plagued with technical debt, the effort involved in updating the logging mechanism might not be justified – particularly if work on a replacement is underway.
When you’re stuck with an existing unstructured log format, the next best thing is to parse those logs into a JSON format after the fact. This involves identifying the individual values within each message (using a regular expression, for example) and mapping them to particular keys.
Many log analysis platforms allow you to configure rules for parsing unstructured logs to JSON so that they can be processed automatically. You can then analyze the data programmatically alongside your structured log data. Transforming logs to JSON also renders the individual log files more readable to humans, ready for when you want to drill down in more detail.
JSON log analytics with Coralogix
By structuring your logs in JSON format you can more effectively analyze log files from multiple sources and leverage machine learning techniques to identify trends and anomalies in your data. Because JSON is easy to read, you can still view and understand individual log entries when investigating and troubleshooting issues.
As a log analysis and observability platform, Coralogix automatically extracts fields from your JSON logs so that you can filter, sort, query, and visualize according to your JSON log file viewer. With custom views, you can configure reports based on the fields you’re interested in. For unstructured logs, you can set up log parsing rules to extract values and append the JSON to the log entry, or replace the entire entry with structured JSON, according to your needs. Using the Coralogix log analytics platform you can collate and aggregate logs from multiple sources and use sophisticated data analysis tools to improve your understanding of your systems and unlock valuable insights.
The log4j vulnerability gives hackers the ability to type a specific string into a message box and execute a malicious attack remotely, this can include installing malware, stealing user data, and more. It was originally discovered in Minecraft on December 9, which was officially announced to the world as a zero-day critical-severity exploit in the log4j2 logging library, CVE-2021-44228, also known as “Log4Shell.”
As soon as we heard of the vulnerability, we pulled our team in and began working on a solution to ensure our systems and customers would not be at risk. So, how did we do it?
A Plan of Attack Defense
According to the initial reports on how to mitigate the vulnerability, log4shell is mitigated in one of three ways:
The vulnerability is partially mitigated by ensuring that your JVM-based services are running an up-to-date version of the JVM.
Where possible, the log4j2 library itself should be updated to 2.15
If the JVM-based service is running a version of log4j2 that is at least 2.10, then the JVM can be run with the flag -Dlog4j2.formatMsgNoLookups=true. Otherwise, the log4j2 properties file can be rewritten such that, in each case where a logging pattern of %m is configured, it can be replaced by %m{nolookups}.
Of course, this results in three equally tricky questions:
How can we quickly upgrade our JVM services to use a patched JVM?
Where are all of our usages of `log4j2` across our system?
Where do we need to rely on changing JVM flags or log4j2.properties files, and how can we efficiently make those changes?
Where were we vulnerable?
JVM
At Coralogix, our infrastructure is based on Kubernetes, and all of our services run on our Kubernetes clusters. We follow containerization best practices and ensure our services are built on top of a series of “base images,” some including the JVM.
To patch our JVMs across production, we opened a pull request that brought each of our JVM-based base images up to date, pushed them, and then triggered new builds and deploys for the rest of our services.
log4j
First, let’s distinguish between services that we built in-house and services provided by our vendors.
At Coralogix, we practice the engineering value that everything we run in production must be written in code somewhere and version-controlled. In the event of a vulnerability like log4shell, this makes it simple to come up with all the places that used log4j, by writing a simple script that:
Iterates over each of our code repositories and clones them locally
Searches the code base for the string `org.apache.logging.log4j`
If the repository has that string, then add it to a list of repositories that need to be updated.
By notifying all of our R&D to repositories list that requires updating, we quickly mobilized all of our developers to take immediate action to patch the library in the repositories for which they are responsible. This helped us promptly update hundreds of JVM-based microservices to log4j2-2.15.0 in a matter of hours.
As for the services that our vendors provide, our platform team has a shortlist of such services. As such we were able to quickly review the list, see which services were vulnerable (i.e., services that are not JVM-based are not vulnerable), and manually put the fix in for each one and push to production.
What did we learn from log4shell?
a) We own our stack from top to bottom.
The MIT open-source license clearly states, in all capital letters, THE SOFTWARE IS PROVIDED “AS IS”, WITHOUT WARRANTY OF ANY KIND, EXPRESS OR IMPLIED. Nowhere does this become painfully apparent until a major vulnerability hits, your vendors are incommunicado, and you’re a sitting duck. When a major security vulnerability is published, we need to be able to quickly take responsibility for each element of our stack, locally fork the code if necessary, and get a fix out the door quickly.
b) There are significant benefits to having a small, tight-knit engineering team.
As we verified that we were fully secure, many larger industry players were already visibly suffering publicly-visible, embarrassing attacks. By quickly reaching every developer in R&D with the exact knowledge of what they needed to do and why it was important to be done quickly, we were able to leverage more manpower than most organizations that only making it the responsibility of security teams to get their systems secure.
To learn more about how we pushed through this challenge, you can check our status page.
When teams begin to analyze their logs, they almost immediately run into a problem and they’ll need some JSON logging tips to overcome them. Logs are naturally unstructured. This means that if you want to visualize or analyze your logs, you are forced to deal with many potential variations. You can eliminate this problem by logging out invalid JSON and setting the foundation for log-driven observability across your applications.
Monitoring logs in JSON is powerful, but it comes with its own complications. Let’s get into our top JSON logging tips and how they can help.
1. JSON Validation
Of all the JSON logging tips in this document, this one is the least often implemented. Once you’re producing JSON in your logs, you’ll need to ensure that the JSON you’re generating can be validated. For example, if you want to run your logs through some analysis, you must ensure that a given field exists. If it does not exist, the log can be rejected or simply skipped.
This validation stage helps to ensure that the data you’re analyzing meets some basic requirements, which in turn makes your analysis simpler. The most common approach to validating a JSON object is to use a JSON schema, which has been implemented in dozens of languages and frameworks.
2. Add Context to your JSON Logging Statements
A log statement can announce that a given event has happened, but it can be challenging to understand its significance even without context. Context gives the bigger picture, which helps you draw connections between many log statements to understand what is going on.
For example, if you’re logging out a user’s journey through your website, you may wish to include a sessionId field to make it easy to understand that each event is part of the same session.
{ level: "INFO", message: "User has added Item 12453 to Basket", sessionId: "SESS456", timestamp: 1634477804}
3. Remove Whitespace from your JSON Logs
When logging out in JSON, you need to ensure that you’re not filling up valuable disk space with whitespace. More often than not, this whitespace will not add much readability to your logs. It’s far better to compress your JSON logs and focus on using a tool to consume and analyze your data. This may seem like one of the more obvious JSON logging tips, but in reality, people regularly forget it.
4. Use Logging Levels and Additional Fields
As well as contextual information, you need some basic information in your logs. This is one of the most often ignored JSON logging tips. For example, you can include log levels in your JSON logs. Log levels can be set to custom values, but the standard convention is to use one of the following: TRACE, DEBUG, INFO, WARN, ERROR, and FATAL. Sticking to these conventions will simplify your operational challenge since you can look for any log line worse than ERROR across all of your applications if you need to solve serious incidents quickly.
In addition, you can include custom values in your JSON logs, such as appName or hostName. Working out which fields you need will be a little trial and error, but a log line that includes some basic fields about the logging source will make it far easier to zone in on the logs from a single microservice.
5. Log Errors And Behaviours
It’s tempting only to write logs whenever there are errors, but as we’ve seen above, logs are so much more potent than simply an error indicator. Logs can provide a rich understanding of your system and are a cornerstone of observability. You may wish to write logs for all sorts of critical events:
Whenever a user logs onto your site
Whenever a user purchases via your website, and what they’ve purchased
The duration a given user request took to complete in milliseconds
But how much should you log?
6. Plan for the Future
How much should you log? The question is a tricky one, but there is a basic truth. Provided you can query your logs effectively, you’re never going to be stuck because you have too much data. Conversely, if you don’t have enough data, there’s nothing you can do about it.
It is far better to have too much data and need to cut through the noise, which should inform your decision-making when it comes to your JSON logs. Be generous with your logs, and they will be kind to you when you’re troubleshooting a critical issue. Logs can capture a wide array of different events, and remember, if it’s not an important event, you can always set it to DEBUG or TRACE severity and filter it out in your analysis.
7. The Most important JSON Logging Tip: Start with JSON logging
If you’re looking at an empty project, it is far easier to begin with JSON logs than it is to fit JSON logging into your application retrospectively. For this reason, you may wish to consider starting with JSON logging. To make this easier, you can try:
Creating a boilerplate for new applications that come with JSON logging by default
Install a logging agent on your servers that automatically wrap log lines in JSON so that even if an application starts logging out raw strings, all your logs are still JSON.
Make use of libraries like MDC to ensure that specific values are always present in your JSON logs.
So what’s next with your JSON logging?
JSON logging is the start. Once you’ve got some solid JSON logs to work with, you can begin to visualize and analyze your logs in ways that were simply impossible before. You’ll be able to make use of Kibana to render information about your logs, drive alerts based on your JSON logs, and much more.
JSON logs will give you unprecedented insight into your system, and this will enable you to catch incidents sooner, recover faster, and focus on what’s important.
First of all, don’t ask this! Instead of asking what to log, we should start by asking “what questions do we want to answer?” Then, we can determine which data needs to be logged and monitored in order to best answer these questions.
Once a question comes up, we can answer it using only the data and knowledge that we have on hand. In emergent situations such as an unforeseen system failure, we cannot change the system to log new data to answer questions about the current state of the system.
This means that we must do our best to anticipate what information we’ll need to answer comprehensive questions about our system in the future.
So how do we know what data to log?
When we do not have precise questions, we can fall back on community knowledge and log data that help answer similar precise questions posed frequently in the community in the context of systems similar to our system.
This log data will be invaluable if our questions turn out to be the questions posed frequently in the community. If not, it can still provide valuable insights and guidance to determine improvements to the data being logged as well as the system itself.
It’s important to be proactive in collecting the data that you need, but in cases that we don’t achieve full coverage, we need to be agile to modify and deploy the system.
Common system aspects and questions of interest
In this post, we will explore common aspects of modern-day systems that are interesting to monitor based on community knowledge. We will also explore common questions pertaining to these aspects and the data needed to answer these questions.
Before we begin, a word of caution. While gathering more data may be helpful, excessive data collection can be detrimental to the performance of the system and, more importantly, raise concerns and risks about user security and privacy. So, exercise caution when gathering nice-to-have data.
The core aspects of any software system that should be monitored are functional correctness, performance, reliability, and security. Other domain-specific aspects include things such as scale and privacy. Each respective domain has its own set of questions that need to be answered. These are only a few examples:
1. Functional Correctness
Does the component perform the expected operations to service a request? (Operational Correctness)
Does the component consume and produce the expected data when servicing a request? (Data Correctness)
2. Performance
How long does the component take to service a request? (Latency)
How many requests does a component service in a second? (Throughput)
3. Reliability
How often does the component fail to service a request? (Failure Rate)
Are the failures uniform or sporadic? (Time between Failure)
When the system failed to service a request, what was the failure path through the system, i.e., the components, their states, and the features exercised during the failure? (Failure Path)
4. Security
Are the operations performed in and supported by the component compliant with security requirements? (Operational Compliance)
Are the data accessed and provided by the component compliant with security requirements? (Data Compliance)
Digging A Bit Deeper
Assuming we agree these aspects are commonly relevant, we will now dig a bit deeper into each aspect and corresponding questions.
In the following exposition, we will present ideas in the context of service-based systems where components/services serve as the basic compositional units and every request serviced by a component has a unique id. For clarity, we will use the term component instead of service.
Functional Correctness
With functional correctness, we are interested in a component doing what it promised to do.
More precisely, we are interested in the operational aspect and the data aspect of what a component does. For example, consider a component that promises to charge $25 to credit card X. The component exhibits operational correctness if it charges a credit card. The component exhibits data correctness if the involved amount is $25 and the credit card is X.
In general, a component exhibits operational correctness if it performs the expected operations to service a request and data correctness if it consumes and produces the expected data when servicing a request.
To monitor the functional correctness of a component, we need to monitor both the operational correctness and data correctness of the component. Consequently, we need to collect data to answer the following questions.
Does the component perform the expected operations to service a request?
Does the component consume and produce the expected data when servicing a request?
What should be logged?
Since a component may depend on other components in a system to service a request, monitoring for data and operational correctness of a component boils down to tracking what data (request payload) was consumed and provided by the component and what operations (requested operations) were requested by the component to service a request. With components possibly relying on other components to service a request, track every operation performed and data consumed and provided to service a request.
To answer the above questions, log every request, its id, and the corresponding response.
For the logged data to be useful, capture additional data that allows relating requests to each other (e.g., request qx triggered requests qy and qz), relating requests to responses (e.g, response sy corresponds to request qy), and recreate the global order of requests and responses (e.g., request qx was followed by request qy which was followed by response sy which was followed by request qz).
Since requests and response payloads may contain sensitive (e.g., private) information, make sure such sensitive information is appropriately handled and processed by the logging system and any downstream systems.
Performance
With performance, we are interested in a component being fast enough in doing what is promised to do.
In the context of service-based systems, this aspect has two facets: latency and throughput. Latency is the time taken by a component to service a request, i.e., the time between the component accepting a request and responding to the request.Throughput is the number of requests serviced (responded to) by a component in a second.
To monitor the performance of a component, we need to collect data to answer the following questions.
How long does the component take to service a request?
How many requests does a component service in a second?
What should be logged?
Unlike functional correctness, latency and throughput are local to a component, i.e., these aspects of a component can be measured independent of other components involved in the component’s function. However, since a component can depend on other components to service a request, we need to consider these aspects of other components to determine if and how they affect these characters of the dependent component.
To answer the above questions, for every request, log its id, the time when it was received, and the time when the corresponding response was provided.
As in the case of functional correctness, capture additional data that helps relate requests to their dependent requests. This data will help determine how the latency of one request directly or indirectly affects others within the system.
Reliability
With reliability, we are interested in the possibility of a component (not) failing to do what it promised to do in ways that impact dependent components.
Functional correctness and reliability are like dual aspects. While functional correctness is about what happens when a component successfully serviced a request (e.g., by providing an error response), reliability is about what happens when a component fails to service a request (e.g., crashed before responding).
Given the focus is on the fallibility of a component, we are interested in questions that help understand and address failures and also help devise a strategy to mitigate and prevent future occurrence of failures. Specifically,
How often does a component fail to service a request?
Are the failures uniform or sporadic?
What was the failure path through the system, i.e., the components and their features exercised during the failure?
What should be logged?
To answer the above questions, for every request, log its id, the time when it was received, if the component failed to service it, and the time when the service failure was detected.
The logged data suffices to answer the first two questions. To answer the third question, log additional data as a component’s failure may stem from the failure of other components, the request received by the component, the state of the component, or the state of the component’s execution environment. This additional data will be specific to the request, the component, and its execution environment.
Exercise caution while logging additional data. Specifically, ensure the appropriate handling of sensitive information. Also, strike a balance between the data needed to understand failures and the volume of log data. Being smart in how the log data is processed (batch vs. stream) and stored (aggregated vs. raw) to understand failures can help reduce the volume of log data.
Security
With security, we are interested in a component doing what it promised to do without causing harm.
The definition of harm is often tightly coupled with the domain and the system in which a component operates. For example, theft of funds would constitute harm in the context of financial systems. In contrast, loss or incorrect alteration of medical records would constitute harm in the context of medical systems.
Even so, almost all domains that heavily depend on software and automation have a security framework composed of requirements (e.g., standards) and processes (e.g., certifications, inspections, audits) as protection against harm.
With such frameworks, we can view the security aspect through a more general lens of a component is compliant with the security framework native to the domain. Consequently, we arrive at the following security-related questions.
Are the operations performed in and supported by the component compliant with security requirements? (Operational Compliance)
Are the data accessed and provided by the component compliant with security requirements? (Data Compliance)
What should be logged?
To answer the above questions, for every request that may have security implications, log the request, the time it was accepted and serviced, the authorization and authentication information associated with the request, and the data associated with it. In addition, log additional data to demonstrate compliance as required in the domain of application.
For example, if a component services requests to modify sensitive records, then it should log authorization and authentication information about the modifier, the modified parts (or pointers to them) of the record, the modifications (or points to them), the source of origin of the request, and the time of the request. Similar information should be logged even when the request for modification completes without modifications (due to errors or no modifications).
As with earlier aspects, capture additional data to recreate the relation and ordering between requests. Ensure appropriate handling of sensitive data during logging; this may entail logging only a pointer to the data and not the actual data.
Summary
Being proactive in logging data will always lead you to the next steps and questions that need to be handled. But it’s important to remember to exercise caution when gathering data, especially an excessive amount, as at times concerns and risks can be raised regarding user security and privacy. Keep in mind the main aspects of the software systems and move forward at a comfortable and efficient pace.
Maintaining product focus is the best way to guarantee a successful business. As the late great Steve Jobs put it:
“if you keep an eye on the profits, you’re going to skimp on the product… but if you focus on making really great products, the profits will follow.”
There are a wide variety of statistics available on how much time developers actually spend writing code, anywhere from 25% to 32%. Whichever is true, these studies show that your developers could (and should) be spending more time focusing on actually developing your product. In this post, we’re going to examine some of the common roadblocks developers face, and how you can enable them to overcome them and optimize your IT costs.
Distraction #1 – Sifting Through the Noise
A complex system or product can produce millions of logs a day. Some of them hold important information that may need to be addressed, but for the most part they simply cause a ton of noise. Noise is killer for productivity. In order to keep things running smoothly, with minimal maintenance from developers, you’ll need a solution that can provide succinct error analysis.
One way to do this is by clustering common logs based on shared attributes. Automated clustering of similar logs is the first step to giving your developers more time in their day to focus on product development. Coralogix uses new Streama technology to automatically analyze your logs and prioritize the ones that hold the most value for your business.
Distraction #2 – Trying to Understand What’s ‘Normal’
Understanding what constitutes ‘normal’ behavior in complicated systems is tricky. When dealing with multiple releases per day and the multiple factors involved, it gets even more complicated.
One common way developers are alerted to the effects of system changes is by relying on threshold alerts. Threshold alerts rely on manually set parameters which are time consuming and commonly lead to false positives (i.e. more noise). Replacing these alerts with a machine learning solution that can understand your system and product’s baselines and adjust dynamically, will keep your team on task and only alert them when they’re needed. No more wild goose chases.
Distraction #3 – Staying on Top of Technical Debt
Nobody wants to worry about technical debt, that’s why it exists, but it’s important to recognize that it only becomes more troublesome as time passes. Every known error that’s released to production can mean a week of troubleshooting waiting for your developers. That’s a lot of time being pulled away from product development.
Plus, it’s expensive! If you want to try and quantify the actual cost of remediating technical debt from known errors, it’s between $3.61 and $5.42per line of code. That cost comes from the time taken to apply fixes to issues caused by known errors in production.
Distraction #4 – Upgrading Supporting Systems
Monitoring and logging systems are incredibly important for any organization. Upgrading, managing and optimizing these systems is equally as important, but is also a huge distraction from your product.
When your engineers upgrade your ELK stack, they aren’t focused on product development. Your ELK stack forms a powerful part of your technology, but it isn’t your product. Your development team won’t have a product-focused mindset when they are applying a fix to each index following the latest Elasticsearch upgrade. Switching to a managed log and monitoring solution will help. Focus on your product and leave log management to the specialists.
Distraction #5 – Responding to Releases
Once you release a feature, a development team with a product focus ought to be working on the next release. However, releases sometimes have unpredictable or unforeseen impacts on your overall build quality and system performance.
The ability to carry out post-release reports on overall system performance is key for maintaining product focus. This allows your developers to move onto the next big thing.
Product Focus and Centricity with Coralogix
What’s the bottom line? A strong and independent logging and monitoring system underpins a development team’s ability to do what they do best. Coralogix provides expertise-driven out-of-the-box functional and scalable logging solutions, reducing time spent on activities which detract from product focus.
Loggregation gives your developers a succinct overview of all your log outputs, clustering them based on commonalities and saving them time when troubleshooting. Combine this with an advanced, unified UI and an intelligent open search functionality, and the time your developers spend on tasks not related to product development will reduce dramatically.
Coralogix deals with billions of logs per day for customers big and small through by offering a fully managed service. Using intelligent machine learning, Coralogix can establish performance baselines and identify known error patterns automatically. This scalable solution gives tangible relief on development resources, allowing producthttps://coralogix.com/docs/user-guides/monitoring-and-insights/anomaly-detection/new-error-and-critical-logs-anomaly/ development to take priority.
Automated benchmark reports give your team total awareness of the impact that new releases will have on build quality. This Coralogix feature means that you’ll always be up to date on your system’s health.
These offering and Coralogix’s overall innovative spirit ensure that your developers will have more product focus.
Syslog takes its name from the System Logging Protocol. It is a standard for message logging monitoring and has been in use for decades to send system logs or event messages to a specific server, called a Syslog Server.
Syslog Components
To achieve the objective of offering a central repository for logs from multiple sources, Syslog servers have several components including:
Syslog Listener: This gathers and processes Syslog data sent over UDP port 514.
Database: Syslog servers need databases to store the massive amounts of data for quick access.
Management and Filtering Software: The Syslog Server needs help to automate the work, as well as to filter to view specific log messages. This software is able to extract specific parameters and filter logs as needed.
Message Components
The Syslog message format is divided into three parts:
PRI: A calculated Priority Value which details the message priority levels.
HEADER: Consists of two identifying fields which are the Timestamp and the Hostname (the machine name that sends the log).
MSG: This contains the actual message about the event that happened. It is UTF-8 encoded and is also divided into a TAG and a CONTENT field. The information includes event messages, severity, host IP addresses, diagnostics and more.
More About PRI
This is derived from two numeric values that help categorize the message, Facility Code and Severity Level.
Facility Code: This value is one of 15 predefined codes or various locally defined values in the case of 16 to 23. These codes specify the type of program that is logging the message. Messages with different facilities may be handled differently. The list of facilities available is defined by the standard:
Facility Code
Keyword
Description
0
kern
Kernel messages
1
user
User-level messages
2
mail
Mail system
3
daemon
System daemons
4
auth
Security/authentication messages
5
syslog
Messages generated internally by syslogd
6
lpr
Line printer subsystem
7
news
Network news subsystem
8
uucp
UUCP subsystem
9
cron
Clock daemon
10
authpriv
Security/authentication messages
11
ftp
FTP daemon
12
ntp
NTP subsystem
13
security
Log audit
14
console
Log alert
15
solaris-cron
Scheduling daemon
16-23
local0 – local7
Locally-used facilities
The mapping between facility code and keyword is not uniform in different operating systems and Syslog implementations.
Severity Level: The second value of a Syslog message categorizes the importance or severity of the message in a numerical code from 0 to 7.
Level
Severity
Description
0
Emergency
System is unusable
1
Alert
Action must be taken immediately
2
Critical
Critical conditions
3
Error
Error conditions
4
Warning
Warning conditions
5
Notice
Normal but significant condition
6
Informational
Informational messages
7
Debug
Debug-level messages
The PRI value is calculated by taking the Facility Code, multiplying it by eight and then adding the Severity Level. Messages are typically no longer than 1024 bytes.
Advantages
Syslog allows the separation of the software that generates messages, the system that stores them and the software that reports and analyzes them. Therefore it provides a way to ensure that critical events are logged and stored off the original server. An attacker’s first effort after compromising a system is usually to cover their tracks left in the logs. Logs forwarded via Syslog are out of reach.
Monitoring numerous logs from numerous systems is time consuming and impractical. Syslog helps solve this issue by forwarding those events to the centralized Syslog server, consolidating logs from multiple sources into a single location.
While Syslog is not the best way to monitor the status of networked devices, it can be a good way to monitor the overall health of network equipment. Sudden spikes in event volume, for example, might indicate sudden traffic spikes. Learning about this at the edge of your system lets you get ahead of the problem before it happens.
Syslog can be configured to forward authentication events to a Syslog server, without the overhead of having to install and configure a full monitoring agent.
Limitations
Syslog does not include an authentication mechanism and is therefore weak on security. Therefore, it is possible for one machine to impersonate another machine and send fake log events. It is also susceptible to replay attacks.
Also, it is possible to lose Syslog messages because of its reliance on UDP transport. UDP is connectionless and not guaranteed, so messages could be lost due to network congestion or packet loss.
Another limitation of the Syslog protocol is that the device being monitored must be up and running and connected to the network to generate and send a message. A critical error from a server may never send an error at all if the system goes offline. Therefore, Syslog is not a good way to monitor the up and down status of devices.
Finally, although there are standards about the components of a message, there is a lack of consistency in terms of how message content is formatted. The protocol does not define standard message formatting. Some messages may be human readable, some not. Syslog just provides a method to transport the message.
Log Messages Best Practices
To help create the most useful Syslog messages possible, follow these best practices:
Use Parsable Log Formats
There is no universal structure for log messages. Working with large volumes of logs is almost impossible if you don’t have a way to automatically parse log entries to find what you’re searching for. Tools are far more likely to work with a parseable format.
One example is JSON, a structured-data log format that’s become the standard used for many logging applications. It is both machine and human-readable and is supported by most languages and runtimes. It also has the added benefit of being compact and efficient to parse.
Use a Logging Library or Framework
There are many logging libraries for programming languages and runtime environments. Whatever the language your app is developed with, use a compatible framework to transmit logs from your app or service to a Syslog server.
Standardized Formats
Set in the operating standards, the format or schema of the messages, for all users to follow. Standardizing the formats will mean less clutter in the logs and they become more searchable. Avoid long sentences and use standard abbreviations i.e use ‘ms’ for ‘milliseconds’.
There should be non-negotiable fields in your logs. IP address, timestamp, whatever you need. It’s important to have basic fields that are always set, every time. Additionally, log formats without schemas are difficult to maintain as new logging code is added to your software, new team members join and new features are developed.
Knowing exactly what information needs to be embedded in log messages helps users write them and helps everyone else read them.
Include Identifiers
Closely linked with using a format to precisely describe the log format is the best practice of using identifiers in the messages. Identifiers help identify where a message came from and figure out how multiple messages are related. For example, including a transaction or session ID in your log message allows you to link two separate errors to the same user session.
Include Syslog Severity Levels
Correctly using the most appropriate logging Severity Level when sending a message can make future troubleshooting easier. Allowing logging to be set at the wrong level and can cause monitoring issues creating false alarms or masking urgent issues.
Include the Right Amount of Context
The best Syslog messages include all the relevant context to recreate the state of your application at the time of the logging call. This means adding the source of the problem in error messages and concise reasons for sending emergency log messages.
Avoid Multi-line Log Messages
The Syslog protocol specification allows multiple lines to be contained within a single log message, but this can cause some parsing issues. Line breaks in log lines aren’t friendly with every log analysis tool. For example, sed and grep commands, don’t handle searching for patterns across lines very well. Therefore, review and declutter the messages following the agreed message format.
However, if you absolutely must include multiline messages then investigate using a cloud-based log aggregation tool such as Papertrail. This has the ability to find the separate parts of a single log message when it’s split across lines.
Don’t Log Sensitive Data
Never ever write any passwords to the log files. The same applies for sensitive data like credit card details, bank account details and personal information. Syslog messages are rarely encrypted at rest. A malicious attacker will be able to easily read them.
Refine Your Logging Code
Another good practice is to review the logging code to:
Add more content in the Emergency, Alert, Critical, Error and Warning log statements.
Keep the Notice, Informational and Debug messages short.
Log in decision points, don’t log inside short loops.
Common Tooling
Some of best Syslog tools for Linux and Windows include:
SolarWinds Kiwi Syslog Server
One of best tools for collecting, viewing and archiving Syslog messages. It is a versatile, user friendly viewer with automated message responses. This tool is easy to install and generates reports in plain text or HTML.
The software handles Syslog and SNMP from Windows, Linux and UNIX hosts.
LOGalyzer is another free open-source, centralized log management and network monitoring tool.
It supports Linux and Unix servers, network devices and Windows hosts, providing real-time event detection and extensive search capabilities.
Summary
Complete network monitoring requires using multiple tools. Syslog is an important tool in network monitoring because it ensures that events occurring without a dramatic effect do not fall through any monitoring gaps. The best practice is to use software that combines all the tools, so to always have an overview of what is happening in your network.
As Syslog is a standard protocol, many applications support sending data to Syslog. By centralizing this data, you can easily audit security, monitor application behavior and keep track of other important server information.
The Syslog log message format is supported by most programming tools and runtime environments so it’s a useful way to transmit and record log messages. Creating log messages with the right data requires users to think about the situations and to tailor the messages appropriately. Following best practices makes the job easier.
Be Our Partner
Complete this form to speak with one of our partner managers.
Thank You
Someone from our team will reach out shortly. Talk to you soon!
 The new standard of observability is here. Discover Olly, the industry’s first