
The Coralogix blog
Expert insights, bold ideas, and company news
All Articles
- All
- Alerts
- OpenTelemetry
- Olly
- Uncategorized
- Software development
- AI
- Cases
- AWS
- Product
- CDN monitoring
- CloudWatch
- Logging
- Real user monitoring
- SIEM
- Data
- Gaming
- APM
- Explore
- Cloud
- Fintech
- FinOps
- Data Engine
- Kubernetes
- Microservices
- Compliance
- Dataspaces & Datasets
- Observability
- Metrics
- Security advisory
- Tracing
- CI/CD
- Java
- IaC
- Elasticsearch
- Migrations
- DevOps & IT operations
- Troubleshooting
- Service Management
- Company news
- Case studies
- MDR
- Security
- Performance
- Extensions
- Tutorials
- Audit logs
- Infrastructure monitoring
- Logs
- Application performance monitoring
- SRE
- Monitoring
- Log analytics
- DataPrime
A Practical Guide to Logstash: Input Plugins
In a previous post, we went through a few input plugins like the file input plugin, the TCP/UDP input plugins, etc for collecting data using Logstash. In this...
Syslog 101: Everything You Need to Know to Get Started
Syslog takes its name from the System Logging Protocol. It is a standard for message...

Is the New Elasticsearch SSPL License a Threat to Your Business?
Recent changes to the Elasticsearch license could have consequences on your intellectual property. Elasticsearch and...
A Practical Guide to Logstash: Parsing Common Log Patterns with Grok
In a previous post, we explored the basic concepts behind using Grok patterns with Logstash...
Network Security: The Journey from Chewiness to Zero Trust Networking
Network security has changed a lot over the years, it had to. From wide open...
How to Troubleshoot AWS Lambda Log Collection in Coralogix
AWS Lambda is a serverless compute service that runs your code in response to events...

A Practical Guide to Logstash: Syslog Deep Dive
Syslog is a popular standard for centralizing and formatting log data generated by network devices. It provides a standardized way of generating and collecting log information, such as...
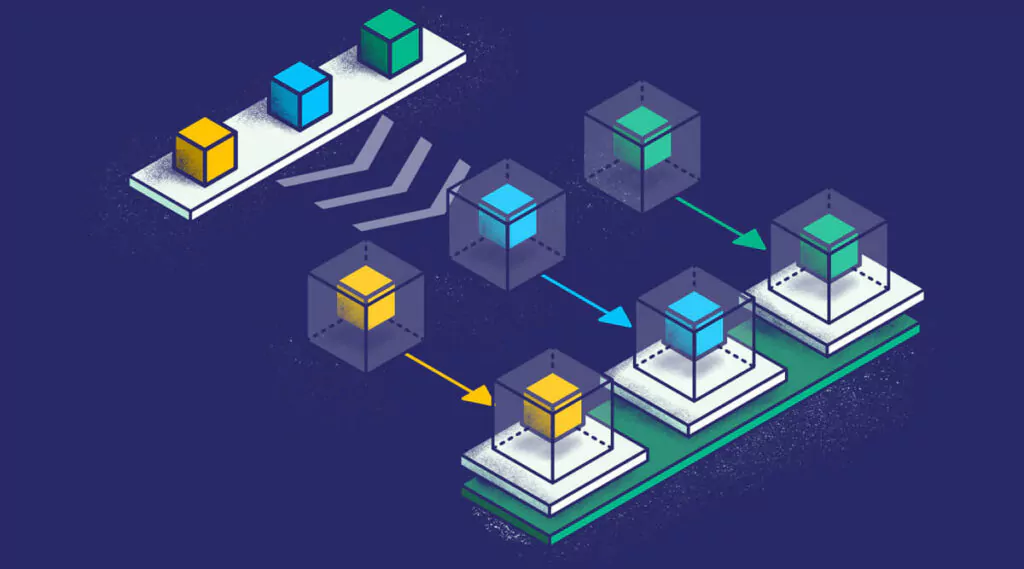
Force Multiply Your Observability Stack with a Platform Thinking Strategy
Platform thinking is a term that has spread throughout the business and technology ecosystem. But...

Scale Your Prometheus Metrics Indefinitely with Thanos
Prometheus metrics are an essential part of your observability stack. Observability comes hand in hand...

Is CloudWatch Really Cost Efficient?
One of the keys to CloudWatch’s success is its no bang, no buck billing cloud cost optimization system. The pricing structure has been designed from the outset to...
Stop Enforcing Security Standards – Start Implementing Policies
In days gone by, highly regulated industries like pharmaceuticals and finance were the biggest targets...
Elasticsearch Configurations and 9 Common Mistakes You Should Avoid
The default Elasticsearch setup is pretty good. You can get running from scratch to use...