Why is Application Performance Monitoring Important?

AI-powered platforms like Coralogix also have built-in technology that determines your enterprise monitoring system‘s “baseline” and reports anomalies that are difficult to identify in real-time. When combined with comprehensive vulnerability scans, these platforms provide you with a robust security system for your company.

Picture this: Your on-call engineer gets an alert at 2 AM about a system outage, which requires the entire team to work hours into the night. 

Even worse, your engineering team has no context of where the issue lies because your systems are too distributed. Solving the problem requires them to have data from resources that live in another timezone and aren’t responsive. 

All the while, your customers cannot access or interact with your application, which, as you can imagine, is damaging.

This hypothetical situation happens way too often in software companies. And that’s precisely the problem that application performance log monitoring solves. It enables your team to quickly get to the root cause of any issues, remediate them quickly, and maintain a high level of service for the end-users. So, let’s first understand how application performance monitoring works.

What is Application Performance Monitoring?

Application performance monitoring refers to collecting data and metrics on your application and the underlying infrastructure to determine overall system health. Typically, APM tools collect metrics such as transaction times, resource consumption, transaction volumes, error rates, and system responses. This data is derived from various sources such as log files, real-time application monitoring, and predictive analysis based on logs.

As a continuous, intelligent process, APM uses this data to detect anomalies in real-time. Then, it sends alerts to the response teams, who can then fix the issue before it becomes a serious outage. 

APM has become a crucial part of many organizations, especially those with customer-facing applications. Let’s dive into how implementing an APM might benefit your organization.

Why is application performance monitoring important?

System Observability

Observability is a critical concept in software development as it helps cross-functional teams analyze and understand complex systems and the state of each component in that system. In addition, it allows engineers to actively monitor how the application behaves in production and find any shortcomings.

Application performance monitoring is a core element of observability. Using an APM like Coralogix, you contextualize data and seamlessly correlate them with system metrics. Thus, the exact systems acting up can be isolated by software. This translates to a lower mean time to detect and resolve incidents and defects.

Furthermore, Coralogix’s centralized dashboard and live real-time reporting help you achieve end-to-end coverage for your applications and develop a proactive approach to managing incidents. Cross-functional teams can effectively collaborate to evolve the application through seamless visualization of log data and enterprise-grade security practices for compliance.

Being cross-functional is especially important as your organization grows, which brings us to the next point.

Scaling Your Business

Scaling your organization brings its set of growing pains. Systems become more complicated, architectures become distributed, and at one point, you can hardly keep track of your data sources. Along with that, there is an increased pressure to keep up release velocity and maintain quality. In cases such as these, it’s easy to miss tracking points of failures manually or even with in-house tracking software. Homegrown solutions don’t always scale well and have rigid limitations.

With Coralogix, you can reduce the overhead of maintaining different systems and visualize data through a single dashboard. In addition, advanced filtering systems and ML-powered analytics systems cut down the noise that inevitably comes with scaling, allowing you to focus on the issue at hand.

Business Continuity

You’re not alone if you’ve ever been woken up in the middle of the night because your application server is down. Time is crucial when a system fails, and application performance monitoring is critical in such cases. 

24/7 monitoring and predictive analysis often help curb the negative impacts of an outage. In many cases, good APM software can prevent outages as well. With time, intelligent APM software iterates and improves system baselines and can predict anomalies more accurately.  This leads to fewer and shorter outages, complete business continuity, and minimal impact on the end users. Speaking of end users…

Team Productivity

We want to fix defects – said no developer ever. With log data and monitoring, engineering teams can pinpoint the problem that caused the defect and fix it quickly. Your software teams would thus have fewer headaches and late nights. This leads to improved team morale, freeing up their time to innovate or create new features for the application instead. Tracking automation software like RPA and custom scripts is also a great use case for APMs that directly increase productivity.

Customer Experience

End users want applications to be fast, responsive, and reliable across all devices, be it their phone, tablet, laptop, etc. Your website doesn’t even have to be down for them to form a negative impression — they will switch over to a competitor if your website doesn’t load within seconds. 

Systems rarely fail without giving some kind of indication first. With APM, you can track these issues in real-time. For instance, you could set up alerts to trigger when a webpage becomes non-responsive. Higher traffic load or router issues can also be monitored. Combined with detailed monitoring data through application and Cloudflare logs, your team can then jump in before the end user’s experience is disrupted.

Along with user experience, application performance monitoring software also plays a crucial role in cybersecurity. No matter the size of your organization, hackers actively look for security loopholes to breach sensitive data. Here’s how APM helps deal with that.

Reduce Cybersecurity Risk 

Hackers are everywhere. Although a good firewall, VPNs, and other cybersecurity measures help block a lot of unwanted traffic, sophisticated attacks can sometimes still breach that level of security. With cybersecurity hacks sometimes resulting in millions of dollars in losses for a business, APM software can be the solution you need to be cyber secure.

By monitoring your applications constantly and looking at usage patterns, you’ll be able to identify these intrusions as they happen. Threshold levels can trigger alerts when the system detects unusual activity through traces. Thus, this can function as an early warning system, especially during DDoS attacks. APMs can also be used to track authentication applications to ensure they are keeping APIs functional while keeping the hackers at bay.

Kubernetes: Tips, Tricks, Pitfalls, and More

If you’re involved in IT, you’ve likely come across the word “Kubernetes.” It’s a Greek word that means “boat.” It’s one of the most exciting developments in cloud-native hosting in years. Kubernetes has unlocked a new universe of reliability, scalability, and observability, changing how organizations behave and redefining what’s possible. 

But what exactly is it?

Kubernetes at a high level 

Kubernetes is a “container orchestration” platform that will host and manage applications for you. If your company has a website, Kubernetes can host it. If you have a complex suite of microservices running on different unmonitored infrastructure pieces, Kubernetes can handle that too. It’s a scalable method for hosting and monitoring the applications that make up your technical estate. 

What makes Kubernetes so powerful?

Kubernetes has taken pride of place amongst hosting solutions for a simple reason. It is both incredibly flexible and straightforward to use. If you need to bake custom functionality into your Kubernetes platform, you can. You can write the code from scratch and plug it in, and Kubernetes will accept it with open arms. However, if you don’t need any clever functionality, Kubernetes comes with a collection of simple default behaviors that handle most cases.

This allows you to turn the dial on when it comes to complexity. Do you want something that works out of the box? Kubernetes can do that. Do you need complex, custom behavior to drive your product? Well, that’s there for you too. 

What skills do you need to work with Kubernetes?

Kubernetes is written in Golang, and while you don’t need to be an expert in using the platform, sometimes the Kubernetes engine will spit out some Golang specific errors, and understanding those errors will help to speed up your debugging.

You’ll definitely need to understand YAML syntax. Kubernetes offers a declarative API that primarily works with YAML, although JSON is available if you want it. You should get very comfortable with YAML because you will be working with it a lot. This has given rise to many Kubernetes experts describing themselves facetiously as “YAML Engineers.”

Finally, you’re going to need some cloud skills. Many of the problems that arise when you’re getting started with Kubernetes often have nothing to do with Kubernetes but the underlying infrastructure you’ve set up to host it. This underlying infrastructure will form the bedrock of your platform and needs to be completely sound.

kubernetes eBook

But what benefit do you get for all of that?

The benefit of Kubernetes is enormous if done correctly. Kubernetes is the foundation of your engineering platform, but what does an engineering platform offer?

Consistent logging, monitoring, and alerting

Observability is a huge engineering challenge for many teams who are building new software. A common problem is tool sprawl, there lots of teams will come up with many different ways of solving the same problems with different tools. Using Kubernetes observability, you can install tools into your Kubernetes cluster that automatically work with any new workload that your engineers deploy. This will remove the concern from engineering teams, enabling them to focus on the problems they’re trying to solve.

Self-healing and failure tolerance

Kubernetes will monitor the health of all of your applications and, if they fail, will automatically restart those instances. It will keep doing this repeatedly until your instances are healthy. It will also keep an audit trail of which restarts have happened and why. It will also retry failed CronJobs and more. 

This functionality often takes months to implement in traditional cloud architectures and years in an on-premise environment. With Kubernetes, this comes for free and out of the box. 

Consistency across teams

When teams implement different solutions across the organization, it becomes difficult for operations or support colleagues to navigate these tools. With Kubernetes, your teams are all talking the same language (probably YAML), making the learning curve much easier for people across multiple teams.

This consistency doesn’t just make support easier. Now teams can share ideas using a shared framework. They can write tools and libraries that interface with Kubernetes and suddenly share them with every other team. The composability of Kubernetes is a direct driver for collaboration and effective engineering between teams.

There’s a lot to cover…

Kubernetes has grown into a vastly exciting space. We’ve only discussed the benefits of so many features, tips, and tricks, but pitfalls too. Remember this – Kubernetes is your foundation, your base. It gives you all the raw materials you need to build a fantastic engineering ecosystem. With all these features and tools at your fingertips, you’ll be surprised at what you can achieve with a fully functional Kubernetes cluster.

We’re Making Our Debut In Cybersecurity with Snowbit

2021 was a crazy year, to say the least, not only did we welcome our 2,000th customer, we announced our Series B AND Series C funding rounds, and on top of that, we launched Streamaⓒ – our in-stream data analytics pipeline.

But this year, we’re going to top that!

We’re eager to share that we are venturing into cybersecurity with the launch of Snowbit! This new venture will focus on helping cloud-native companies comprehensively manage the security of their environments.

As you know, observability and security are deeply intertwined and critical to the seamless operation of cloud environments. Post becoming a full-stack observability player with the addition of metrics and tracing, it was natural for us to delve deeper into cybersecurity.

So what are we trying to solve?

Today we are witnessing accelerated cybersecurity risks with the online explosion post the onset of the pandemic. The acute global scarcity of cybersecurity talent has aggravated the situation as most organizations are unlikely to have adequately staffed in-house security teams over the medium term. They are just too expensive, difficult to hire and keep updated.

As Navdeep Mantakala, Co-founder of Snowbit says, “Rapidly accelerating cyberthreats are leaving many organizations exposed and unable to effectively deal with security challenges as they arise. Snowbit aims to address fundamental security-related challenges faced today including growing cloud complexity, increasing sophistication of attacks, lack of in-house cybersecurity expertise, and the overhead of managing multiple point security solutions.”

What is also adding to the challenge is the increasing leverage of the cloud, both multi-provider infrastructure and SaaS, which is dramatically broadening the attack surface and complexity. Leverage of multiple point solutions to address specific use cases are only increasing the operational overhead.

How are we solving it?

Snowbit’s Managed Extended Detection and Response (MxDR) incorporates a SaaS platform and expert services. The platform gives organizations a comprehensive view of their cloud environment’s security and compliance (CIS, NIST, SOC, PCI, ISO, HIPAA). 

The Snowbit team will work to expand on the existing capabilities of the Coralogix platform, so that all data will be used to identify any abnormal activity, configurations, network, and vulnerability issues. This is rooted in the idea that every log can and should be a security log. Furthermore, it will automate threat detection and incident response via machine learning, an extensive set of pre-configured rules, alerts, dashboards, and more. 

The MxDR platform deploys a team of security analysts, researchers, and DFIR professionals stationed at Snowbit’s 24×7 Security Resource Center. There, they provide guided responses to enable organizations to more decisively respond to threats detected in their environment.

“Observability forms the bedrock of cybersecurity, and as a result, Snowbit is strategic for Coralogix as it enables us to offer a powerful integrated observability and security proposition to unlock the value of data correlation,” said Ariel Assaraf, CEO of Coralogix. “Snowbit’s platform and services enable organizations to overcome challenges of cybersecurity talent and disparate tools to more effectively secure their environments.”

With Snowbit, we have the vision to empower organizations across the globe to quickly, efficiently, and cost-effectively secure themselves against omnipresent and growing cyber risks. Snowbit is looking to offer the broadest cloud-native managed detection and response offering available to enable this. 

Make sure to sign up for updates so you can get notified once Snowbit launches. 

5 Cybersecurity Tools to Safeguard Your Business

With the exponential rise in cybercrimes in the last decade, cybersecurity for businesses is no longer an option — it’s a necessity. Fuelled by the forced shift to remote working due to the pandemic, US businesses saw an alarming 50% rise in reported cyber attacks per week from 2020 to 2021. Many companies still use outdated technologies, unclear policies, and understaffed cybersecurity teams to target digital attacks.

So, if you’re a business looking to upgrade its cybersecurity measures, here are five powerful tools that can protect your business from breaches.

1. Access Protection

Designed to monitor outgoing and incoming network traffic, firewalls are the first layer of defense from unauthorized access in private networks. They are easy to implement, adopt, and configure based on security parameters set by the organization.

Among the different types of firewalls, one of the popular choices among businesses is a next-generation firewall. A next-generation firewall can help protect your network from threats through integrated intrusion prevention, cloud security, and application control. A proxy firewall can work well for companies looking for a budget option.

Even though firewalls block a significant portion of malicious traffic, expecting a firewall to suffice as a security solution would be a mistake. Advanced attackers can build attacks that can bypass even the most complex firewalls, and your organization’s defenses should catch up to these sophisticated attacks. Thus, instead of relying on the functionality of a single firewall, your business needs to adopt a multi-layer defense system. And one of the first vulnerabilities you should address is having unsecured endpoints.

2. Endpoint Protection

Endpoint Protection essentially refers to securing devices that connect to a company’s private network beyond the corporate firewall. Typically, these range from laptops, mobile phones, and USB drives to printers and servers. Without a proper endpoint protection program, the organization stands to lose control over sensitive data if it’s copied to an external device from an unsecured endpoint.

Softwares like antivirus and anti-malware are the essential elements of an endpoint protection program, but the current cybersecurity threats demand much more. Thus, next-generation antiviruses with integrated AI/ML threat detection, threat hunting, and VPNs are essential to your business.

If your organization has shifted to being primarily remote, implementing a protocol like Zero Trust Network Access (ZTNA) can strengthen your cybersecurity measures. Secure firewalls and VPNs, though necessary, can create an attack surface for hackers to exploit since the user is immediately granted complete application access. In contrast, ZTNA isolates application access from network access, giving partial access incrementally and on a need-to-know basis. 

Combining ZTNA with a strong antivirus creates multi-layer access protection that drastically reduces your cyber risk exposure. However, as we discussed earlier, bad network actors who can bypass this security will always be present. Thus, it’s essential to have a robust monitoring system across your applications, which brings us to the next point…

3. Log Management & Observability

Log management is a fundamental security control for your applications. Drawing information from event logs can be instrumental to identifying network risks early, mitigating bad actors, and quickly mitigating vulnerabilities during breaches or event reconstruction.

However, many organizations still struggle with deriving valuable insights from log data due to complex, distributed systems, inconsistency in log data, and format differences. In such cases, a log management system like Coralogix can help. It creates a centralized, secure dashboard to make sense of raw log data, clustering millions of similar logs to help you investigate faster. Our AI-driven analysis software can help establish security baselines and alerting systems to identify critical issues and anomalies. 

A strong log monitoring and observability system also protects you from DDoS attacks. A DDoS attack floods the bandwidth and resources of a particular server or application through unauthorized traffic, typically causing a major outage. 

With observability platforms, you can get ahead of this. Coralogix’s native Cloudflare integrations combined with load balancers give you the ability to cross-analyze attack and application metrics and enable your team to mitigate such attacks. Thus, you can effectively build a DDOS warning system to detect attacks early.

Along with logs, another critical business data that you should monitor regularly are emails. With over 36% of data breaches in 2022 attributed to phishing scams, businesses cannot be too careful.

4. Email Gateway Security

As most companies primarily share sensitive data through email, hacking email gateways is a prime target for cybercriminals. Thus, a top priority should be robust filtering systems to identify spam and phishing emails, embedded code, and fraudulent websites. 

Email gateways act as a firewall for all email communications at the network level — scanning and auto-archiving malicious email content. They also protect against business data loss by monitoring outgoing emails, allowing admins to manage email policies through a central dashboard. Additionally, they help businesses meet compliance by safely securing data and storing copies for legal purposes. 

However, the issue here is that sophisticated attacks can still bypass these security measures, especially if social engineering is involved. One wrong click by an employee can give hackers access to an otherwise robust system. That’s why the most critical security tool of them all is a strong cybersecurity training program.

5. Cybersecurity Training

Even though you might think that cybersecurity training is not a ‘tool,’ a company’s security measures are only as strong as the awareness among employees who use them. In 2021, over 85% of data breaches were associated with some level of human error. IBM’s study even found out that the breach would not have occurred if the human element was not present in 19 out of 20 cases that they analyzed.

Cybersecurity starts with the people, not just the tools. Thus, you need to implement a strong security culture about security threats like phishing and social engineering in your organization. All resources related to cybersecurity should be simplified and made mandatory during onboarding. These policies should be further reviewed, updated, and re-taught semi-annually in line with new threats. 

Apart from training, the execution of these policies can mean the difference between a hackable and a secure network. To ensure this, regular workshops and phishing tests should also be conducted to identify potential employee targets. Another way to increase the effectiveness of these training is to send out cybersecurity newsletters every week. 

Some companies like Dell have even adopted a gamified cybersecurity training program to encourage high engagement from employees. The addition of screen locks, multi-factor authentication, and encryption would also help add another layer of security. 

Upgrade Your Cybersecurity Measures Today!

Implementing these five cybersecurity tools lays a critical foundation for the security of your business. However, the key here is to understand that, with cyberattacks, it sometimes just takes one point of failure. Therefore, preparing for a breach is just as important as preventing it. Having comprehensive data backups at regular intervals and encryption for susceptible data is crucial. This will ensure your organization is as secure as your customers need it to be —  with or without a breach!

DDOS Attacks: How to Protect Yourself from the Political Cyber Attack

In the past 24 hours, funding website GiveSendGo has reported that they’ve been the victim of a DDOS attack, in response to the politically charged debate about funding for vaccine skeptics. The GiveSendGo DDOS is the latest in a long line of political cyberattacks that have relied on the DDOS mechanism as a form of political activism. There were millions of these attacks in 2021 alone. 

But wait, what is a DDOS attack?

Most attacks rely on some new vulnerability being released into the wild, like the Log4Shell vulnerability that appeared in December 2021. DDOS attacks are slightly different. They sometimes exploit known vulnerabilities, but DDOS attacks have another element at their disposal: raw power.

DDOS stands for Distributed Denial of Service attack. They have a single motive – to prevent the target from being able to deliver their service. This means that when you’re the victim of a DDOS attack, without adequate preparation, your entire system can be brought to a complete halt without any notice. This is the exact thing that the GiveSendGo DDOS attack has done. 

A DDOS attack usually consists of a network of attackers that collaborate together to form a botnet. A botnet is a network of machines willing to donate their processing power in service of an attack. These machines then collaborate to send a vast amount of traffic to a single target, like a digital siege, preventing other legitimate traffic in or out of the website.

What makes DDOS attacks so dangerous?

When a single user is scanning your system for vulnerabilities, a basic intrusion detection system will pick up on some patterns. They usually operate from a single location and can be blacklisted in seconds. DDOS attacks originate from thousands of different points in the botnet and often attempt to mimic legitimate traffic. Detecting the patterns requires a sophisticated observability system that many organizations do not invest in until it’s too late. 

But that’s not all…

It is widespread for DDOS attacks to attract more skilled hackers to the situation who are able to discover and exploit more serious vulnerabilities. DDOS attacks create a tremendous amount of chaos and noise. Monitoring stops working, servers crash, alerts trigger. All of this makes it difficult for your security engineers to defend your infrastructure actively. This may expose weaknesses that are difficult to combat.

Why are these attacks so common in political situations?

With enough volunteers, a DDOS attack can begin without the need for skilled cybersecurity specialists. They don’t rely on new vulnerabilities that require specialized software to be exploited. To make things worse, the people who take part in a DDOS don’t need to be technical experts either. They could be “script kiddies” who can make use of existing software, they could be technical experts or, most commonly, they could be people who can navigate to a website and follow some basic instructions. 

While we don’t know the details of the GiveSendGo DDOS attack yet, we can assume that this attack, like most other DDOS attacks, is the workings of a small group of tech-savvy instigators and a much larger group of contributors. This means that if a situation has enough people around it, a DDOS attack can rapidly form out of nothing and escalate a situation from a disagreement to a commercial disaster.

So what can you do about it?

There are several common steps that companies take to protect themselves from a DDOS attack. Each of these are crucial defensive mechanisms to ensure that if you do find yourself on the receiving end of a DDOS, you’re able to stay in service long enough to defend yourself.

Making use of a CDN and it was crucial in the GiveSendGo DDOS attack

Content Distribution Networks (CDN) provide a layer between you and the wider Internet. Rather than directly exposing your services to the public, use a CDN to distribute your content globally. CDNs have several great benefits, such as speeding up page load times and offering great reliability for your site. 

In the case of a DDOS attack, your CDN can act as a perimeter around your system and take the brunt of the attack. This buys you time to defend against the incoming storm proactively. The CloudFlare CDN has been one of the reasons why GiveSendGo hasn’t completely crashed during the attack. 

Route everything through a Web Application Firewall

A Web Application Firewall (WAF) is a specialized tool to process and analyze incoming traffic. It will automatically detect malicious attacks and prevent them from reaching your system. This step should come after your CDN. The CDN will provide resilience against sudden spikes in traffic. Still, you need this second layer of defense to ensure that anything that makes it through is scrutinized before it is permitted to communicate with your servers.

Invest in your Observability

Automated solutions that sit in front of your system will make your task easier, but they will never fully eliminate the problem. Your challenge is to create an observability stack that can help you filter out the noise of a DDOS attack and focus on the problems you’re trying to solve. 

Coralogix is a battle-tested, enterprise-grade SaaS observability solution that can do just that. That includes everything from machine learning to driven anomaly detection to SIEM/SOAR integrations and some of the most ubiquitous tools in the cybersecurity industry. Coralogix can give you operational insights on a range of typical challenges.

An investment in your observability stack is one of the fundamental steps in achieving a robust security posture in your organization. With the flexibility, performance, and efficiency of Coralogix, you can gain actionable insights into the threats that face your company as you innovate and achieve your goals.

5 Ways Scrum Teams Can Be More Efficient

With progressive delivery, DevOps, scrum, and agile methodologies, the software delivery process has become faster and more collaborative than ever before. Scrum has emerged as a ubiquitous framework for agile collaboration, instilling some basic meetings and roles into a team and enabling them to begin iterating on product increments quickly. However, as scrum teams grow and systems become more complex, it can be difficult to maintain productivity levels in your organization. 

Let’s dive into five ways you can tweak your company’s scrum framework to drive ownership, optimize cloud costs, and overall increased productivity for your team.

1. Product Backlog Optimization

Scrum is an iterative process. Thus, based on feedback from the stakeholders, the product backlog or the list of implementable features gets continually adjusted. Prioritizing and refining tasks on this backlog will ensure that your team delivers the right features to your customers, thus boosting efficiency and morale. 

However, it’s not as easy as it sounds. Each project has multiple stakeholders, and getting them on the same page about feature priority can sometimes prove tricky. That’s why selecting the right product owner and conducting pre-sprint and mid-sprint meetings are essential. 

These meetings help create a shared understanding of the project scope and the final deliverable early. Using prioritization frameworks to categorize features based on value and complexity can also help eliminate the guesswork or biases while deciding priority. 

At the end of each product backlog meeting, document the discussions and send them to the entire team, including stakeholders. That way, as the project progresses, there is less scope for misunderstandings, rework, or missing features. With a refined backlog, you’ll be able to rapidly deliver new changes to your software; however, this gives rise to a new problem.

2. Observability

As software systems become more distributed, there is rarely a single point of failure for applications. Identifying and fixing the broken link in the chain can add hours to the sprint, reducing the team’s overall productivity. Having a solid observability system with log, traces, and metrics monitoring, thus, becomes crucial to improve product quality. 

However, with constant pressure to meet scrum deadlines, it can be challenging to maintain logs and monitor them constantly. That’s precisely where monitoring platforms like Coralogix can help. You can effectively analyze even the most complex of your applications as your security, and log data can be visualized in a single, centralized dashboard. 

Machine learning algorithms in observability platforms continually search for anomalies through this data with an automatic alerting system. Thus, bottlenecks and security issues in a scrum sprint can be identified before they become critical and prioritized accordingly. Collaboration across teams also becomes streamlined as they can access the application analytics data securely without the headache of maintaining an observability stack.

This new information becomes the fuel for continuous improvement within the team. This is brilliant, but just the data alone isn’t enough to drive that change. You need to tap into the most influential meetings in the scrum framework—the retrospective.

3. Efficient Retrospectives

Even though product delivery is usually at the forefront of every scrum meeting, retrospectives are arguably more important as they directly impact both productivity and the quality of the end product.

Retrospectives at the end of the sprint are powerful opportunities to improve workflows and processes. If done right, these can reduce time waste, speed up future projects, and help your team collaborate more efficiently.

During a retrospective, especially if it’s your team’s first one, it is important to set ground rules to allow constructive criticism. Retrospectives are not about taking the blame but rather about solving issues collectively.

To make the retrospective actionable, you can choose a structure for the meetings. For instance, some companies opt for a “Start, Stop, Continue” format where employees can jot down what they think they should start doing, what has been working well and what has not. Another popular format is the “5 Whys,” which encourages team members to introspect and think critically about improving the project workflow.

As sprint retrospectives are relatively regular, sticking to a particular format can get slightly repetitive. Instead, switch things up by changing the time duration of the meeting, retrospective styles, and the mandatory members. No matter which format or style you choose, the key is to engage the entire team.

At the end of a retrospective, document what was discussed and plan to address the positive and negative feedback. This list would help you pick and prioritize the changes that would impact and implement them from the next sprint. Throughout your work, you may find that some of these actions can only be picked up by a specific group of people. This is called a “single point of failure,” and the following tip can solve it.

4.  Cross-Training

Cross-training helps employees upskill themselves, understand the moving parts of a business, and how their work fits in the larger scheme of things. The idea is to train employees on the most critical or base tasks across the organization segment, thus enabling better resource allocation. 

Cross-training has been successful because pairs programming helps boost collaboration and cross-train teams. If there’s an urgent product delivery or one of the team members is not available, others can step in to complete the task. Cross-functional teams can also iterate more quickly than their siloed counterparts as they have the skills to prototype and test minimum viable products within the team rapidly.

However, the key to cross-training is not to overdo it. Having a developer handle the server-side of things or support defects for some time is reasonable, but if it becomes a core part of their day, it wouldn’t fit with their career goals. Cross-functional doesn’t mean that everyone should do everything, but rather help balance work and allocate tasks more efficiently.

When engineers are moving between tech stacks and supporting one another, it does come with a cost. That team will need to think hard about how they work to build the necessary collaborative machinery, such as CI/CD pipelines. These tools, together, form the developer workflow, and with cross-functional teams, an optimal workflow is essential to team success.

5. Workflow Optimization

Manual work and miscommunication cause the most significant drain on a scrum team’s productivity. Choosing the right tools can help cut down this friction and boost process efficiency and sprint velocity. Different tools that can help with workflow optimization include project management tools like Jira, collaboration tools like Slack and Zoom, productivity tools like StayFocused, and data management tools like Google Sheets.

Many project management tools have built-in features specific to agile teams, such as customizable scrum boards, progress reports, and backlog management on simple drag-and-drop interfaces. For example, tools like Trello or Asana help manage and track user stories, improve visibility, and identify blockers effectively through transparent deadlines. 

You can also use automation tools like Zapier and Butler to automate repetitive tasks within platforms like Trello. For example, you can set up rules on Zapier to trigger whenever a particular action is performed. For instance, every time you add a new card on Trello, you can configure it to make a new Drive folder or schedule a meeting. This would cut down unnecessary switching between multiple applications and save man-hours. Thus, with routine tasks automated, the team can focus on more critical areas of product delivery.

It’s also important to keep track of software costs while implementing tools. Keep track of the workflow tools you implement and trim those that don’t lead to a performance increase or are redundant.

Final Thoughts

While scrum itself allows for speed, flexibility, and energy from teams, incorporating these five tips can help your team become even more efficient. However, you should always remember that the Scrum framework is not a one-size-fits-all. Scrum practices that would work in one scenario might be a complete failure in the next one. 

Thus, your scrum implementations should always allow flexibility and experimentation to find the best fit for the team and project. After all, that’s the whole idea behind being agile, isn’t it?

Have You Forgotten About Application-Level Security?

Security is one of the most changeable landscapes in technology at the moment. With innovations, come new threats, and it seems like every week brings news of a major organization succumbing to a cyber attack. We’re seeing innovations like AI-driven threat detection and zero-trust networking continuing to be a huge area of investment. However, security should never be treated as a single plane. 

Here at Coralogix, we’re firm believers that observability is the backbone of good security practice. That’s why, in this piece, we’re going to examine what’s in the arsenal when it comes to protecting your platforms at their core: the application level. 

The cyber-security picture today

Trends in cyber security seem to revolve around two key facets: detection and recovery. Detection, because stopping an attack before it happens is less costly than recovery. Recovery, because there is a certain inevitability associated with cyber-attacks and organizations want to be best prepared for such an eventuality. GDPR logging and monitoring and NIS require disclosure from an organization hit by a cyberattack within 72 hours, so it’s easy to see companies are today focussing on these pillars. 

In terms of attack style, three main types dominate a CISO’s headspace in 2021. These are (in no particular order), supply-chain attacks, insider threats, and ransomware. 

Code-layer security for your application 

It’s fair to say that applications need safe and secure code to run without the threat of compromising other interdependent systems. The SolarWinds cyber attack is a great example of when compromised code had a devastating knock-on effect. Below, we’ll explore how you can boost your security at a code level.

Maintain a repository

Many companies will employ a trusted code repository to ensure that they aren’t shipping any vulnerabilities. You can supercharge the use of a repository by implementing GitOps as a methodology. Not only does this give you ship and roll-back code quickly, but with the Coralogix Kubernetes Operator, you can keep track of these deployments with your observability platform. 

Write secure code

This seems like an obvious suggestion, but it shouldn’t be overlooked. Vulnerabilities in Java code occupy the top spots in the OWASP top 10, so ensure your engineers are well versed in shortcomings around SSL/TLS libraries. While there are tools available which scan your code for the best-known vulnerabilities, they’re no substitute for on-the-ground knowledge. 

Monitor your code

Lack of proper monitoring, alerting, and logging is cited as a key catalyst of application-level security problems. Fortunately, Coralogix has a wide range of integrations for the most popular programming languages so that you can monitor key security events at a code level.

Cloud service security for your application

Public cloud provides a range of benefits that organizations look to capitalize on. However, the public cloud arena brings its own additional set of application security considerations.

Serverless Monitoring

In a 2019 survey, 40% of respondents indicated that they had adopted a serverless architecture. Function as a Service (FaaS) applications have certainly brought huge benefits for organizations, but also bring a new set of challenges. On AWS, the FaaS offerings are Lambda and S3 (which is stateful backend storage for Lambda). The Internet is littered with examples of security incidents directly related to S3 security problems, most famously Capital One’s insider threat fiasco. This is where tools like Coralogix’s Cloudwatch integration can be useful, allowing you to monitor changes in roles and permissions in your Coralogix dashboard. Coralogix also offers direct integration with AWS via its Serverless Application Repository, for all your serverless security monitoring needs. 

Edge Computing

Edge computing is one of the newer benefits realized by cloud computing. It greatly reduces the amount of data in flight, which is good for security. However, it also relies on a network of endpoint devices for processing. There are numerous considerations for security logging and monitoring when it comes to IoT or edge computing. A big problem with monitoring these environments is the sheer amount of data generated and how to manage it. Using an AI-powered tool, like Loggregation, to help you keep on top of logging outputs is a great way of streamlining your security monitoring.

Container security for your application 

If you have a containerized environment, then you’re probably aware of the complexity of managing its security. While there are numerous general containerized environment security considerations, we’re going to examine the one most relevant to application-level security.

Runtime Security

Runtime security for containers refers to the security approach for when the container is deployed. Successful container runtime security is heavily reliant on an effective container monitoring and observability strategy. 

Runtime security is also about examining internal network traffic, instead of just relying on traditional firewalling. You also have to monitor the orchestration platforms (for example Kubernetes or Istio) to make sure you don’t have vulnerabilities there. Coralogix provides lots of different Kubernetes integrations, including Helm charts, to give you that vital level of granular observability.

What’s the big deal?

With many organizations being increasingly troubled by cyberattacks, it’s important to make sure that security focus isn’t just on the outer layer, for example, firewalls. In this article, we’ve highlighted steps you can take to effectively monitor your applications and their components to increase your system security, from the inside out. 

What’s the biggest takeaway from this, then? Well, you can monitor your code security, cloud services, and container runtime. But don’t ever do it in isolation. Coralogix gives you the ability to overlay and contextualize this data with other helpful metrics, like firewalls, to keep your vital applications secure and healthy. 

Comparing REST and GraphQL Monitoring Techniques

Maintaining an endpoint, especially a customer-facing one, requires constant log monitoring, whether using REST or GraphQL. As the industry has looked for solutions to build a more adaptive endpoint technology, it is also a must to monitor these endpoints. GraphQL and REST are two different technologies that allow user-facing clients to link to databases and platform logic. Both GraphQL and REST include monitoring techniques. Here, we will compare enterprise monitoring an endpoint using AWS API Gateway backed by a REST or GraphQL.

REST and GraphQL Monitoring Architecture

The architecture of a GraphQL versus a REST endpoint is fundamentally different. The architecture gives different locations available for monitoring your solution. Both RESTful and GraphQL systems are stateless, meaning the server and client do not need to know what state the other is in for interactions. Both RESTful and GraphQL systems also separate the client from the server. Either architecture can modify the server or client without affecting operations of the other as long as the format of the requests on the endpoint(s) remain consistent.  

GraphQL Monitoring and Server Architecture

GraphQL uses a single endpoint and allows users to select what portion of the available returned data is required, making it more flexible for developers to integrate and update. GraphQL endpoints include these components:

  1. A single HTTP endpoint
  2. A schema that defines data types
  3. An engine that uses the schema to route inputs to resolvers
  4. Resolvers process the inputs and interact with resources. 

Developers can place GraphQL Monitoring in any of several locations. Monitoring the HTTP endpoint itself will reveal all the traffic hitting the GraphQL server. Developers can monitor the GraphQL server where the server routes data from the endpoint to a specific resolver. Each resolver, query or mutation, can have monitoring implemented.  

REST Monitoring and Server Architecture

RESTful architecture is similar in components to GraphQL but requires a very different and more strict setup. REST is a paradigm for how to set up an endpoint following some relatively strict rules. Many endpoints exist claiming to be REST, but they do not precisely follow these rules. Endpoints that do not conform to the rules are better defined as HTTP APIs. REST is robust but inflexible in its capabilities since each endpoint requires its own design and building. It is up to the developers to design their endpoints as needed, but many believe only endpoints following these rules should be labeled as REST.

Designing a RESTful API includes defining the resources that will be made accessible using HTTP, identifying all resources with URLs (or resources), and mapping CRUD operations to standard HTTP methods. CRUD operations (create, retrieve, update, delete) are mapped to POST, GET, PUT, and DELETE methods, respectively.

Each RESTful URL expects to receive specific inputs and will return results based on those inputs. Inputs and outputs of each resource are set and known by both client and server to interact. 

Monitoring on RESTful APIs has some similarities to GraphQL. Developers can set up monitoring on the API endpoints directly. Monitoring may be averaged across all endpoints with the same base URL or broken up for each specific resource. When developers use compute functions between the database and the endpoint, developers can monitor these functions as well. If using AWS monitoring, it is common to use Lambda to power API endpoints. 

REST and GraphQL Error Monitoring

REST Error Format

RESTful APIs use well-defined HTTP status codes to signify errors. When a client makes a request, the server notifies the client if the request was successfully handled. A status code is returned with all request results, signifying what kind of error has occurred or what server response the client should expect. HTTP includes a few categories of status codes. These include 200 level (success), 400 level (client errors), and 500 level (server errors).

Errors can be caught in several places and monitored for RESTful endpoints. The API itself may be able to monitor the status codes and provide metrics for which codes are returned and how often. Logs from computing functions behind the endpoint can also be used to help troubleshoot error codes. Logs can be sent to third-party tools like Coralogix’s log analytics platform to help alert developers of systemic issues.

GraphQL Error Format

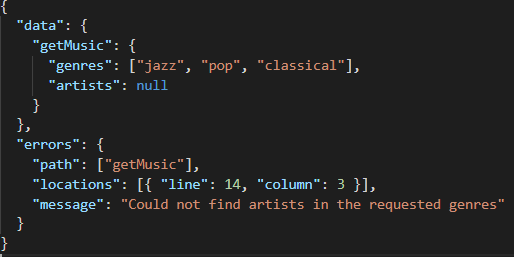
GraphQL monitoring looks at server responses to determine if an issue has arisen. Errors returned are categorized based on the error source. GraphQL’s model combines errors with data. So, when the server cannot retrieve some data, the server will return all available data and append an error when appropriate. The return format for GraphQL resolvers is shown below:

The Apollo server library allows developers to use internally generated syntax and validation errors that are applied automatically. Developers can also define custom error logic in resolvers so errors can be handled gracefully by the client.

A typical HTTP error can still be seen when there is an error in the API endpoint in front of a GraphQL server. For example, if the client was not authorized to interact with the GraphQL server, a 401 error is returned in the HTTP format. 

Monitoring errors in a GraphQL endpoint is more complex than Restful APIs. The status codes returned tend towards success (200) since any data that is found is returned. Error messages are secondary if only parts of the data needed are missing. Errors could instead be logged in the compute function behind the GraphQL server. If this is the case, CloudWatch log analytics would be helpful to track the errors. Custom metrics can be configured to differentiate errors. Developers can use third-party tools like Coralogix’s log analytics platform to analyze GraphQL logs and automatically find the causes of errors.

AWS API Gateway Monitoring

Developers could use many tools to host a cloud server. AWS, Azure, and many third-party companies accommodate API management tools that accommodate either RESTful or GraphQL architecture. Amazon’s API Gateway tool allows developers to build, manage, and maintain their endpoints.

API Gateway is backed by AWS’s monitoring tools, including but not limited to CloudWatch CloudTrail, and Kinesis. 

GraphQL Monitoring using CloudWatch API integration

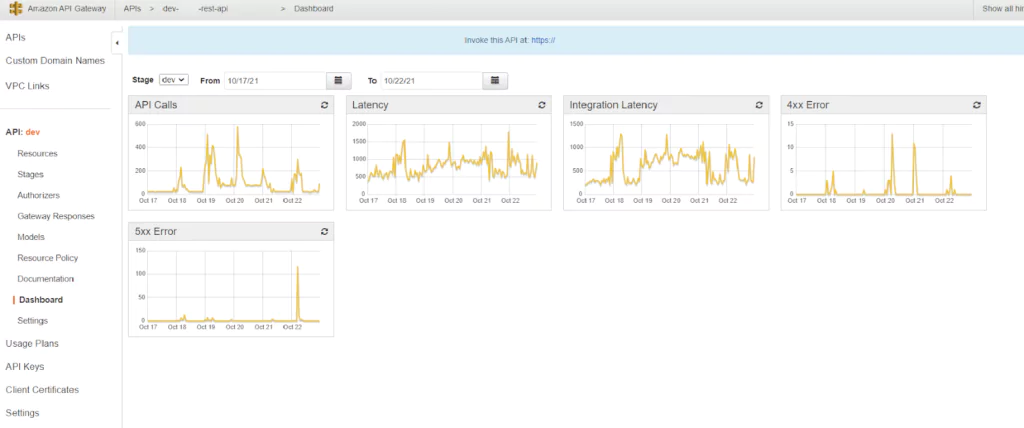
The API Gateway Dashboard page includes some high-level graphs. These all allow developers to check how their APIs are currently functioning. Graphs include the number of API calls over time, both latency and integration latency over time, and different returned errors (both 4xx and 5xx errors over time). While these graphs are helpful to see the overall health of an endpoint, they do little else to help determine the actual issue and fix it. 

In CloudWatch, users can get a more clear picture of which APIs are failing using CloudWatch metrics. The same graphs in the API Dashboard shown above are available for each method (GET, POST, PUT, etc.) and each endpoint resource. Developers can use these metrics to understand which APIs are causing issues, so troubleshooting and optimization can be focussed on specific APIs. Metrics may be sent to other systems like Coralogix’s scalable metrics platform for alerting and analysis.

Since RESTful endpoints have different resources defined for each unique need, these separate graphs help find where problems are in the server. For example, if a single endpoint has high latency, it would bring up the average latency for the entire API. That endpoint can be isolated using the resource-specific graphs and fixed after checking other logs. With GraphQL endpoints, these resource-specific graphs are less valuable since GraphQL uses a single endpoint to access all endpoint data. So, while the graphs show an increased latency, users cannot know which resolvers are to blame for the problem.

Differences in Endpoint Traffic Monitoring

GraphQL and REST use fundamentally different techniques to get data for a client. Differences in how traffic is routed and handled highlight differences in how monitoring can be applied. 

Caching

Caching data allows for reducing the traffic requirements of your endpoint. The HTTP specification used by RESTful APIs has caching requirements. Different endpoints can set up caching based on which path semantics are used. Servers can cache GET requests according to HTTP. However, since GraphQL uses a single POST endpoint, these defined specifications do not apply to GraphQL. It is up to developers to implement caching for non-mutable (query) endpoints. It is also critical that developers implement their requirements to separate mutable (mutation) and non-mutable (query) functions on their GraphQL server. 

Resource Fetching 

REST APIs typically require data chaining to get a complete data set. Clients first retrieve data about a user, then can retrieve other vital data subsequently using different calls. By design, REST endpoints are generally split to get data separately and point to different, single resources or databases. GraphQL, on the other hand, was designed to have a single endpoint that can point at many resources. So, clients can retrieve more data with a single query. GraphQL endpoints tend to require less traffic. This fundamental difference emphasizes the importance of traffic monitoring on REST endpoints over that need in GraphQL servers.

Summary

GraphQL uses a single HTTP endpoint for all functions and allows different requests to route to the appropriate location in the GraphQL server. Monitoring these endpoints can be more difficult since only a single endpoint is used. Log analytics plays a vital role in troubleshooting GraphQL endpoints because GraphQL monitoring is a uniquely tricky challenge.

RESTful endpoints use HTTP endpoints for each available request. Each request will return an appropriate status code and message based on whether the request was successful or not. Status codes can be used to monitor the health of the system and logs used to troubleshoot when functionality is not as expected. 

Third-party metrics tools can be used to monitor and alert on RESTful endpoints using status codes. Log analytics tools will help developers isolate and repair issues in both GraphQL and RESTful endpoints. 

QA Activities– What Should You Keep In Mind?

When your development team is under pressure to keep releasing new functionality in order to stay ahead of the competition, the time spent on quality assurance (QA) activities can feel like one overhead that you could do without. After all, with automated CI/CD pipelines enabling multiple deployments per day, you can get a fix out pretty quickly if something does go wrong – so why invest the time in testing before release?

The reality is that scrimping on software testing is a false economy. By not taking steps to assure the quality of your code before you release it, you’re leaving it up to your users to find and report bugs. At best this will create the impression that your product isn’t reliable and will damage your reputation. 

At worst, data losses, security breaches, or regulatory non-compliance could result in serious financial consequences for your business. And if that wasn’t sufficient reason to invest in QA activities, the sheer complexity of most software means that – unless you test your changes – there’s a good chance that for each bug you fix you’ll introduce at least one more, leaving you with less time to focus on delivering new functionality, rather than more.

So how can you make software testing both efficient and effective? The key is to build quality from the start. Rather than leaving your QA activities until the product is complete and ready to release, continuously testing changes as you go means you can fix bugs as soon as they are introduced. That will save you time in the long run, as you avoid building more functionality on top of bad code only to unpick it later when you address the root cause.

However, testing more frequently is not a realistic proposition if you’re doing all your testing manually. Not only is manual testing time-consuming – for many types of testing, it’s also not a good use of your or your colleague’s time. That’s why high-performing software development teams invest in automated testing as part of their CI/CD pipeline, combined with manual testing in situations where it adds the most value.

Automatable QA activities

Automating your tests means you can get feedback on your changes just by running a script, which makes it feasible to test your changes far more regularly. Just as with manual testing, for automated testing to be effective, you need to cover multiple types of tests, from fine-grained unit tests to high-level functionality checks and UI tests. Let’s explore the types of testing that lend themselves well to automation, starting with the simplest.

Static analysis

Static analysis is one of the easiest forms of automated QA activities to introduce. Static analysis tools check your source code for known errors and vulnerabilities and you can run them from your IDE. While they can’t catch every error, they give you a basic level of assurance.

Unit tests

Unit tests usually form the lowest level of testing as they exercise the smallest units of functionality. Developers typically write unit tests as they code and many teams use code coverage metrics as an indication of the health of their codebase. Because unit tests are very small, they are quick to run and it’s common for developers to run the test suite locally before committing their changes.

Integration and contract tests

Integration tests verify the interactions between different pieces of functionality within the system, while contract tests provide validation for external dependencies. While these tests can be executed manually as a form of white-box testing, scripting them ensures they run consistently each time, meaning you can run them as often as you want and while also providing faster feedback.

Functional and end-to-end testing

Functional or end-to-end tests exercise your whole application by emulating user workflows. These types of tests tend to be more complex to write and maintain, particularly if they are driven through the UI, as they can be affected by any changes to the system.

Functional tests can be run both as smoke tests and as regression tests. Smoke testing refers to a subset of tests that are run early on in the CI/CD process to confirm that the core functionality still works as expected. If any of those tests fail, there is little point in checking the finer details as issues will have to be fixed and a new build created before any changes can be released.

By contrast, regression testing refers to a more comprehensive set of tests designed to ensure that none of the existing functionality from the previous release has been lost. Depending on the degree of automated testing you already have and the maturity of your CI/CD pipeline, you might choose to automate only smoke tests at first (as these will be run most frequently) and add a full suite of regression tests later once you have more time.

Browser, device, and platform testing

For many types of software, environment testing forms an important aspect of functional testing. It involves verifying that your application’s behavior is consistent and as expected when running on different devices, operating systems, and browsers (as applicable). 

While the level of repetition involved makes these tests a good candidate for automation, maintaining functional tests across a range of environments can itself be expensive, so it’s a good idea to prioritize based on the most commonly used environments.

Building an automated testing pipeline

While the above types of testing can all be automated, that does not mean they should be treated equally. When you’re building up your automated testing capability, frameworks such as the test pyramid provide a useful way to plan and structure your tests for maximum efficiency. Starting at the bottom of the pyramid with low level unit tests that are quick to run provides the largest return on investment as well-designed unit tests can identify a lot of issues.

When prioritizing integration, contract, and functional tests, focus first on areas that pose the highest risk and/or will save the most time. If you’re transitioning from manual to automated tests, your existing test plans will provide a good starting point for identifying the resource commitment and time required for each testing activity.

Manual software testing

Given the range of software testing activities that can be automated, where does that leave manual testing? Automated testing makes use of machines to perform repetitive tasks – if you’re able to define in advance what needs to happen and what the result should be, and you need to run the test more than once, then it’s far more efficient to write a script than do it by hand.

Conversely, if you don’t know exactly what you’re looking for or it’s a new part of the system, then this is a good time for your QA team members to demonstrate their ingenuity. Exploratory testing of new functionality and acceptance testing for new features are not tasks that can or should be automated. While acceptance testing benefits from nuance and discretion in determining whether the requirements have been met, exploratory testing relies on human imagination to find unexpected uses that stretch the system to its limits.

When you do discover a bug, documenting the issue with details of the platform (device, OS, and browser as applicable), the steps to reproduce it and supporting screenshots, the expected behavior, and the actual output ensures that whoever picks up the ticket has all the information they need to fix it. 

Adding an assessment of the severity of impact and frequency of occurrence will also help your team prioritize the ticket. Findings from any manual testing should also feed into your automated tests so that your test suite becomes more robust over time.

Managing quality in production

If you’re automating what you can and using manual testing effectively, then quality assurance is an investment that pays dividends. But with so many QA activities taking place before your code is released, you may be wondering what’s left to go wrong in production. Unfortunately, the sheer complexity of software and the many variables – from device and platform to user interactions and variations in data – mean it’s impossible to test every possible eventuality.

The good news is that you can mitigate the damage caused by issues in production by building observability into your system and proactively monitoring the data your system generates. By maintaining an accurate picture of normal operations, you can identify issues as they emerge and take steps to contain the impact or release a fix quickly.

What is eBPF and Why is it Important for Observability?

Observability is one of the most popular topics in technology at the moment, and that isn’t showing any sign of changing soon. Agentless log collection, automated analysis, and machine learning insights are all features and tools that organizations are investigating to optimize their systems’ observability. However, there is a new kid on the block that has been gaining traction at conferences and online: the Extended Berkeley Packet Filter, or eBPF. So, what is eBPF?

Let’s take a deep dive into some of the hype around eBPF, why people are so excited about it, and how best to apply it to your observability platform. 

What came out of Cloud Week 2021?

Cloud Week, for the uninitiated, is a week-long series of talks and events where major cloud service providers (CSPs) and users get together and discuss hot topics of the day. It’s an opportunity for vendors to showcase new features and releases, but this year observability stole the show.

Application Performance Monitoring

Application Performance Monitoring, or APM, is not particularly new when it comes to observability. However, Cloud Week brought a new perception of APM: using it for infrastructure. Putting both applications and infrastructure under the APM umbrella in your observability approach not only streamlines operations but also gives you top-to-bottom observability for your stack.

Central Federated Observability

Whilst we at Coralogix have been enabling centralized and federated observability for some time (just look at our data visualization and cloud integration options), it was a big discussion topic at Cloud Week. Federated observability is vital for things like multi-cloud management and cluster management, and centralizing this just underpins one of the core tenets of observability. Simple, right?

eBPF

Now, not to steal the show, but eBPF was a big hit at Cloud Week 2021. This is because its traditional use (in security engineering) has been reimagined and reimplemented to address gaps in observability. We’ll dig deeper into what eBPF is later on!

What is eBPF – an Overview and Short History

Around 2007, the Berkeley Packet Filter (BPF) was designed to filter network packets and collect those packets based on predetermined rules. The filters took the form of programs that then run on a standard VM. However, the BPF quickly became outdated by the progression to 64-bit processors. So what is eBPF and how is it different?

It wasn’t until 2014 that the eBPF was introduced. eBPF is aligned to modern hardware standards (64-bit registers). It’s a Linux kernel technology (version 4.x and above) and allows you to bridge traditional observability and security gaps. It does this by allowing programs that assist with security and/or monitoring to continue running without having to alter the kernel source code or debug, essentially by running a virtual machine inside the kernel.

Where can you use eBPF?

As we’ve covered, eBPF isn’t brand new, but it is fairly nuanced when applied to a complex observability scenario. 

Network Observability

Network observability is fundamental for any organization seeking total system observability. Traditionally, network or SRE teams would have to deploy myriad data collection tools and agents. This is because, in complex infrastructure, organizations will likely have a variety of on-premise and cloud servers from different vendors, with different code levels and operating systems for virtual machines and containers. Therefore, every variation could need a different monitoring agent. 

Implementing eBPF does away with these complexities. By installing a program at a kernel level, network and SRE teams would have total visibility of all network operations of everything running on that particular server. 

Kubernetes Observability

Kubernetes presents an interesting problem for observability, because of the number of kernels with different operating systems that you might be running across your system. As mentioned above, this makes monitoring things like their network usage and requirements exceptionally difficult. Fortunately, there are several eBPF applications to make Kubernetes observability a lot easier. 

Dynamic Network Control

At the start, we discussed how eBPF uses predetermined rules to monitor and trace things like network performance. Combine this with network observability above, and we can see how this makes life a lot simpler. However, these rules are still constants (until they’re manually changed), which can make your system slow to react to network changes.

Cilium is an open-source project that seeks to help with the more arduous side of eBPF administration: rule management. On a packet-by-packet basis, Cilium can analyze network traffic usage and requirements and automatically adjust the eBPF rules to accommodate container-level workload requirements. 

Pod-level Network Usage

eBPF can be used to carry out socket filtering at the cgroup level. So, by installing an eBPF program that monitors pod-level statistics, you can get granular information that would only normally be accessible in the /sys Linux directory. Because the eBPF program has kernel access, it can deliver more accurate information with context from the kernel.

What is eBPF best at – the Pros and Cons of eBPF for Observability

So far, we’ve explored what eBPF is and what it can mean for your system observability. Sure, it can be a great tool when utilized in the right way, but that doesn’t mean it’s without its drawbacks. 

Pro: Unintrusive 

eBPF is a very light touch tool for monitoring anything that runs with a Linux kernel. Whilst the eBPF program sits within the kernel, it doesn’t alter any source code which makes it a great companion for exfiltrating monitoring data and for debugging. What eBPF is great at is enabling clientless monitoring across complex systems. 

Pro: Secure

As above, because an eBPF program doesn’t alter the kernel at all, you can preserve your access management rules for code-level changes. The alternative is using a kernel module, which brings with it a raft of security concerns. Additionally, eBPF programs have a verification phase that prevents resources from being over-utilized. 

Pro: Centralized

Using an eBPF program gives you monitoring and tracing standards with more granular detail and kernel context than other options. This can easily be exported into the user space and ingested by an observability platform for visualization

Con: It’s very new

Whilst eBPF has been around since 2017, it certainly isn’t battle-tested for more complex requirements like cgroup level port filtering across millions of pods. Whilst this is an aspiration for the open-source project, there is still some work to go.

Con: Linux restrictions 

eBPF is only available on the newer version of Linux kernels, which could be prohibitive for an organization that is a little behind on version updates. If you aren’t running Linux kernels, then eBPF simply isn’t for you.

Conclusion – eBPF and Observability

There’s no denying that eBPF is a powerful tool, and has been described as a “Linux superpower.” Whilst some big organizations like Netflix have deployed it across their estate, others still show hesitancy due to the infancy and complexity of the tool. eBPF certainly has applications beyond those listed in this article, and new uses are still being discovered. 

One thing’s for certain, though. If you want to explore how you can supercharge your observability and security, with or without tools like eBPF, then look to Coralogix. Not only are we trusted by enterprises across the world, but our cloud and platform-agnostic solution has a range of plugins and ingest features designed to handle whatever your system throws at it. 

The world of observability is only going to get more complex and crowded as tools such as eBPF come along. Coralogix offers simplicity.

Introducing Cloud Native Observability

The term ‘cloud native’ has become a much-used buzz phrase in the software industry over the last decade. But what does cloud-native mean? The Cloud Native Computing Foundation’s official definition is:


Cloud-native technologies empower organizations to build and run scalable applications in modern, dynamic environments such as public, private, and hybrid clouds…These techniques enable loosely coupled systems that are resilient, manageable, and observable.”

From this definition, we can differentiate between cloud-native systems and monoliths which are a single service run on a continuously available server. Like Amazon’s AWS or Google Azure, large cloud providers can run serverless and cloud-native systems. Serverless systems are a subset of cloud-native systems where the hardware settings are completely abstracted from developers. Private servers maintained by private companies can also run cloud-native services.

The critical point to consider is that cloud-native solutions have unique observability problems. Developing, troubleshooting, and maintaining monolithic services is quite different from troubleshooting cloud-native services. This article will introduce some of the unique issues presented in cloud-native computing, and tools that allow users to gain cloud-native observability. 

Challenges and opportunities of the cloud

Cloud-native infrastructure provides many benefits over traditional monolithic architecture. These distributed computing solutions provide scalable, high-performing systems that can be upgraded rapidly without system downtime. Monoliths were sufficient for demand in the earlier computer-era days but could not scale well. The tradeoff for cloud native’s agility is an obfuscated troubleshooting process. 

With new techniques in software infrastructure also came new techniques in cloud-native observability. Tools to centralize and track data as it flows through a system have become paramount to troubleshooting and understanding where issues might arise. 

User expectations

Cloud-native systems by design make scaling easier by simply adding more infrastructure for existing software to run on. Scaling may occur by adding more physical servers or increasing cloud computing capacity with your chosen provider. Businesses need to be able to detect when scaling is necessary to accommodate all potential customers.

Along with scaling systems, adding additional features to your offering is crucial to growing your business. Cloud-native solutions allow development teams to produce features that can plug onto existing services quickly. Even with significant testing, features can have unseen flaws until they are deployed and running in the system for some time.

It is crucial to have cloud observability tools to monitor the system and alert the appropriate team when issues arise. Without such a service, users will be the first to discover issues that will hurt the business. 

Distributed Systems

Cloud-native services run as distributed systems with many different software pieces interacting with each other. Systems may have many containers, compute functions, databases, and queues interacting in different ways to make up a unified feature. As well, different features may use the same infrastructure.

When an issue arises in a system or a connection, isolating the issue can be difficult. Logging remains as crucial as it was with monolithic solutions. However, logging alone is not sufficient to have complete cloud-native observability. Systems also need to understand how microservices are working together. Traces can be used to track requests through a system. Metrics can also be used to understand how many requests or events are occurring so teams can quickly detect and isolate issues.

New tools are being introduced into the software industry to help teams rapidly fix production issues. Since distributed systems are ideal for rapid changes, fixes may be rapid as well. The more significant problem is that detecting issues becomes much more complex, primarily when developers have not implemented observability tools. Using a combination of logs, metrics, and traces and having all records stored in a centralized tool like Coralogix’s log analytics platform can help teams quickly jump over the troubleshooting hurdle to isolate the issues.

Ephemeral infrastructure

Cloud-native observability tools are available to deal with the ephemeral nature of systems. Cloud-native deployments are run on temporary containers when using cloud native. The containers will spin up and shut down automatically as system requirements change. If an issue occurs, the container will likely be gone by the time troubleshooting needs to occur. 

If systems use a serverless framework, teams are even more abstracted away from the hardware issues that may cause failures. Services like AWS and Azure can take complete control over the handling of servers. This abstraction allows companies to focus on a software core competency rather than managing servers both physically and through capacity and security settings. Without knowing how services run, systems have a limited ability to know what failed. Metrics and traces become critical tools to cloud-native observability in these cases.

Elastic scalability

Cloud-native systems typically use a setup that will scale services as user requirements ebb and flow. With higher usage, storage and computing require more capacity. This higher usage may not be consistent over time. When usage decreases, capacity should decrease in turn. Scaling capacity in this way allows businesses to be very cost-efficient, paying only for what they use. It can also allow them to allocate private servers to what is needed at that time, scaling back capacity for computing that is not time-critical. 

Cloud-native observability must include tracking the system’s elastic scaling. Metrics can be helpful to understand how many users or events are accessing a given service at any given time. Developers can use this information to fine-tune capacity settings to increase efficiency further. Metrics can also help to understand if part of the system has failed due to a capacity or scaling issue.

Monitoring usage

Cloud-native systems follow a new manner of designing and implementing systems. Since the construction of the systems is new, professionals need also to consider new methods of implementing security practices. Monitoring is key to securing your cloud-native solution.

With monolithic deployments, security practices partially focussed on securing endpoints and the perimeter of the service. With cloud-native, services are more susceptible to attacks than previously. Shifting to securing data centers and services rather than only endpoints is critical. Detecting an attack also requires tools as dynamic as your service to observe every part of the infrastructure.

Security and monitoring tools should scale without compromising performance. These tools should also be able to contain nefarious behavior before it can spread to an entire system. Cloud-native observability tools are designed to help companies track where they may be vulnerable and, in some cases, even to detect an attack themselves.

Conclusion

Cloud-native solutions allow companies to create new features and fix issues quickly. Observability tools are key in cloud-native solutions since issues can be more obfuscated than in traditional software designs. Developers should implement observability tools into their systems from the first inception. Initial integration ensures tools are compatible with cloud providers and still leaves the ability to augment cloud-native observability tools in the future.

Microservices built on a cloud-native architecture can have multiple teams working on different features. Teams should implement observability tools to notify the appropriate person or team when an issue is detected. Tools that allow all team members to understand the health of the system are ideal. 

Discovering the Differences Between Log Observability and Monitoring

Log observability and log monitoring are terms often used interchangeably, but really they describe two approaches to solving and understanding different things. 

Observability refers to the ability to understand the state of a complex system (or series of systems) without needing to make any changes or deploy new code. 

Monitoring is the collection, aggregation, and analysis of data (from applications, networks, and systems) which allows engineers to both proactively and reactively deal with problems in production.

It’s easy to see why they’re treated as interchangeable terms, as they are deeply tied to each other. Without monitoring, there would be no observability (because you need all of that data that you’re collecting and aggregating in order to gain system observability). That said, there’s a lot more to observability than passively monitoring systems in case something goes wrong.

In this article, we will examine the different elements that make up monitoring and observability and see how they overlap. 

Types of Monitoring

Monitoring is a complex and diverse field. There are a number of key elements and practices that should be employed for effective monitoring. If monitoring refers to looking at a series of processes, and how they are conducted, whether they complete successfully and efficiently, then you should be aware of the following types of monitoring to build your monitoring practice.

Black and White Box Monitoring

Black box monitoring, also known as server-level monitoring, refers to the monitoring of specific metrics on the server such as disk space, health, CPU metrics, and load. At a granular level, this means aggregating data from network switches, load balancers, looking at disk health, and many other metrics that you may traditionally associate with system administration.

White box monitoring refers more specifically to what is running on the server. This can include things like queries to databases, application performance versus user requests, and what response codes your application is generating. White box monitoring is critical for application and web layer vulnerability understanding.

White and black box monitoring shouldn’t be practiced in isolation. Previously, more focus may have been given to black box or server-level monitoring. However, with the rise of the DevOps and DevSecOps methodologies, they are more frequently carried out in tandem. When using black and white box monitoring harmoniously, you can use the principles of observability to gain a better understanding of total system health and performance. More on that later!

Real-Time vs Trend Analysis

Real-time monitoring is critical for understanding what is going on in your system. It covers the active status of your environment, with log and metric data relating to things like availability, response time, CPU usage, and latency. Strong real-time analysis is important for setting accurate and useful alerts, which may notify you of critical events such as outages and security breaches. Log observability and monitoring depend heavily on real-time analysis.

Think of trend analysis as the next stage of real-time analysis. If you’re collecting data and monitoring events in your system in real-time, trend analysis is helpful for gaining visibility into patterns of events. This can be accomplished with a visualization tool, such as Kibana or native Coralogix dashboards.

Trend analysis allows organizations to correlate information and events from disparate systems which may together paint a better picture of system health or performance. Thinking back to the introduction of this piece, we can see where this might link into observability.

Performance Monitoring

Performance monitoring is pretty self-explanatory. It is a set of processes that enable you to understand either network, server, or application performance. This is closely linked to system monitoring, which may be the combination of multiple metrics from multiple sources. 

Performance monitoring is particularly important for organizations with customer-facing applications or platforms. If your customers catch problems before you do, then you risk reputational or financial impact. 

Analyzing Metrics

Good monitoring relies on the collection, aggregation, and analysis of metrics. How these metrics are analyzed will vary from organization to organization, or on a more granular level, from team to team.

There is no “one size fits all” for analyzing metrics. However, there are two powerful tools at your disposal when considering metric analysis. 

Visualization 

Data visualization is nothing particularly new. However, its value in the context of monitoring is significant. Depending on what you choose to plot on a dashboard, you can cross-pollinate data from different sources which enhances your overall system understanding.

For example, you might see on a single dashboard with multiple metrics that your response time is particularly high during a specific part of the day. When this is overlaid with network latency, CPU performance, and third-party outages, you can gain context.

Context is key here. Visualization gives your engineers the context to truly understand events in your system, not as isolated incidents, but interconnected events.

Machine Learning

The introduction of machine learning to log and metric analysis is an industry-wide game changer. Machine learning allows predictive analytics based on your current system health and status and past events. Log observability and monitoring are taken to the next level by machine learning practices.

Sifting through logs for log observability and monitoring is an often time-consuming task. However, tools like Loggregation effectively filter and promote logs based on precedent, without needing user intervention. Not only does this save time in analysis, which is particularly important post-security events, but it also means your logging system stays lean and accurate.

Defining Rules

Monitoring traditionally relies on rules which trigger alerts. These rules often need to be fine-tuned over time, because setting rules to alert you of things that you don’t know are going to happen in advance is difficult.

Additionally, rules are only as good as your understanding of the system they relate to. Alerts and rules require a good amount of testing, to prepare you for each possible eventuality. While machine learning (as discussed above) can make this a lot easier for your team, it’s important to get the noise-to-signal ratio correct.

The Noise-to-Signal Ratio

This is a scientific term (backed up by a formula), which helps to define what the acceptable level of background noise is for clear signals or, in this case, insights. In terms of monitoring, rules, and alerts; we’re talking about how many false or acceptable error messages there are in combination with unhelpful log data. Coralogix has a whole set of features that help filter out the noise, while ensuring the important signals reach their target, to help defend your log observability and monitoring against unexpected changes in data.

From Monitoring to Observability

So what is the difference then? 

Monitoring is the harvesting and aggregation of data and metrics from your system. Observability builds on this and turns the harvested data into insights and actionable intelligence about your system. If monitoring provides visibility, then observability provides context.

A truly observable system provides all the data that’s needed in order to understand what’s going on, without the need for more data. Ultimately, an observability platform gives you the ability to see trends and abnormalities as they emerge, instead of waiting for alerts to be triggered. A cornerstone of your observability is log observability and monitoring. 

In this way, you can use marketing metrics as a diagnostic tool for system health, or even understand the human aspect of responses to outages by pulling in data from collaboration tools.

Log Observability and Monitoring

Monitoring and observability shouldn’t be viewed in isolation: the former is a precursor to the latter. Observability has taken monitoring up a few notches, meaning that you don’t need to know every question you’ll ask of your system before implementing the solution.

True observability is heterogeneous, allowing you to cross-analyze data from your Kubernetes cluster, your firewall, and your load balancer in a single pane of glass. Why? Well, you might not know why you need it yet, but the beauty of a truly observable system is that it’s there when you need to query it. 

As systems grow ever more advanced, and there are increasing numbers of variables in play, a robust observability platform will give you the information and context you need to stay in the know.