Observability and Cyber Resiliency – What Do You Need To Know?

Observability is one of the biggest trends in technology today. The ability to know everything, understand your system, and analyze the performance of disparate components in tandem is something that has been embraced by enterprises and start-ups alike.

What additional considerations need to be made when factoring in cyber resiliency? A weekly review of the headlines reveals a slew of news covering data breaches, insider threats, or ransomware. The latter is particularly of concern, with multinationals and government institutions having their precious data ransomed for millions of dollars of cryptocurrency by faceless hackers.

In this article, we’ll examine two stances on the relationship between observability and cyber resiliency. First, we will look at the cyber resiliency considerations you need to be mindful of when implementing and configuring your observability solution. Then, we’ll move on to examining how a correctly deployed observability solution can empower your organization’s cyber resiliency.

Log data – cyber resiliency considerations

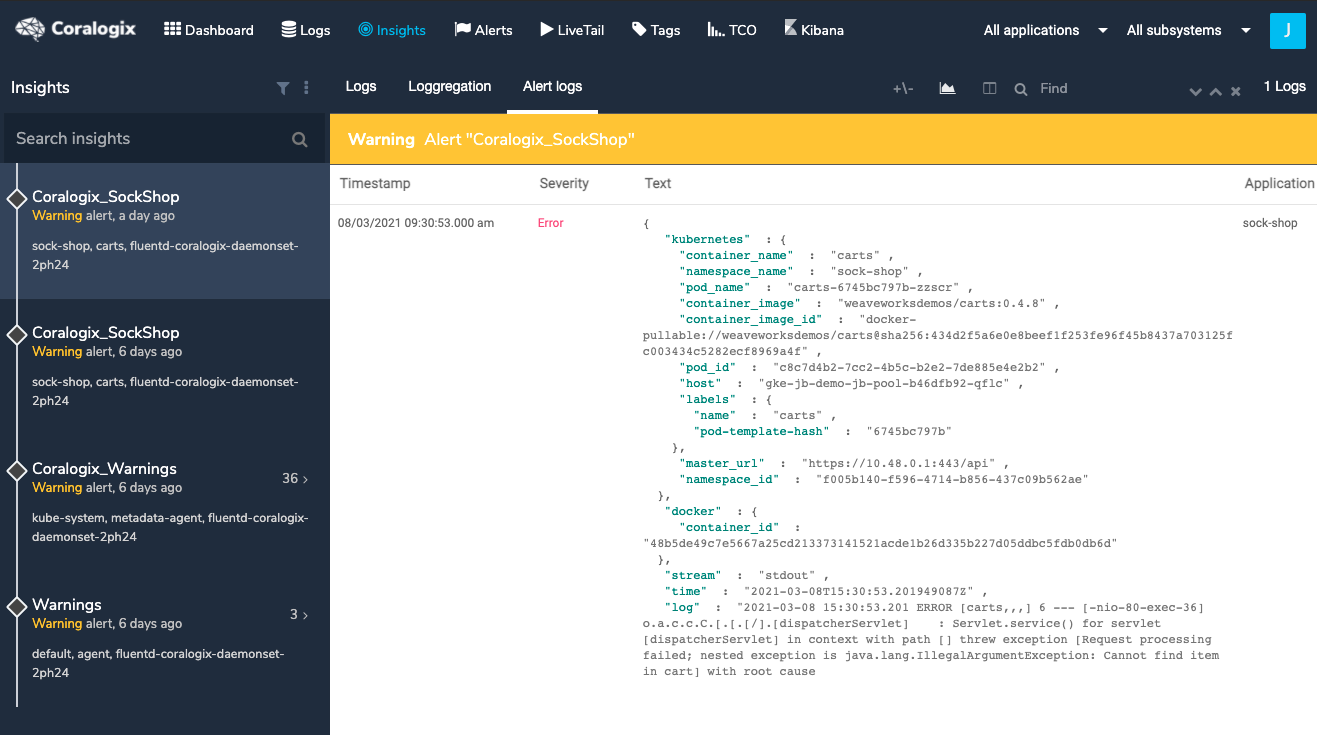
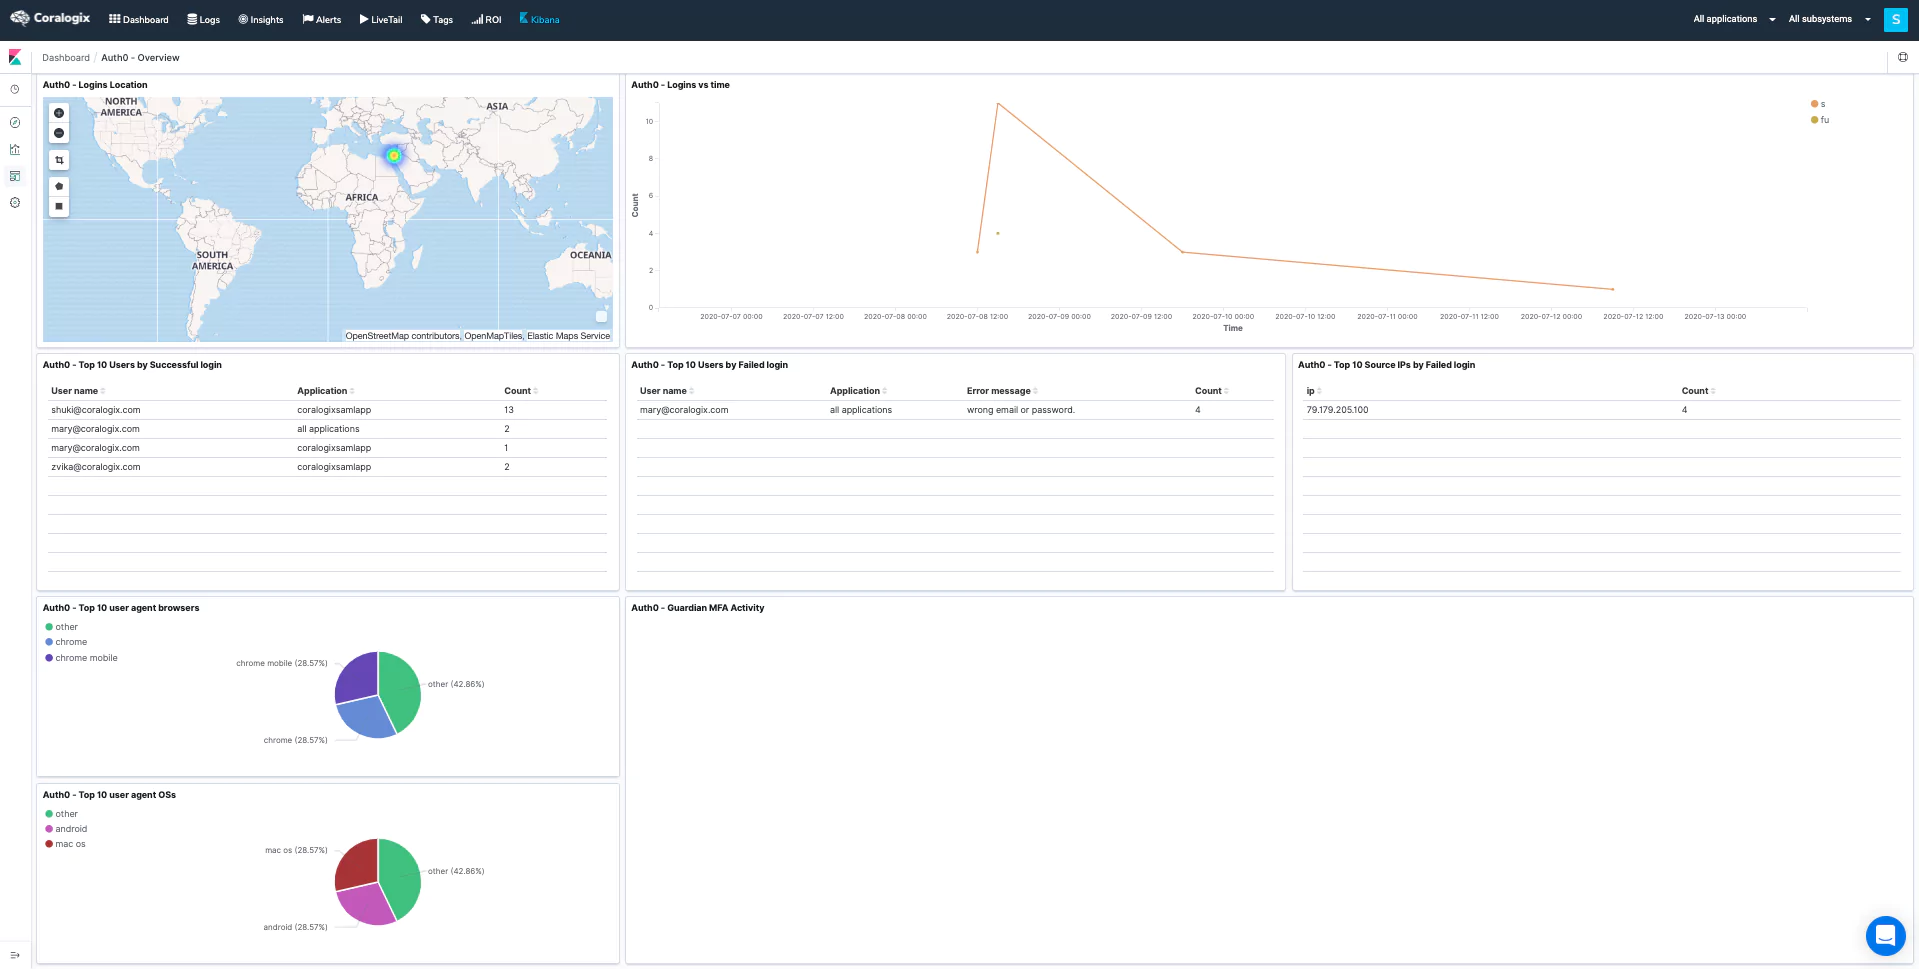
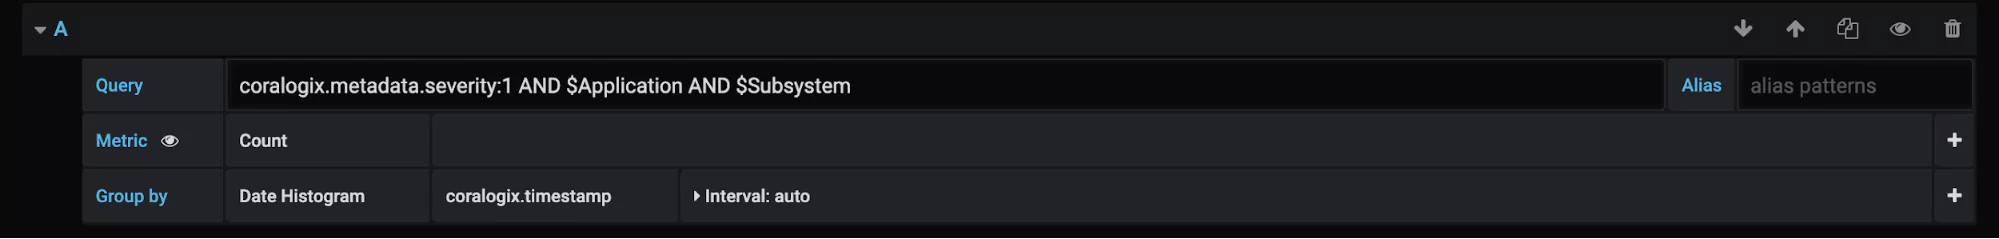
Logs are the indicators of what’s going on with your system. When they aren’t inside an observability platform, they are just rows and rows of raw textual data in a database. When examining the NIST Cyber Security Framework, logs are a big part of both the ‘identify’ and ‘detect’ pillars. The reason for this is simple. Logs are critical when it comes to identifying when a system is compromised.

How long should you keep your logs?

According to IBM, a company takes on average 197 days to identify a security breach. This means that a hacker could reside in your system, undetected, for well over half a year. If your log data is going to be a pivotal part of identifying an attack, as well as diagnosing one, you need to keep hold of them. As a guide then, any critical system logs (as well as any web or application facing systems) should be retained for at least a year.

Naturally, with any storage requirement, there will be costs associated with prolonged log retention. There are several ways that you can offset these additional costs, and Coralogix can help you understand the total cost of ownership associated with longer retention.

However, with the average cost of a data breach in 2020 coming in at $3.86 million, and knowing that you can save $1 million by containing a breach in under 30 days, it might be worth spending a little more on storage for your logs.

Securing your logs

If logs are one of the primary ways of detecting a security breach or understanding the impact of a security breach, then you have to ensure they are stored securely. This enables easier forensic analysis of all relevant data if you suspect a security breach has taken place. Some cyber insurance companies will even require that your logs be stored in a certain way as a part of your agreement.

Log Air-Gapping

Traditionally, for ease and cost, organizations will store log data on the same system or a connected system to the one being monitored. Unfortunately, this practice can do more harm than good. As hacking attacks have become more sophisticated, hackers are increasingly altering or removing logs to cover their tracks. Air-gapping your logs off to a cloud object store, like AWS S3, is the best practice for a cyber-resilient system.

Audit Log Immutability 

For the same reason as above, keeping your logs safe is important. Taking further steps, such as implementing immutability for log files, is a key consideration for cyber resilience.

Immutable audit logs are often requirements of security audits such as SOC2. Because audit logs are often indicators of which user accessed which database or application, or changed fundamental configurations, you should consider making them more resilient with immutability.

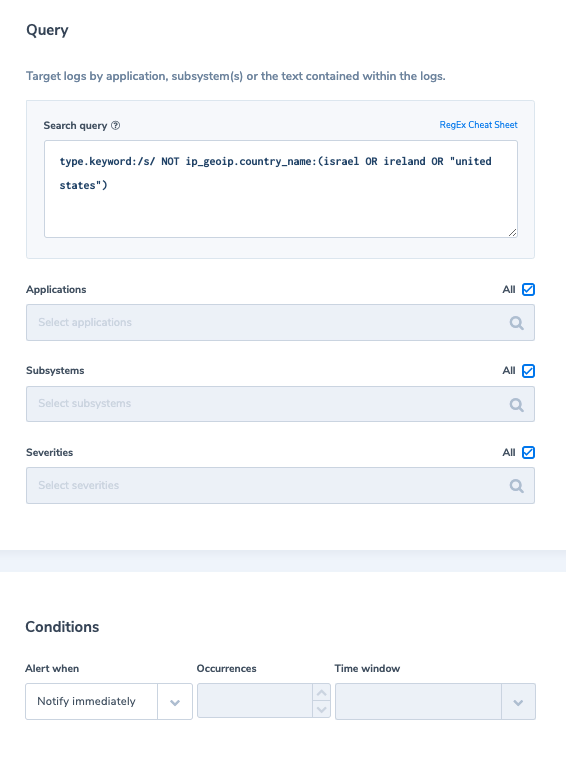
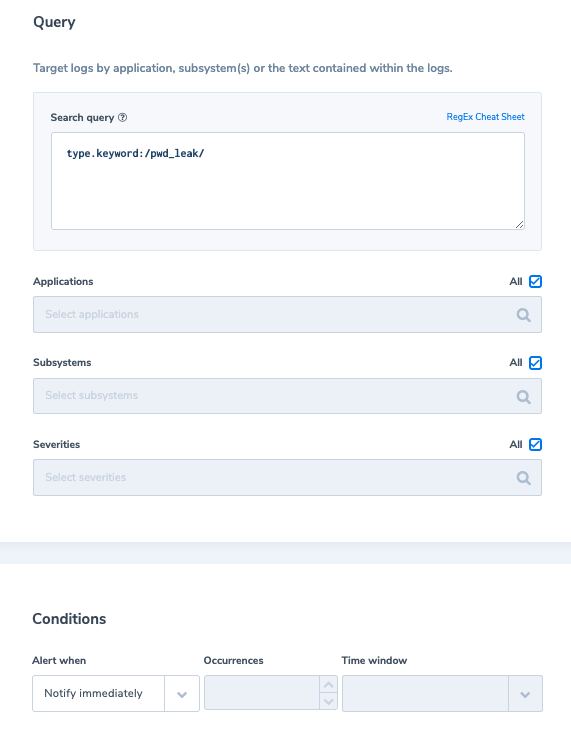
Sensitive Data in Logs

Keeping sensitive data in logs is a big no-no. Log data with credit card details, passwords, or other personal information that isn’t natively obscured or encrypted can cause you big issues. There are a few different ways that you can avoid security breaches in log data.

Password hashing, encryption, and salting are all options for decreasing the possible sensitivity of your log data. However, it may take a few more serious cybersecurity incidents before organizations treat log data with the same security considerations as they do production data.

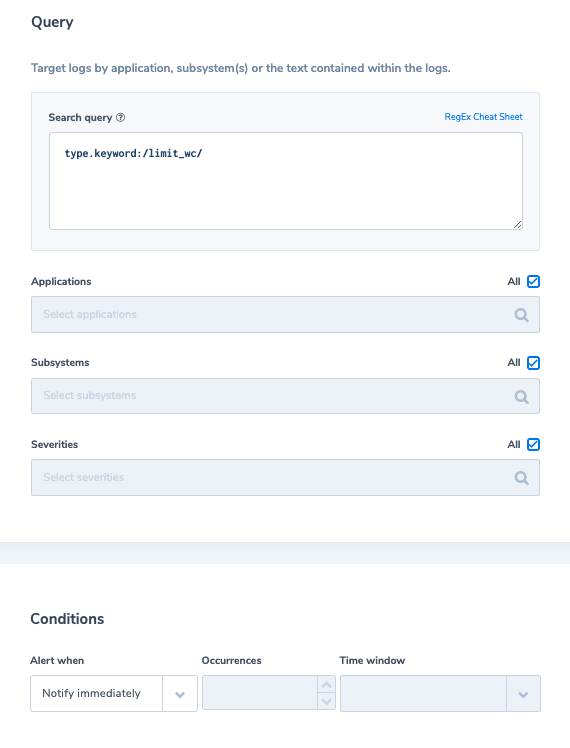
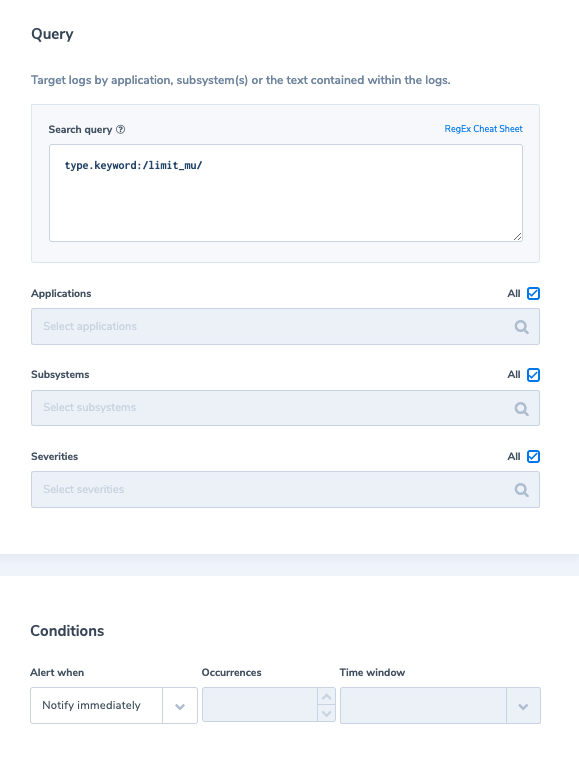
Observability for Cyber Resiliency – DDoS attacks

From 2019 to 2020, there was a 20% rise in DDoS attacks. Netscout went as far as to attribute the pandemic conditions to this rise, where users are overly reliant on eCommerce and streaming services, which are easy prey to such attacks.

A DDoS (distributed denial of service) attack is effectively where one malicious actor or group seeks to overwhelm a platform or service with traffic from an unmanageable and unforeseen number of sources. Cloudflare is widely regarded as one of the leaders in enterprise-grade DDoS protection. It can be used in conjunction with other aspects of your system, such as network load balancers, to manage and mitigate such attacks.

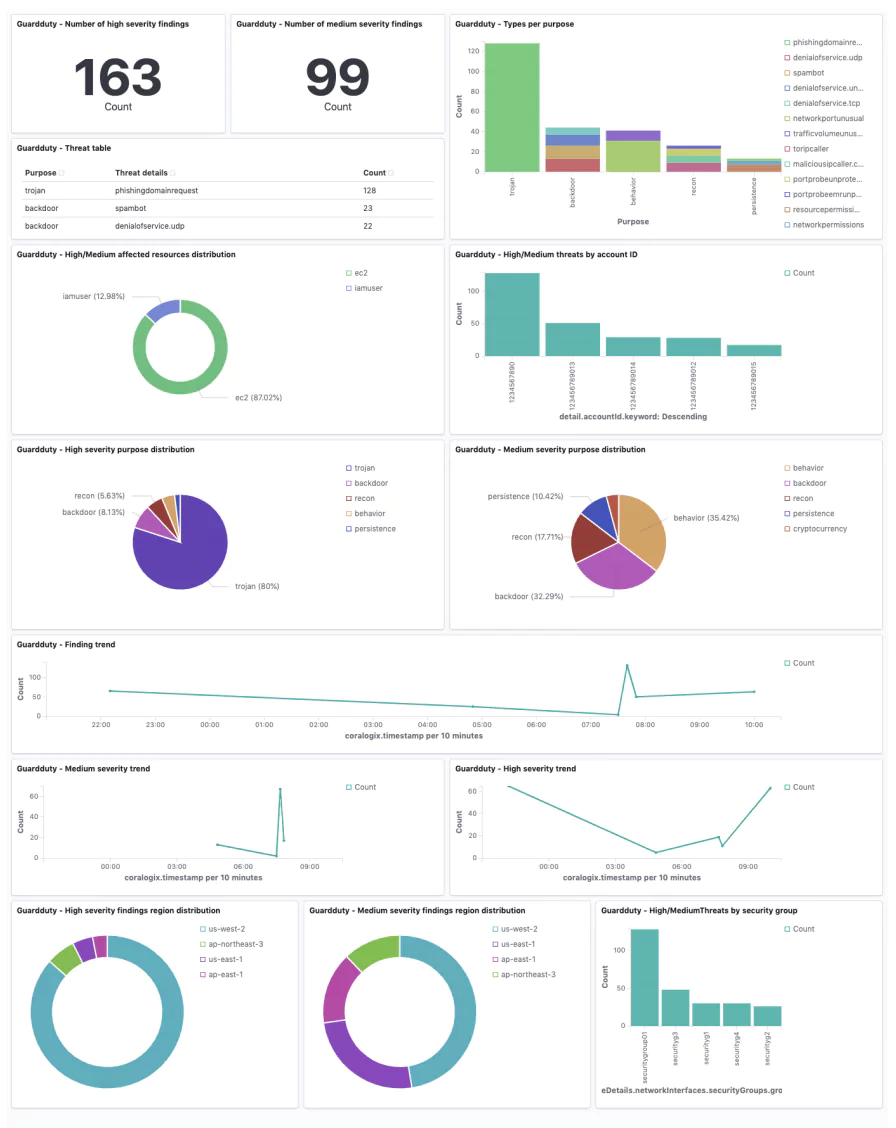
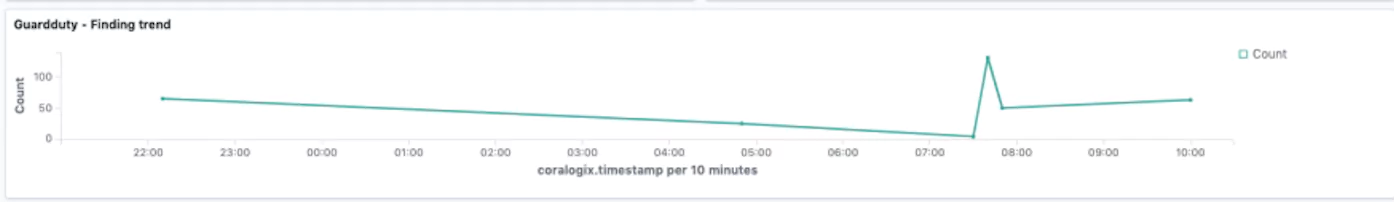
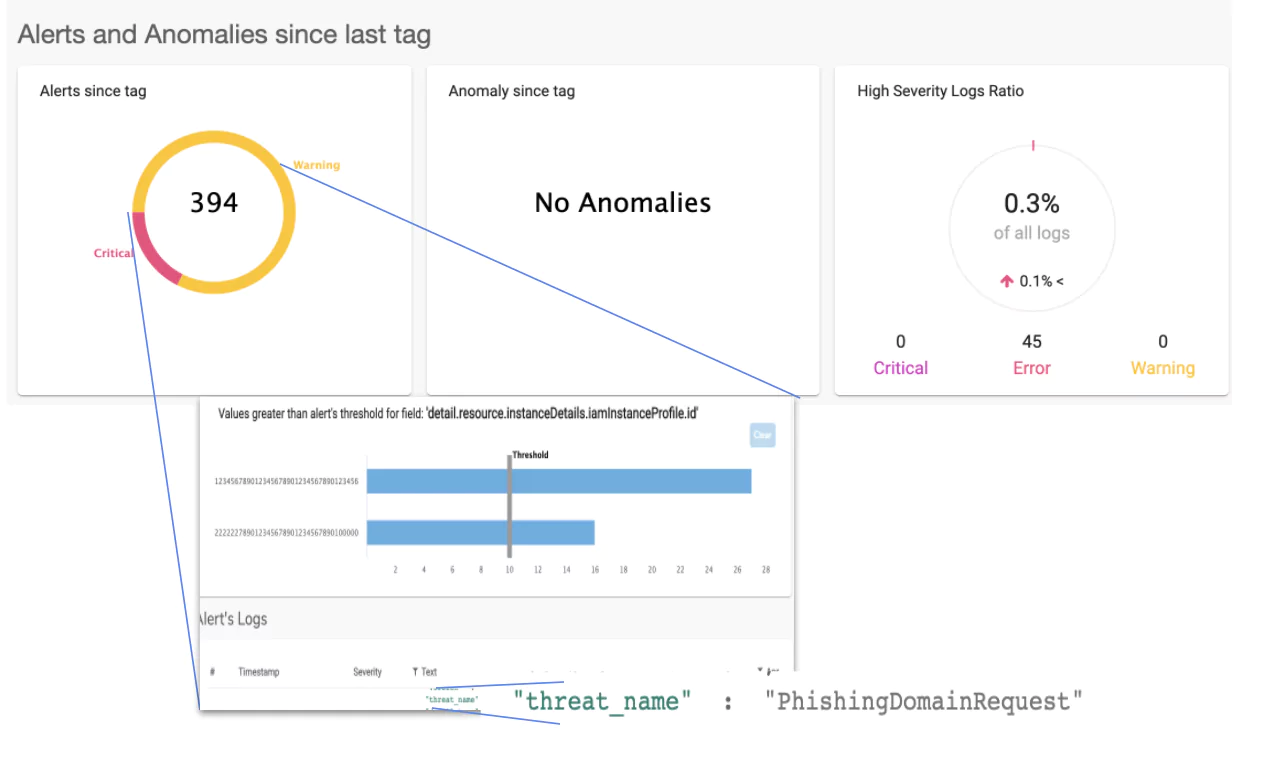
Coralogix for DDoS detection and prevention

Observability, when properly deployed and understood, has the opportunity to be a huge asset in your cyber resilience toolkit. Coralogix has integrations with Cloudflare and Cloudflare’s audit log function. By combining data from Cloudflare with other relevant metrics, you can effectively enable an early DDoS warning system. 

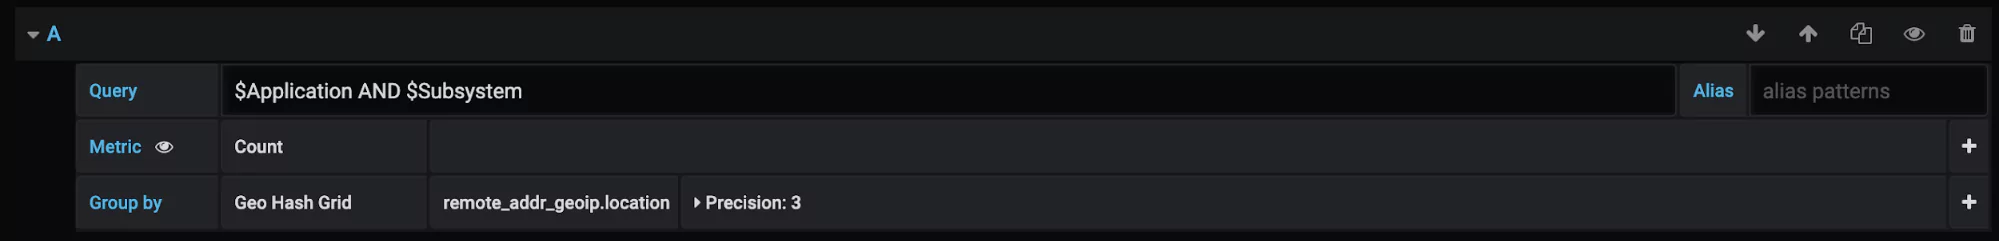
For example, you might seek to use the Security Traffic Analyzer (STA) to collect data from the load balancers within AWS. This data can provide you with a full readout on the security posture of your organization’s AWS usage. 

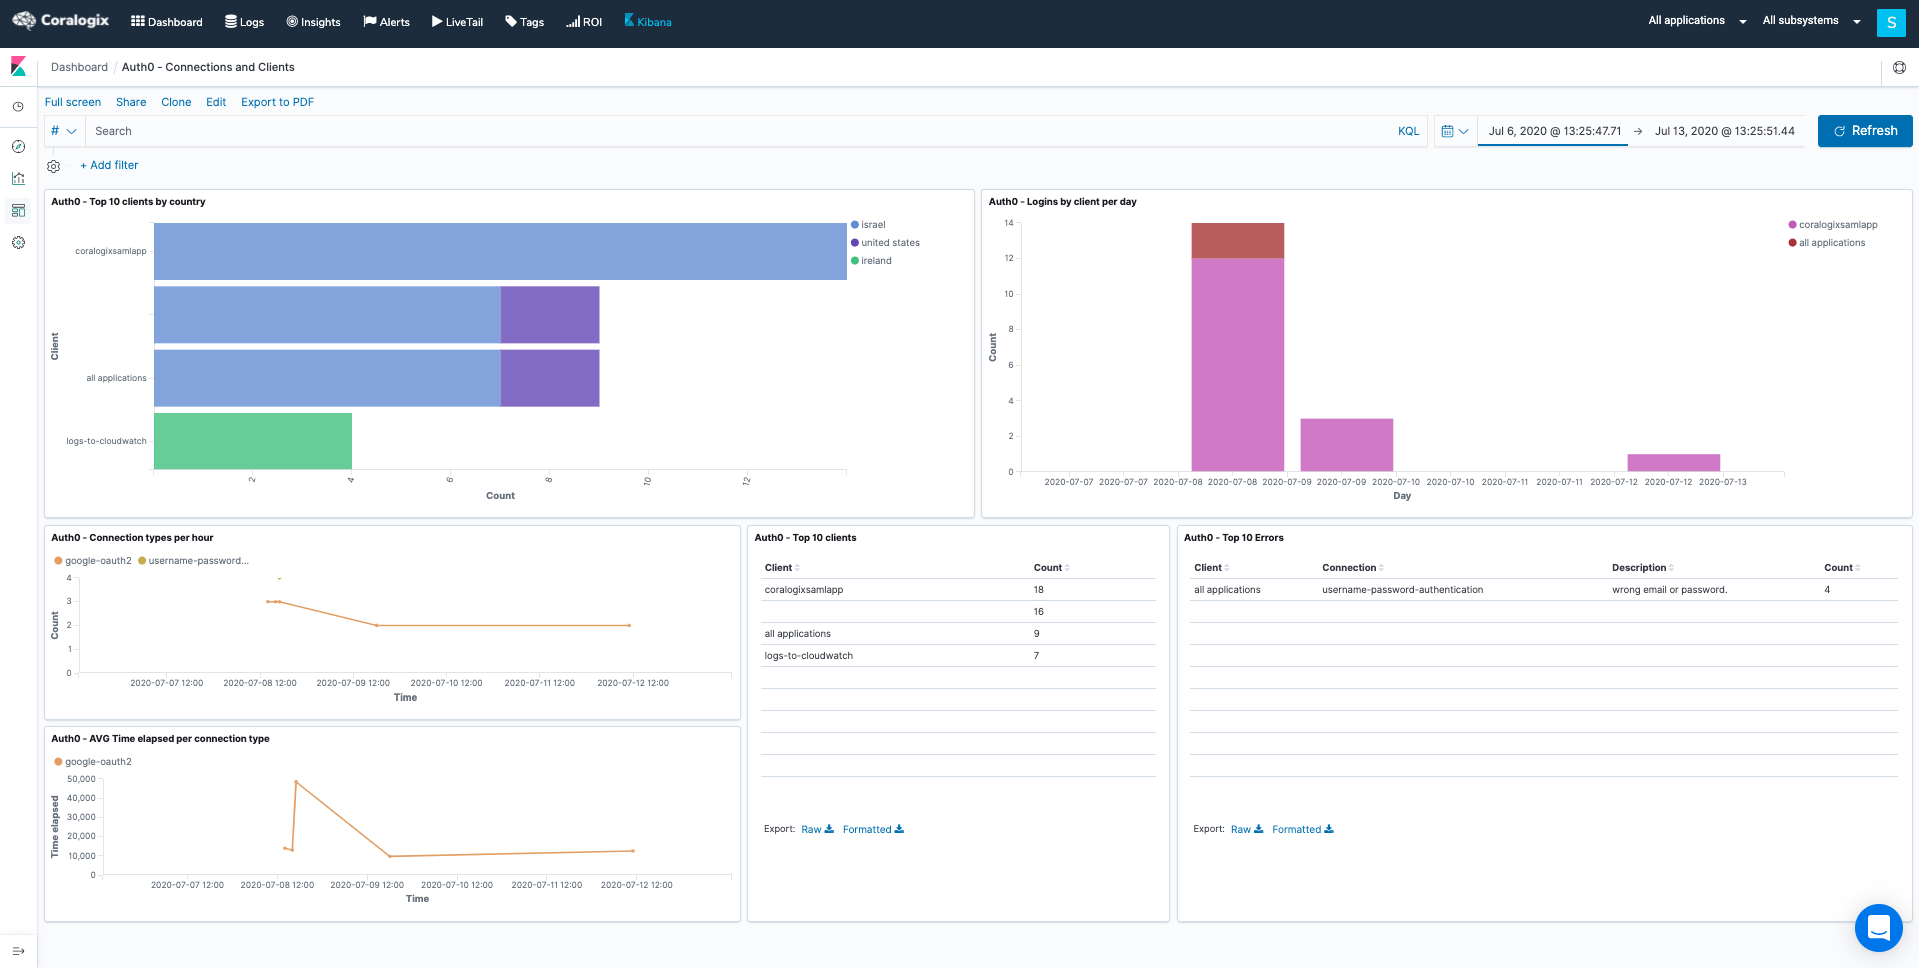
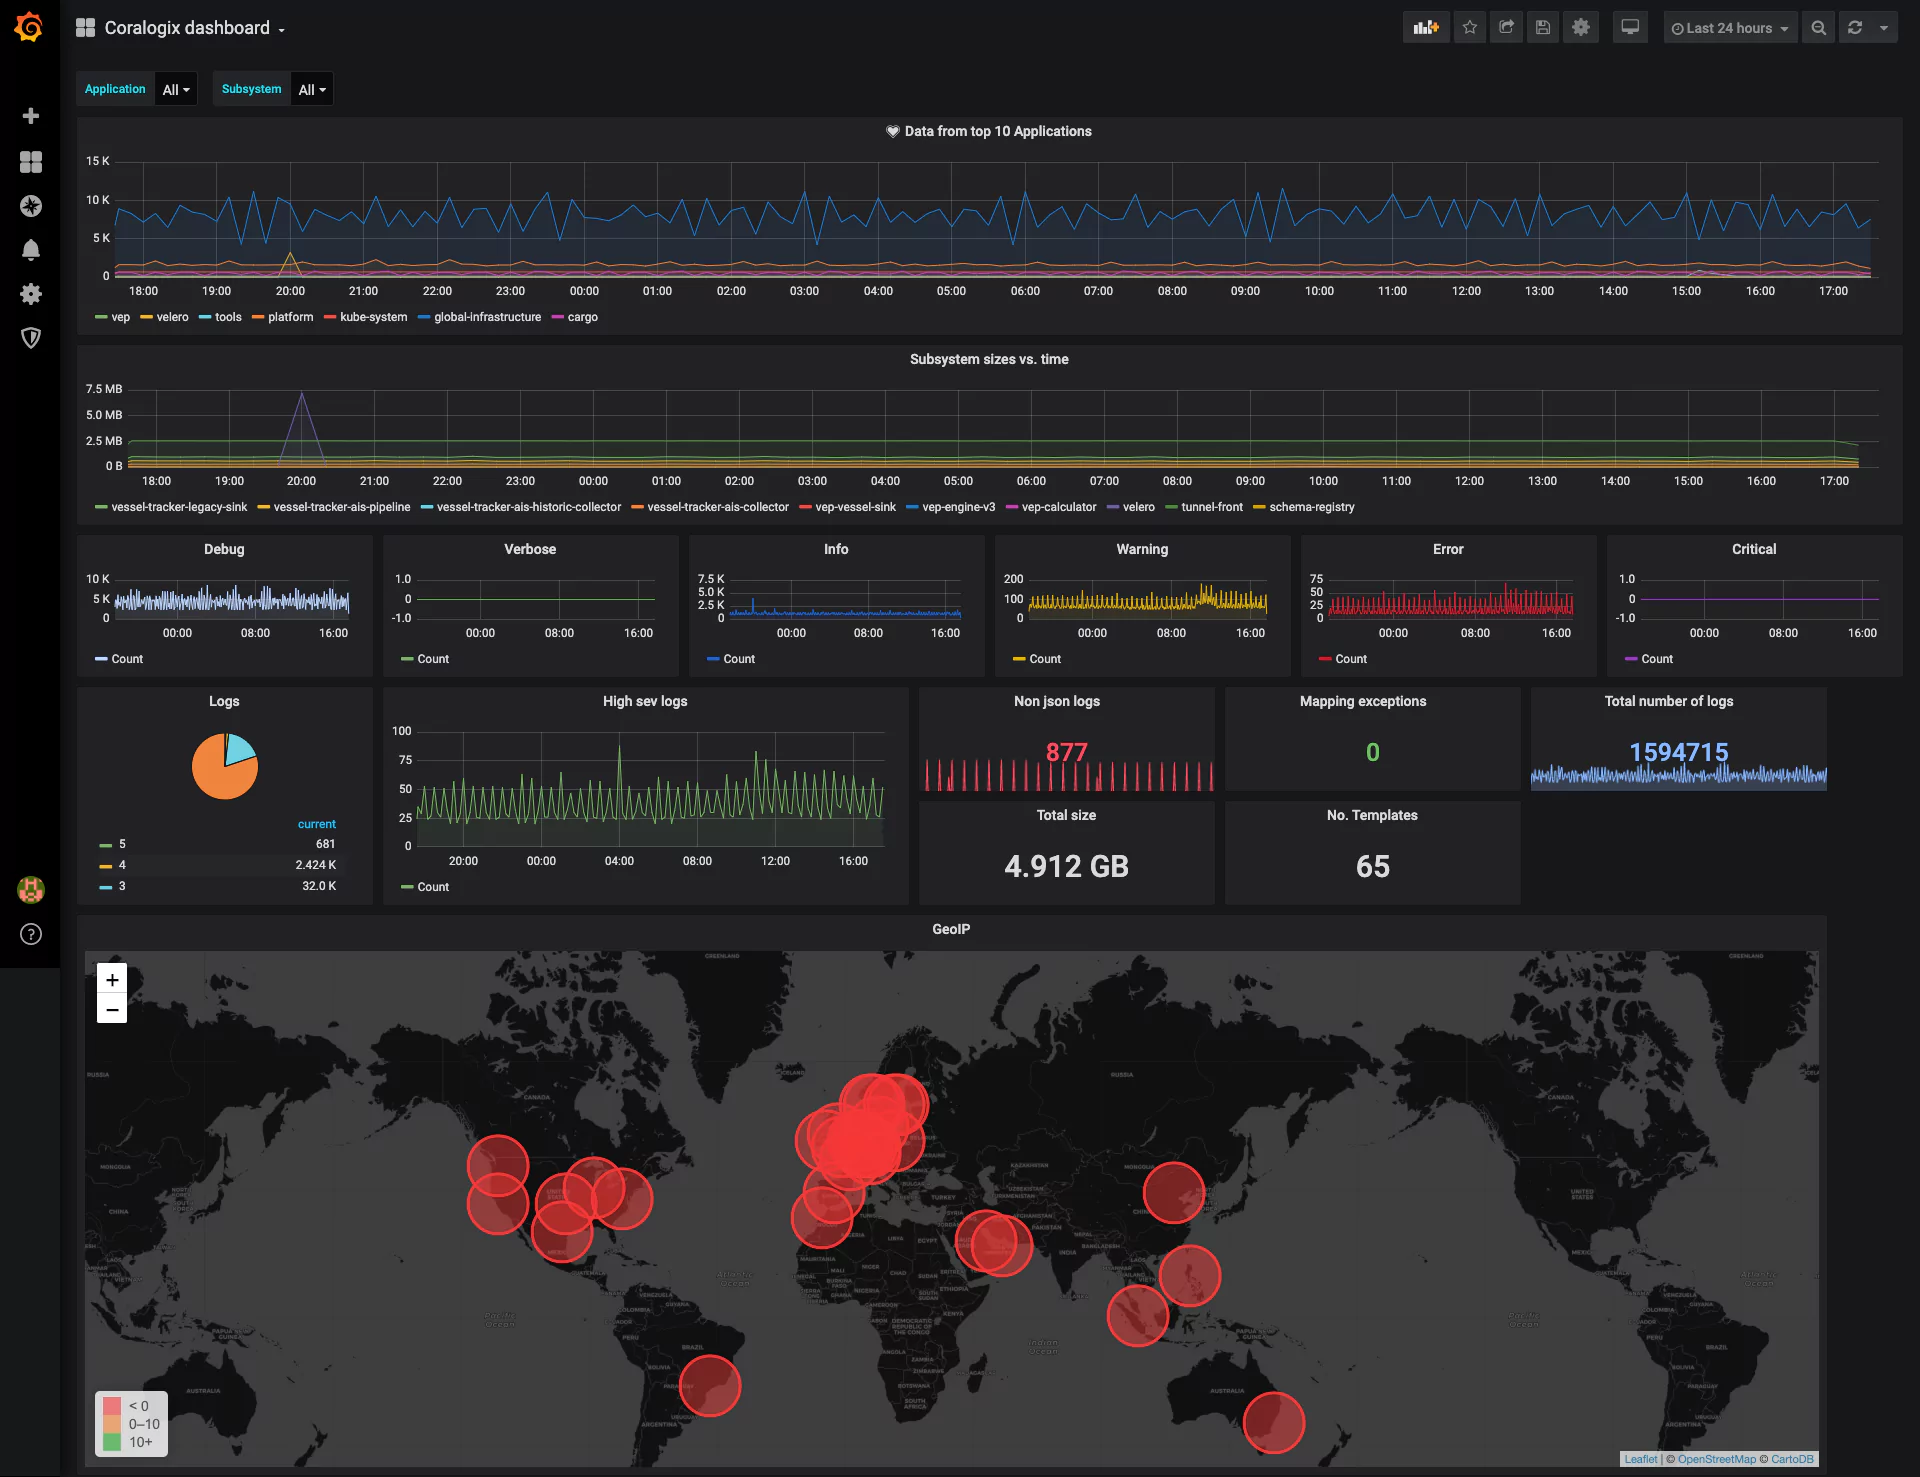
The combination of STA and Cloudflare data in the Coralogix dashboard gets to the heart of why observability is powerful for cyber resiliency. The ability to cross-analyze these metrics in a visualization tool gives you real-time insights into threats like DDoS attacks, allowing you to react effectively.

Observability for Cyber Resiliency – the AI advantage

As discussed earlier in this article, hackers can exist in your system undetected for months at a time. One of the aspects of the NIST Cyber Security Framework’s ‘detect’ pillar is to “establish baseline behaviors for users, data, devices, and applications.” This is because, in order to identify nefarious activity, you need to know what normal looks like.

The problem with a loosely coupled multi-component microservices architecture is that there are a huge number of parts, devices (in the case of IoT), applications, platforms, users, and networks that are all generating data. Manually, it would be nearly impossible to compile this data and establish a baseline intelligent enough to deal with various fluctuations.

Coralogix and AI as-a-Service

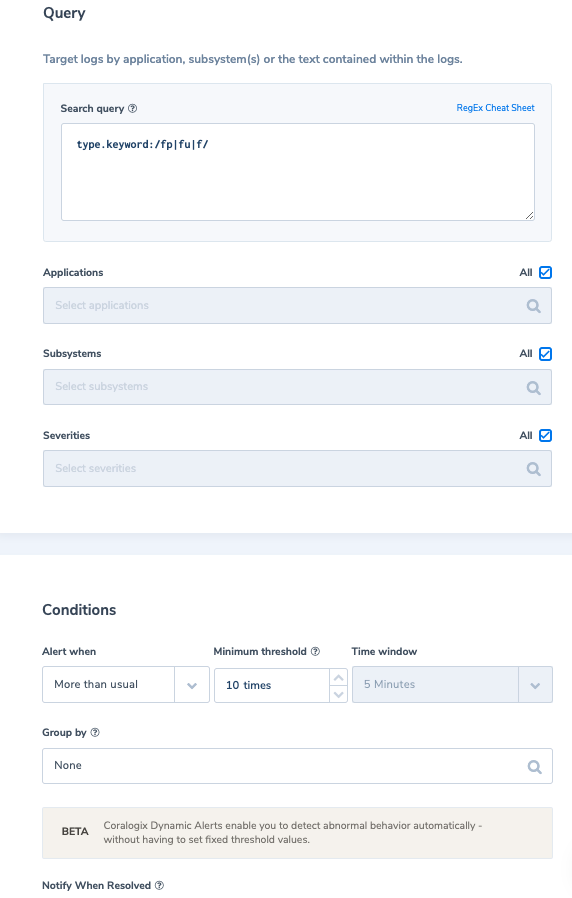
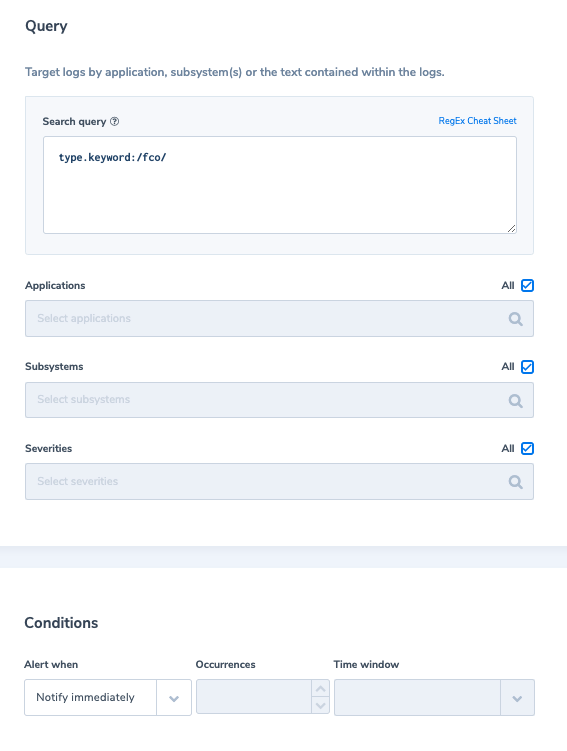
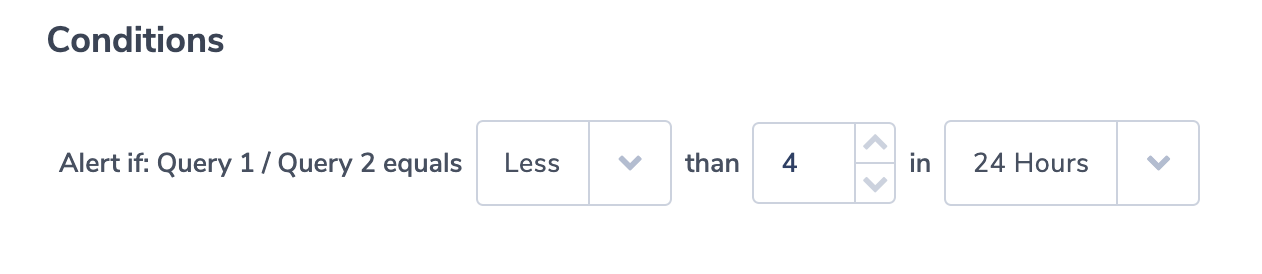
As part of the Coralogix platform, you can benefit from state-of-the-art AI tooling to help with anomaly detection in monitoring data. Error Volume Detection creates a baseline of all errors and bad API responses across all components in a system and correlates those metrics in relation to time. 

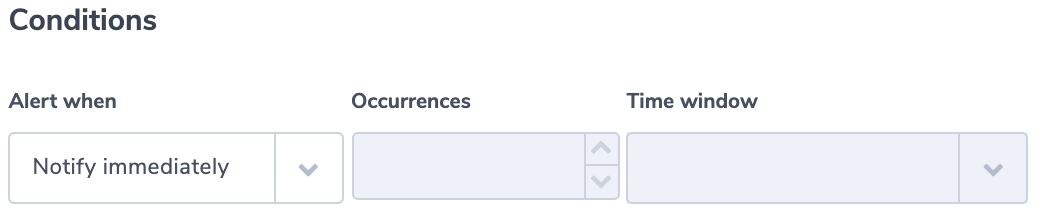
Flow Anomaly analyzes the typical flow of logs as they are returned and alerts the user if that ratio or pattern is broken. Again, this AI-powered insight tool creates an intelligent and flexible baseline automatically, ensuring that if things are amiss you’re alerted immediately. 

Both of these tools, inherent in Coralogix, give you AI-powered insights into what is normal in even the most complex of systems. This level of baselining is critical for cyber resiliency and harnesses all of the benefits of observability to get you there.

Summary

In this article, we’ve talked about how you need to handle monitoring data (in particular logs) to be more cyber resilient. Logs are going to be your best friend when you’re hunting for an attacker or diagnosing a security breach. That’s why they should be handled with the same care and caution as production data (although they rarely are). Organizations that identify cyber-attacks in under 30 days save on average $1 million, and it’s your logs (stored unfettered) that are going to propel you toward that outcome.

We’ve also looked at how you can harness monitoring data to empower your organization’s cyber resiliency. By monitoring everything, not just firewalls and security components, then you can get a real insight into when things might be awry in your system. This is one of the fundamental principles of observability. 

Observability, when done right, gives you the ability to analyze disparate components and their performance within your system. This is invaluable for cyber resiliency, such as in the instance of a DDoS attack.

Additionally, observability platforms like Coralogix have built-in AI technology that baselines your system’s “normal” and highlights when something deviates from the norm. Manual approaches simply cannot carry out that level of analysis or detection on so many sources of data, especially not in real-time.

Elevate Your Event Data With Custom Data Enrichment in Coralogix

Have you ever found yourself late at night combing through a myriad of logs attempting to determine why your cluster went down? Yes, that’s a really stressful job, especially when you think about how much money your company loses as a result of these incidents. Gartner estimates that the revenue lost due to outages is around $5,600/minute, which amounts to more than $330K/hour.

To make matters worse, your boss is breathing down your neck asking for updates, and the logs you are working with look something like this:

non-enriched log event
Not very helpful, huh?

Please, do not despair!  Coralogix Custom Data Enrichment to the rescue!

Using our Custom Data Enrichment feature, you can create one or more “translation” tables that add translated (e.g. enriched) fields to your logs. This allows you to unscramble any obscure data in the fields.

In this example, I created two very simple Custom Enrichments, which would translate the data from the following 2 log fields:

  1. hw-status
  2. errorcode

Please note that the above fields are case-sensitive. I have oversimplified my example to illustrate the essence of our Custom Data Enrichment feature, but in practice, your enrichment .csv files would contain more than one line (up to 10,000 rows, or approximately 0.5 MB of standard information).

Here is the content of the two Custom Data Enrichment .csv files I used for this example:

1. errorcode.csv:

errorcode,translation
%$^&*(#@!!!!!,Pepe unplugged it!

2. hwstatus.csv:

hwstatus,hwstatus-translated
^00^:(,The Power is off

Please note that the header lines in the .csv files are just placeholders (to remind you what kind of data the file contains) and are not referenced during the Custom Enrichment creation. What is important here to keep in mind is that the value to be enriched is the first one in each line, before the second comma-separated value.

Following are the two Custom Enrichments I created for this example:

coralogix enrichment file examples


Please note how the “hw-status”, and “errorcode” fields have been selected.

After creating the Custom Data Enrichment, and sending logs that would match the defined fields in the Enrichments, you will notice new fields added to your logs which are named using the original field’s name, with “_enriched” appended to it. Please take a look at what our example looks like after the Enrichment:

enriched log event coralogix

Isn’t that great? No more guessing what those values are…

We have gathered several .csv Enrichment files that have been used internally, and by our customers, and we are sharing them with you so you could use them to create your own enrichments. 

They are available for download here:

[table id=86 /]

Let us know please about any other Custom Enrichments that may be useful and relevant to your environment. If you would like to contribute to our users’ repository with any .csv files that could be used to create new Custom log Enrichments, please send them our way:
support@coralogixstg.wpengine.com

The users’ repository will be updated as new .csv files are uploaded. Please check this page frequently. 

We would also love to hear about your experience using the .csv enrichment files, as well as receiving any feedback you may have for us.

For more information about our Custom Data Enrichment feature, check out the complete tutorial here.

Announcing our $55M Series C Round Funding to further our storage-less data vision

It’s been an exciting year here at Coralogix. We welcomed our 2,000th customer (more than doubling our customer base) and almost tripled our revenue. We also announced our Series B Funding and started to scale our R&D teams and go-to-market strategy.

Most exciting, though, was last September when we launched Streamaⓒ – our stateful streaming analytics pipeline.

And the excitement continues! We just raised $55 million for our Series C Funding to support the expansion of our stateful streaming analytics platform and further our storage-less vision.

Streamaⓒ technology

Streamaⓒ technology allows us to analyze your logs, metrics, and security traffic in real-time and provide long-term trend analysis without storing any of the data. 

The initial idea behind Streamaⓒ was to support our TCO Optimizer feature which enables our customers to define how the data is routed and stored according to use case and importance.

“We started with 3 very big international clients spending half a million dollars a year for our service, and we reduced that to less than $200,000. So, we created massive savings, and that allowed them to scale,” CEO Ariel Assaraf explains. “Because they already had that budget, they could stop thinking about whether or not to connect new data. They just pour in a lot more data and get better observability.”

Then we saw that the potential of Streama goes far beyond simply reducing costs. We are addressing all of the major challenges brought by the explosive growth of data. When costs are reduced, scale and coverage are more attainable. Plus, Streamaⓒ is only dependent on CPU and automatically scales up and down to match your requirements so we can deliver top-tier performance in the most demanding environments.

What’s next for Coralogix

Moving forward, our goal is to advance our storage-less vision and use Streamaⓒ as the foundation for what we call the data-less data platform.

There are two sides to this vision. On the one hand, we have our analytics pipeline which is providing all of the real-time and long-term insights that you need to monitor your applications and systems without storing the data. On the other hand, we’re providing power query capabilities for archived data that hasn’t ever been indexed.  

So, imagine a world where you can send all of your data for analysis without thinking about quotas, without thinking about retention, without thinking about throttling. Get best-in-class analytics with long-term trends and be able to query all the data from your own storage, without any issues of privacy or compliance.

With this new round of funding, we’re planning to aggressively scale our R&D teams and expand our platform to support the future of data.

Thank you to our investors!

We’re proud to partner with Greenfield Partners, who led this round, along with support from our existing investors at Red Dot Capital Partners, StageOne Ventures, Eyal Ofer’s – O.G. Tech, Janvest Capital Partners, Maor ventures, and 2B Angels.

We have a lot of ambitious goals that we expect to meet in the next few quarters, and this funding will help us get there even faster.

Learn more about Coralogix: https://coralogixstg.wpengine.com/

Using Coralogix + StackPulse to Automatically Enrich Alerts and Manage Incidents

Keeping digital services reliable is more important than ever.  When something goes wrong in production, on-call teams face significant pressure to identify and resolve the incident quickly – in order to keep customers happy.  But it can be difficult to get the right signals to the right person in a timely fashion.  Most teams use a combination of observability platforms (like Coralogix) to identify and alert on signals, and then some type of paging or routing system that passes these alerts onward.  

Being able to automate this process – so the first time an on-call responder sees an alert, they have all the necessary information to triage the severity of the incident and understand the root cause – saves significant time, helping teams restore services faster and keep customers satisfied.

In this post, we’ll cover how StackPulse and Coralogix can be used together to automatically enrich alerts for faster and better incident management.

What is StackPulse?

StackPulse is an integration first platform — it easily connects to all the systems you are using today to ingest data. As data is sent to the platform, it’s automatically enriched using the characteristics of the event and by pulling more information from other integrations (eg. reaching out to a Kubernetes cluster or using a cloud service provider’s API). StackPulse can also bundle this information and deliver it to the communications platforms that your teams are already using.

One core capability of StackPulse is the ability to take an alert and enrich it before an operator starts their process of responding to the event. This helps to minimize alert fatigue, as this real-time context and information reduces time invested in triaging, analyzing, and responding to events. With StackPulse you can create automated, code-based playbooks to investigate and remediate events across your infrastructure.

StackPulse Playbooks are built from reusable artifacts called Steps. StackPulse allows you to easily build and link steps together to perform actions that interface with multiple systems, as we’ll do with this example. We’ll cover this in more detail later on, as this adds a lot of power to the integration between Coralogix and StackPulse.

Using StackPulse and Coralogix to Enrich and Alert on Data

StackPulse can communicate bi-directionally with Coralogix, an observability platform that analyzes and prioritizes data before it’s indexed and stored. This ability allows for teams to more effectively and efficiently respond to incidents as the time needed for manual investigations and setting up alerts is eliminated almost entirely.

In this example, we’ll spotlight how StackPulse ingests alerts from Coralogix, reacts to an event, and goes on to gather additional context-specific information from the Coralogix platform and a Kubernetes cluster. The enrichment of the initial event is done automatically, without any manual steps — based on the context of the alert.

Along the way, we’ll cover different components of the scenario in detail. In this example, Coralogix is receiving logs from an application — a Sock Shop microservices demo running on a Google Kubernetes Engine cluster.

Coralogix is configured to monitor the health of the application and sends dynamic alerts powered by machine learning to StackPulse via a webhook configuration when critical application or cluster errors are found. We also have a Slack workspace setup with the StackPulse app installed and configured. 

StackPulse will ingest the alerts and use the information in the alert payload to provide context for a StackPulse Playbook to perform the alert enrichment and remediation actions.  

Incidence Response for Kubernetes Log Error

Our example begins when an alert is generated in the Coralogix platform after an error is identified in the Kubernetes logs.

kubernetes log error

When this happens, the Coralogix platform sends the event to a configured integration in StackPulse. The first view of this data in StackPulse is in the Journal, which is a federated view of all events passing into the StackPulse Platform.

journal stackpulse platform

If we click on the event in the Journal we can see the raw payload coming from Coralogix.

coralogix sock shop

Using the payload from the event, we can build a Trigger based on a set of conditions that will initiate a Playbook. To configure the Trigger, we can use the StackPulse interface to view the payload of the event in the Playbook Planner and easily select the conditions within the payload.

stackpulse trigger settings

Here we can see the Trigger’s definition in YAML. The nice thing here is that you don’t have to type any of that out, it’s all built from clicks within the GUI. If you’ve worked with Kubernetes before, this will look similar to a custom resource definition.

For this Trigger, we’re looking first for an event coming in from Coralogix_SockShop. Next, we’re looking for three values within the event payload — the Alert Action is trigger, the Application is sock-shop and the Alert Severity is critical. When all of these conditions are met, this would cause a Playbook to run.

stackpulse trigger definition

Now that we have the Trigger defined, we can build out the Playbook itself. This Playbook will run when a payload is received from Coralogix matching the conditions in the Trigger above, and it will have a few steps:

  1. Communicate with the Kubernetes cluster to gather statistics and events
  2. Combine that information with the original alert from Coralogix, sending it to slack
  3. Ask the Slack channel if they would like to escalate to the on-call engineer. If so, it will create an incident in PagerDuty

We can use the StackPulse Playbook Planner to build out each individual step. Using the library of prebuilt steps, you can simply drag and drop from the planner to your Playbook.

stackpulse prebuilt rules

These first steps gather information from Kubernetes, posting that to Slack along with the original Coralogix alert. Here’s what that looks like:

coralogix alert in stackpulse
new alert from stackpulse
stackpulse alert kubernetes logs

After we provide the alert enrichment to Slack, StackPulse will ask the channel if they’d like to page the on-call person. If a teammate selects Yes, a PagerDuty incident will be created to alert the on-call person.

stackpulse alert on call slack

Here’s the complete picture of the output and interaction within Slack. 

stackpulse coralogix slack alerts
stackpulse coralogix slack alert on call

As you can see, StackPulse automatically enriched the alert with relevant information from the cluster. This means the operator responding to the alert has all the context needed to evaluate the health of the cluster without having to perform any manual actions.

Summary

There you have it! Hopefully this post provides you with some clarity on how easy it is to use the StackPulse and Coralogix integration to ingest alerts and automatically react to events using context-specific information. 

StackPulse offers a complete, well-integrated solution for managing reliability — including automated alert triggers, playbooks, and documentation helpers. Ready to try? Start a free trial with Coralogix or with StackPulse to see what we have to offer.

How to Address the Most Common Microservice Observability Issues

Breaking down larger, monolithic software, services, and applications into microservices have become a standard practice for developers. While this solves many issues, it also creates new ones. Architectures composed of microservices create their own unique challenges. 

In this article, we are going to break down some of the most common. More specifically, we are going to assess how observability-based solutions can overcome many of these obstacles.

Observability vs Monitoring

We don’t need to tell you that monitoring when working with microservices is crucial. This is obvious. Monitoring in any area of IT is the cornerstone of maintaining a healthy, usable system, software, or service.

A common misconception is that observability and monitoring are interchangeable terms. The difference is that while monitoring gives you a great picture of the health of your system, observability takes these findings and provides data with practical applications.

Observability is where monitoring inevitably leads. A good monitoring practice will provide answers to your questions. Observability enables you to know what to ask next.

No App Is An Island

In a microservices architecture, developers can tweak and tinker with individual apps without worrying about this leading to the need for a full redeploy. However, the larger the microservice architecture gets the more issues this creates. When you have dozens of apps, worked on by as many developers, you end up running a service that relies on a multitude of different tools and coding languages.

A microservice architecture cannot function if the individual apps lack the ability to communicate effectively. For an app in the architecture to do its job, it will need to request data from other apps. It relies on smooth service-to-service interaction. This interaction can become a real hurdle when each app in the architecture was built with differing tools and code.

In a microservice-based architecture you can have thousands of components communicating with each-other. Observability tools give developers, engineers, and architects, the power to observe the way these services interact. This can be during specific phases of development or usage, or across the whole project lifecycle.

Of course, it is entirely possible to program communication logic into each app individually. With large architectures though this can be a nightmare. It is when microservice architectures reach significant size and complexity that our first observability solution comes into play- a service mesh.

Service Mesh

A service mesh works inter-service communication into the infrastructure of your microservice architecture. It does this using a concept familiar to anybody with knowledge of networks- proxies.

What does a service mesh look like in your cluster?

Your service mesh takes form as an array of proxies within the architecture, commonly referred to as sidecars. Why? Because they run alongside each service instead of within them. Simple!

Rather than communicate directly, apps in your architecture relay information and data to their sidecar. The sidecar will then pass this to other sidecars, communicating using a common logic embedded into the architecture’s infrastructure.

What does it do for you?

Without a service mesh, every app in your architecture needs to have communication logic coded in manually. Service meshes remove (or at least severely diminish) the need for this. Also, a service mesh makes it a lot easier to diagnose communication errors. Instead of scouring through every service in your architecture to find which app contains the failed communication logic, you instead only have to find the weak point in your proxy mesh network.

A single thing to configure

Implementing new policies is also simplified. Once out there in the mesh, new policies can be applied throughout the architecture. This goes a long way to safeguarding yourself from scattergun changes to your apps throwing the wider system into disarray.

Commonly used service meshes include Istio, Linkerd, and Consul. Using any of these will minimize downtime (by diverting requests away from failed services), provide useful performance metrics for optimizing communication, and allow developers to keep their eye on adding value without getting bogged down in connecting services.

The Three Pillars Of Observability

It is generally accepted that there are three important pillars needed in any decent observability solution. These are metrics, logging, and traceability. 

By adhering to these pillars, observability solutions can give you a clear picture of an individual app in an architecture or the infrastructure of the architecture itself.

An important note is that this generates a lot of data. Harvesting and administrating this data is time-consuming if done manually. If this process isn’t automated it can become a bottleneck in the development or project lifecycle. The last thing anybody wants is a solution that creates more problems than it solves.

Fortunately, automation and Artificial Intelligence are saving thousands of man hours every day for developers, engineers, and anybody working in or with IT. Microservices are no exception to this revolution, so there are of course plenty of tools available to ensure tedious data wrangling doesn’t become part of your day-to-day life.

Software Intelligence Platforms

Having a single agent provide a real-time topology of your microservice architecture has no end of benefits. Using a host of built-in tools, a Software Intelligence Platform can easily become the foundation of the smooth delivery of any project utilizing a large/complex microservice architecture. These platforms are designed to automate as much of the observation and analysis process as possible, making everything from initial development to scaling much less stressful.

A great software intelligence platform can:

  • Automatically detect components and dependencies.
  • Understand which component behaviors are intended and which aren’t wanted.
  • Identify failures and their root cause.

Tracking Requests In Complex Environments

Since the first days of software engineering and development, traceability of data has been vital. 

Even in monolith architectures keeping track of the origin points of data, documentation, or code can be a nightmare. In a complex microservice environment composed of potentially hundreds of apps it can feel impossible.

This is one of the few areas in which a monolith has an operational advantage. When literally every bundle of code is compiled in a single artifact, troubleshooting or request tracking through the lifecycle is more straightforward. Everything is in the same place.

In an environment as complex and multidimensional as a microservices architecture, documentation and code bounces from container to container. Requests travel through a labyrinth of apps. Keeping tabs on all this migration is vital if you don’t want debugging and troubleshooting to be the bulk of your workload.

Thankfully, there are plenty of tools available (many of which are open source) to ensure tracking requests through the entire life-cycle is a breeze.

Jaeger and Zipkin- Traceability For Microservices

When developing microservices it’s likely you’ll be using a stack containing some DevOps tooling. By 2020 it is safe to assume that most projects will at least be utilizing containerization of some description. 

Containers and microservices are often spoken of in the same context. There is a good reason for this. Many of the open source traceability tools developed for one also had the other very much in mind. The question of which best suits your needs largely depends on your containerization stack. 

If you are leaning into Kubernetes, then Jaeger will be the most functionally compatible. In terms of what it does, Jaeger has features like distributed transaction monitoring and root cause analysis that can be deployed across your entire system. It can scale with your environment and avoids single points of failure by way of supporting a wide variety of storage back ends.

If you’re more Docker-centric, then Zipkin is going to be much easier to deploy. This ease of use is aided by the fact that Zipkin runs as a single process. There are several other differences, but functionally Zipkin fills a similar need to Jaeger. They both allow you to track requests, data, and documentation across an entire life-cycle in a containerized, microservices architecture.

Logging Frameworks

The importance of logging cannot be overstated. If you don’t have effective systems for logging errors, changes, and requests, you are asking for nothing short of chaos and anarchy. As you can imagine, in a microservices architecture potentially containing hundreds of apps from which bugs and crashes can originate a decent logging solution is a high priority.

To have effective logging observability within a microservices architecture requires a standardized, system-wide approach to logging. Logging frameworks are a great way to do this. Logging is so fundamental that some of the earliest open source tools available were logging frameworks. There’s plenty to choose from, and they all have long histories and solid communities for support and updates by this point.

The tool you need really boils down to your individual requirements and the language/framework you’re developing in. If you’re logging in .Net then something like Nlog, log4net, or Serilog will suit. For Java your choice may be between log4j or logback. There are logging frameworks targeting most programming languages. Regardless of your stack, there’ll be something available. 

Centralizing Log Storage

Now that your apps have a framework in place to log deployments, requests, and everything else, you need somewhere to keep them until you need them. Usually, this is when something has gone wrong. The last thing you want to be doing on the more stressful days is wading through a few dozen apps-worth of log data.

Like almost every problem on this list, the reason observability is necessary for your logging process is due to the complexity of microservices. In a monolith architecture, logs will be pushed from a few sources at most. In a microservice architecture, potentially hundreds of individual apps are generating log data every second. You need to know not just what’s happened, but where it happened amongst the maze of inter-service noise.

Rather than go through the incredibly time-consuming task of building a stack to monitor all of this, my recommendation is to deploy a log management and analysis tool like Coralogix to provide a centralized location to monitor and analyze relevant log data from across the entirety of your architecture.

When errors arise or services fail, any of the dozens of options available will quickly inform you both the nature of the problem and the source. Log management tools hold your data in a single location. No more will you have to travel app to app searching for the minor syntax error which brought down your entire system.

In Short

There are limitless possibilities available for implementing a decent observability strategy when you’re working with microservices. We haven’t even touched upon many cloud-focused solutions, for example, or delved into the realms of web or mobile app-specific tools.

If you’re looking for the short answer of how to go about overcoming microservices issues caused by poor observability, it’s this: find a solution that allows you to track relevant metrics in organized logs so everything is easily traceable.

Of course, this is highly oversimplified, but if you’re looking purely for a nudge in the right direction the above won’t steer you wrong. With so many considerations and solutions available, it can feel overwhelming when weighing up your options. As long as you remember what you set out to do, the journey from requirement to deployment doesn’t have to be an arduous one.

Microservices architectures are highly complex at a topological level. Always keep that in mind when considering your observability solutions. The goal is to enable a valuable analysis of your data by overcoming this innate complexity of microservices. That is what good observability practice brings to the table.

The Secret Ingredient That Converts Metrics Into Insights

Metrics and Insight have been the obsession of every sector for decades now. Using data to drive growth has been a staple of boardroom meetings the world over. The promise of a data-driven approach has captured our imaginations.

What’s also a subject of these meetings, however, is why investment in data analysis hasn’t yielded results. Directors give the go ahead to sink thousands of dollars into observability and analytics solutions, with no returns. Yet all they see on the news and their LinkedIn feeds is competitors making millions, maybe even billions, by placing Analytics and Insight at the top of their agenda.

These directors and business leaders are confused. They have teams of data scientists and business analysts working with the most cutting edge tools on the market. Have those end of year figures moved though? Has performance improved more than a hard fought one, maybe two percent?

All metrics, no insights

The problem lies in those two words- Metrics and Insight.

More specifically, the problem is that most businesses love to dive into the metrics part. What they don’t realize is that without the ‘Insight’ half of the equation, all data analysis provides is endless logs of numbers and graphs. In a word, noise.

Sound familiar? Pumping your time, energy, and finance into the metrics part of your process will yield diminishing returns very quickly if that’s all you’re doing. If you want to dig yourself out of the ‘we just need more data’ trap, maybe you should switch your focus to the insights?

Data alone won’t solve this problem. To gain insight, what you need is something new. Context.

Why you NEED context

Metrics and Insight is business slang for keeping an extra close eye on things. Whether you’re using that log stack for financial data or monitoring a system or network, the fundamentals are the same. The How can be incredibly complex, but the What is straight forward. You’re using tech as a microscope for a hyper-focused view.

Without proper context it is impossible to gain any insight. Be it a warning about continued RAM spikes from your system monitoring log, or your e-commerce dashboard flagging a drop in sales of your flagship product, nothing actionable can be salvaged from the data alone.

If your metrics tell you that your CPU is spiking, you remain entirely unaware of why this is happening or what is going on. When you combine that spike in CPU with application logs indicating thread locking due to database timeouts, you suddenly have context. CPU spikes are good for getting you out of bed, but your logs are where you will find why you’re out of bed.

But how do you get context?

Context – Creating insight from metrics

With platforms like Coralogix, the endless sea of data noise can be condensed and transformed into understandable results, recommendations, and solutions. With a single platform, the results of your Analysis & Insight investments can yield nothing but actionable observations. Through collecting logs based on predetermined criteria, and delivering messages and alerts for the changes that impact your goals, Coralogix makes every minute you spend with your data cost effective. The platform provides context.

Platforms like Coralogix create context from the noise, filtering out what’s relevant to provide you with a clear picture of your data landscape. From context comes clarity, and from clarity comes insight, strategy, and growth.

Onelogin Log Insights with Coralogix

OneLogin is one of the top leading Unified Access Management platforms, enabling organizations to manage and Access their cloud applications in a secure way. OneLogin makes it simpler and safer for organizations to access the apps and data they need anytime, everywhere. This post will show you how Coralogix can provide analytics and insights for your OneLogin log data – including performance and security insights.

OneLogin Logs

OneLogin generates system events related to the authentication activity of your users and any actions made by them. The data provides an audit trail that helps you understand activities within your platforms. Each log event object describes a single logged action or “event” performed by a certain actor for a certain target and its result.

You can leverage this event data by using Coralogix alerts and dashboards to instantly detect problems and their root causes, spot malicious behavior, and get real-time notifications on any event you can define. Ultimately, this offers a better monitoring experience and more value out of your Auth0 data with minimal effort.

To connect your OneLogin logs with Coralogix you will first need to send your OneLogin events to Amazon EventBridge and route them to AWS CloudtTail and then, send them from CloudTrail to Coralogix with our predefined Lambda function.

OneLogin Dashboards

Here are a few examples of Kibana dashboards we created, using the OneLogin log data, Coralogix IP address GEO enrichment, and Elastic queries.

  • Overview
  • Security
  • App Monitoring

You may create additional visualizations and dashboards of your own, using your OneLogin logs.

  • Overview

  • Security

  • App Monitoring

OneLogin Alerts

Coralogix User-defined alerts enable you to easily create any alert you have in mind, using complex queries and various conditions heuristics, thus being more proactive with your OneLogin logs and notified in real-time when issues arise. Here are some examples of alerts we created using traditional OneLogin log data.

1. More than usual login failure per event type

Alert Filter: detail.event_type_id.numeric:(6 OR 9 OR 77 OR 154 OR 901 OR 905 OR 906)

Alert Condition: ‘More than usual times, within 5 min with a minimum of 10 occurrences’, grouped by detail.event_type_id.

2. App user limit reach

Alert Filter: detail.event_type_id.numeric:20

Alert Condition: ‘Notify immediately’

3. Successful login from an unfamiliar country

Alert Filter: detail.event_type_id.numeric:(5 OR 8 OR 78 OR 153 OR 900 OR 904) NOT detail.ipaddr_geoip.country_name:(israel OR ireland OR “united states”)

Alert Condition: ‘Notify immediately’

4. Unauthorized API event

Alert Filter: detail.event_type_id.numeric:401

Alert Condition: ‘Notify immediately’

5. More than 50 API lock user event in 10 min

Alert Filter: detail.event_type_id.numeric:531

Alert Condition: ‘More than 50 times, within 10 min’

Need More Help with Auth0 or any other log data? Click on the chat icon on the bottom right corner for quick advice from our logging experts.

Unleash your Auth0 Log Insights With Coralogix

Auth0 is one of the top leading identity management platforms in the world. It’s focused on providing solutions for application builders, specifically solutions needed for custom-built applications. Auth0 provides expertise to scale and protect identities in any application, for any audience. This post will show you how Coralogix can provide log monitoring, analytics and insights for your Auth0 log data – including performance and security insights.

Auth0 Logs

Auth0 generates system events related to the authentication activity of your users. The data provides an audit trail that helps you understand activities within your platforms. Each log event object describes a single logged action or “event” performed by a certain actor for a certain target and its result.

You can leverage this event data by using Coralogix alerts and dashboards to instantly detect problems and their root causes, spot malicious behavior, and get real-time notifications on any event you can define. Ultimately, this offers a better monitoring experience and more value out of your Auth0 data with minimal effort.

To connect your Auth0 logs with Coralogix you will first need to send your Auth0 events to Amazon EventBridge and route them to AWS CloudWatch and then, send them from CloudWatch to Coralogix with our predefined Lambda function.

Auth0 Dashboards

Here are a few examples of Kibana dashboards we created, using the Auth0 log data, Coralogix IP address GEO enrichment, and Elastic queries.

  • Overview
  • Connections and Clients

You may create additional visualizations and dashboards of your own, using your Auth0 logs. For more information on using Kibana, please visit our tutorial.

  • Overview

  • Connections and Clients

Auth0 Alerts

Coralogix User-defined alerts enable you to easily create any alert you have in mind, using complex queries and various conditions heuristics, thus being more proactive with your Auth0 logs with insights you couldn’t gain or anticipate from a traditional log investigation. Here are some examples of alerts we created using traditional Auth0 log data.

1. More Than Usual Login Failures

Alert Filter: type.keyword:/fp|fu|f/

Alert Condition: ‘More than usual times, within 5 min with a minimum of 10 occurrences’.

2. Failed by CORS

Alert immediately if an application request Origin is not in the Allowed Origins list for the specified application.

Alert Filter: type.keyword:/fco/

Alert Condition: ‘Notify immediately’

3. Successful login from an unfamiliar country

Alert Filter: type.keyword:/s/ NOT ip_geoip.country_name:(israel OR ireland OR “united states”)

Alert Condition: ‘Notify immediately’

4. Breached password

Someone behind the IP address: IP attempted to log in with a leaked password.

Alert Filter: type.keyword:/pwd_leak/

Alert Condition: ‘Notify immediately’

5. Blocked Account

An IP address is blocked with 10 failed login attempts into a single account from the same IP address.

Alert Filter: type.keyword:/limit_wc/

Alert Condition: ‘Notify immediately’

6. Blocked IP Address

An IP address is blocked with 100 failed login attempts using different usernames, all with incorrect passwords in 24 hours, or 50 sign-up attempts per minute from the same IP address.

Alert Filter: type.keyword:/limit_mu/

Alert Condition: ‘Notify immediately’

Need More Help with Auth0 or any other log data? Click on the chat icon on the bottom right corner for quick advice from our logging experts.

Protect Your AWS Infrastructure with GuardDuty and Coralogix

What is GuardDuty

Cloud environments like AWS monitoring can be a challenge for security monitoring services to operate in since assets tend to dynamically appear and disappear. Making matters more challenging, some asset identifiers that are stable in traditional IT environments like IP addresses are less reliable due to their transient behavior in a cloud service like AWS. Amazon GuardDuty protects your AWS environment with intelligent threat detection and continuous monitoring.

GuardDuty is a continuous security AWS monitoring service that analyzes log data from sources like VPC Flow Logs, AWS CloudTrail event logs, Route 53, and DNS logs. It uses threat intelligence feeds, such as lists of malicious domains and IP addresses together with machine learning to identify unexpected and potentially malicious activity. 

Malicious activity can include unusual API calls, unauthorized deployments that can indicate that an account was compromised, reconnaissance by attackers, issues like escalations of privileges, exposed credentials, or communication with malicious IP addresses, URLs, or domains.

How to connect GuardDuty to Coralogix

GuardDuty can be configured to send logs to S3 and Cloudwatch which can ship the logs to Coralogix via our Cloudwattch and S3 integrations.

GuardDuty log format

When GuardDuty detects suspicious or malicious activity in your account it generates a finding. A Finding can be viewed in the GuardDuty console, but it can also be sent as a log. 

Guard duty finding format:

ThreatPurpose:ResourceTypeAffected/ThreatFamilyName.ThreatFamilyVariant!Artifact

The threat purpose is at the highest level and describes the primary purpose of a threat or a potential attack. It includes descriptions like: 

  • Trojan
  • Backdoor
  • Behavior
  • Policy 
  • Recon
  • and others

ResourceTypeAffected describes which AWS resource is the potential target of an attack. Currently, EC2 instances, credentials, and resources can be identified.

ThreatFamilyName describes the overall threat or potentially malicious activity that GuardDuty is detecting.

ThreatFamilyVariant describes the specific variant of the ThreatFamily that GuardDuty is detecting. Attackers often slightly modify the functionality of the attack, thus creating new variants.

Artifact describes a specific resource that is owned by a tool that is used in the attack.

Examples

‘Backdoor:EC2/C&CActivity.B!DNS’ Is interpreted as: A suspected Backdoor attack was identified. An EC2 instance is targeted. It was identified to query a domain name associated with a Command and Control server. Command and Control servers issue commands to members of a botnet.

‘CryptoCurrency:EC2/BitcoinTool.B!DNS’ is interpreted as an EC2 instance is querying a domain name that is associated with the cryptocurrency-related activity. Unless you use this EC2 instance to mine or manage cryptocurrency or your EC2 instance is involved in blockchain activity, your EC2 instance might be compromised.

The log field that holds the type is ‘detail.type’. In the following example, we used Coralogix rules with a regex to extract the different finding’s format components into the fields:

‘threat_purpose’

‘threat_resorce_affected

‘Threat_name’ (combined family name and family variant)

‘threat_artifact

Each log includes the finding’s severity in the field ‘. This is a number between 0 and 10 (Values 0 and 9.0 to 10.0 are currently reserved for future use).

High severity is defined as between severity 6.9 to 9 

Medium severity is defined as between severity 3.9 to 7

Low severity is defined as between severity 0 and 4

Another interesting field is ‘detail.resource.instanceDetails.service.resourrceRole’. Its optional values are “TARGET” or “ACTOR” and represent whether your resource was the target of the suspicious activity or the actor that performed the suspicious activity respectively.

The log has many other fields that describe the findings as well as the resources involved. Here is an example log:

{

 "version": "0", 

 "id": "xxxxx-xx", 

 "detail-type": "GuardDuty Finding", 

 "source": "aws.guardduty", 

 "account":"1234567890", 

 "time": "2018-02-28T20:25:00Z", 

 "region":"us-west-2", 

 "resources": [], 

 "detail": {

      "schemaVersion":"2.0", 

      "accountId": "1234567890", 

      "region": "us-west-2",

      "partition": "aws", 

      "id": "xxxxxxxx", 

      "arn": "arn:aws:guardduty:us-west-2:1234567890:detector/XXXXXXX/finding/xxxxxxx", 

      "type": "Trojan:EC2/PhishingDomainRequest!DNS",

      "resource": {

                     "resourceType": "Instance", 

                     "instanceDetails":{

                                      "instanceId": "i-99999999", 

                                      "instanceType": "m3.xlarge", 

                                      "launchTime": "2016-08-02T02:05:06Z", 

                                      "productCodes": [{

                                                  "productCodeId":   "GeneratedFindingproductCodeId", 

                                                  "productCodeType": "GeneratedFindingProductCodeType"

                                                  }],

                                      "iamInstanceProfile": {

                                                  "arn": "GeneratedFindingInstanceProfileArn", 

                                                  "id": "GeneratedFindingInstanceProfileId"

                                                 }, 

                                       "networkInterfaces": [{

                                                  "ipv6Addresses": [], 

                                                  "privateDnsName": "GeneratedFindingPrivateDnsName", 

                                                  "privateIpAddress":"127.0.0.1", 

                                                  "privateIpAddresses": [{

                                                             "privateDnsName": "GeneratedFindingPrivateName", 

                                                             "privateIpAddress":"127.0.0.1"

                                                          }],

                                       "subnetId": "GeneratedFindingSubnetId", 

                                       "vpcId": "ein-ffdd1234", 

                                       "securityGroups": [{

                                                 "groupName": "SecurityGroup01", 

                                                 "groupId": "GeneratedFindingSecurityId"

                                                 }], 

                                       "publicDnsName":"bbb.com", 

                                       "publicIp": "127.0.0.1"

                                       "tags": [{

                                         "key": "GeneratedFindingInstaceTag1", 

                                         "value":"GeneratedFindingInstaceValue1"

                                       },

                                       {

                                         "key":"ami-99999999", 

                                         "imageDescription": "GeneratedFindingInstaceImageDescription"

                                       }], 

                                       "service": {

                                       "serviceName": "guardduty", 

                                       "detectorId": "xxxxxx",

                                       "action": {

                                          "actionType": "DNS_REQUEST", 

                                          "dnsRequestAction":{

                                              "domain": "GeneratedFindingDomainName", 

                                              "protocol": "UDP", 

                                              "blocked": true

                                           }

                                       }, 

                                       "resourceRole": "TARGET", 

                                       "additionalInfo": {

                                          "threatListName": "GeneratedFindingThreatListName",

                                          "sample": true

                                       }, 

                                       "eventFirstSeen": "2020-06-02T20:22:26.350Z", 

                                       "eventLastSeen": "2020-06-03T20:22:26.350Z", 

                                       "archived": false,

                                       "count": 1.0

                                }, 

                                "severity": 8.0, 

                                "createdAt": "2020-06-02T20:22:26.350Z", 

                                "updatedAt": "2020-06-03T20:22:26.350Z", 

                                "title":"Trojan:EC2/PhishingDomainRequest!DNS", 

                                "description": "Trojan:EC2/PhishingDomainRequest!DNS"

                          }

                  }

         }

}

Coralogix log management solution complements GuardDuty by creating one pane of glass through which DevSecOps, as well as other teams like engineering and CS, can view logs from different accounts and parts of the infrastructure in a consolidated way. 

Coralogix visualizes the data and allows customers to create their visualizations based on their needs. It gives users powerful analysis tools and helps identify correlations between findings and other infrastructure events using ML techniques. 

Coralogix can also put logs in the context of the application’s lifecycle in the CI/CD process – allowing you to assess the impact of every change on your infrastructure. 

In the next section, we’ll provide a few examples of Coralogix alerts and visualizations based on GuardDuty logs. We’ll also include a few examples based on Cloudwatch logs, showing how Coralogix can help protect the integrity of GuardDuty itself.

Alerts

Coralogix comes with an easy-to-use but sophisticated alerts’ engine. Here, we present a diverse set of examples that will highlight different capabilities within the engine. Each alert is defined by a query that identifies the set of logs that will trigger the alert.

And by a condition that defines when the alert should be triggered.

Throughout this section, we’ll provide the query and condition for each example alert.

GuardDuty collection disabled or altered

The following is a Cloudtrail alert and it triggers when the GuardDuty findings collection is disabled or altered. This is an example of how Coralogix can help protect the integrity of GuardDuty itself from attacks or operational errors.

Alert Query is based on Cloudtrail’s log entries:

Alert condition: eventSource:”guardduty.amazonaws.com” AND eventName.keyword:/CreateFilter|DeleteDetector|DelteIPSeet|DeleteMember|DeletePublishingDestination|DisableOrganizationAdminAccount|StopMonitoringMembers|UpdateDetector|UpdateIPSet|UpdatePublishingDestination|UpdateThreatIntelSet)/

Alert Condition is ‘Notify immediately’.

Server bucket access logging changed for GuardDuty buckets

This is another Cloudtraill alert example that will be triggered if an attempt is made to alter access to S3 buckets that collect GuardDuty logs.

Alert Query: eventSource:”s3.amazonaws.com” AND (eventName:PutBucketAcl OR eventName:PutBucketPolicy) AND requestParameters.bucketName:your-bucket-names

Alert Condition ‘Notify immediately’

No GuardDuty logs

This is another GuardDuty integrity alert. This time it is based on GuardDuty logs and uses the ‘less than’ condition in Coralogix alert engine. The alert will be triggered if no GuardDuty logs will arrive in a 10 minutes window.

Alert Query: source:”aws.guardduty”

Alert Condition: ’less than 1’ in 10 minutes. Again the values should be tuned for your specific infrastructure profile.

Phishing attempt identified

Next, we’ll identify a finding that indicates a resource is trying to connect with a Phishing website or trying to set one up.

Alert query: threat_name:phishingdomainrequest 

Alert Condition: ‘Notify immediately’

An “ACTOR” identified

A Resource role, detail.resource.instanceDetails.service.resourceRole, with the value “ACTOR”  indicates that your internal resource was involved in suspicious activity against a remote host. This alert will be triggered if such a finding is sent to Coralogix.

Alert Query: detail.resource.instanceDetails.service.resourceRole:actor

Alert Condition: ‘Notify immediately’

Threat purpose “Backdoor” ratio is too high

This alert uses Coralogix’s ‘Ratio alert’ capability. It will be triggered when the ratio between ‘Backdoor’ findings and all findings is higher than a defined value. Ratio alerts have two queries and the alert triggers based on the ratio between the count of their results.

Alert Query 1: threat_purpose:backdoor

Alert Query 2: source:”aws.guardduty”

The condition, in this case, will be ‘more than 0.1’ in 30 minutes, which means that it will be triggered if the ratio is more than 10% within the time window of 30 minutes. Choose a time window that will be meaningful but long enough to avoid false alerts due to spikes. 

More than usual number of high severity findings

This alert uses Coralogix dynamic alerting capability to learn the behavior of your application and will trigger an alert if the query results deviate from the usual values. In this example, an alert will be triggered if a more than usual amount of high severity findings are detected.

Alert query: source:”aws.guardduty” AND detail.resource.instanceDetails.severity.numeric:(>6.9 AND <=8.9)

We add the source to make sure the alerts will not be triggered by other logs with the same field. Amazon findings with a severity between 7 and 9  are considered high severity.

The condition is ‘More than usual’ and we defined a threshold of 10 which means that the alert will be triggered if the number of high severity findings will be more than usual and more than the threshold.

GuardDuty Visualizations

Visualizations are about trends and about giving users insights across accounts and infrastructure into GuardDuty findings. Here are few examples:

Starting from the top left you can see:

Count of high and medium severity findings

These visualizations use AWS classification of High for severities between 6.9 and 9, Medium for severities between 3.9 and 7 and Low for ones that are between 0 and 4 (severities 0 and 9-10 are kept for future use). 

Types per purpose

This visualization uses the parsed finding and gives the different types of findings per purpose.

High/Medium affected resource distribution

Gives the ratio of each resource associated with findings. We filter by high and medium threats ( between 3.9 and 9).

High/Medium threats by account

This visualization gives the findings by accounts which enable users to get a birds-eye view of which accounts are under attack or maybe already compromised.

High and Medium severity purpose distribution 

These two visualizations use the parsed findings field.

Trend lines

Showing the trends of overall findings and per medium and high severity.

High and Medium severity by region

These visualizations show the findings distributions by region. Similar to distribution by account it gives the big already compromised or under attack. 

High and Medium threats by security group

This visualization uses the security group name field, detail.resource.instanceDetails.networkInterfaces[0].securityGroups[0].groupName (pay attention to the arrays, they are tricky) to find if there is a specific more vulnerable security group.

Putting GuardDuty logs in the context of application lifecycle events

Coralogix has the ability to put logs in the context of application lifecycle events. It integrates with CI/CD pipelines to create version tags for every change and release. Logs can be observed in the context of these tags for greater context. Tags can also be created via API calls or manually. 

Aside from identifying deployments of new features or versions, it can also point to events like significant customers or marketing campaign rollouts that can change usage patterns.

In this example, we see that we had a spike in security events that started around 7:30

A quick look at the logs screen will confirm that an application lifecycle event happened around that time (see the customizable logo on the logs’ flow graph)

The tags dashboard will discover that it took the bad actors about 3 hours to start exploiting new vulnerabilities that were introduced into the application in the last release. Clicking on the alerts that came following the deployment will take us into an insight screen and we see that two of our AWS accounts are already infected with a Phishing DNS request.

Getting Started with Grafana Dashboards using Coralogix

One of the most common dashboards for metric visualization and alerting is, of course, Grafana. In addition to logs, we use metrics to ensure the stability and operational observability of our product. 

This document will describe some basic Grafana operations you can perform with the Coralogix-Grafana integration. We will use a generic Coralogix Grafana dashboard that has statistics and information based on logs. It was built to be portable across accounts. 


Grafana Dashboard Setup

The first step will be to configure Grafana to work with Coralogix. Please follow the steps described in this tutorial.

Download Coralogix-Grafana-Dashboard

Import Dashboard:

  1. Click the plus sign on the left pane in the Grafana window and choose import
  2. Click on “upload .json file” and select the file that you previously downloaded
  3. Choose the data source that you’ve configured
  4. Enjoy your dashboard 🙂


Basic Dashboard Settings

Grafana Time Frame

  1. Change the timeframe easily by clicking on the time button on the upper right corner.
  2. You can select the auto-refresh or any other refresh timeframe using the refresh button on the upper right corner.


Grafana Panels

Panels are the basic visualization building block in Grafana.

Let’s add a new panel to our dashboard:

1. Click the graph button with the plus sign on the upper right corner – A new empty panel should open. 

2. Choose the panel type using the 3 buttons:

  • “Convert to row” – A row is a logical divider within a dashboard that can be used to group panels together. Practically creating a sub dashboard within the main dashboard.
  • “Add a new query” – “Query” is a graph that describes the results of a query. It outlines the log count that the query returns per the time frame. Queries support alerts.
  • “Add a new visualization” – Visualsions allows for a much reacher format, giving the user the option to choose between graph bars, lines. Heat maps etc.

3. Select “Add a new query”. It will open the query settings form and you will be able to make the following selections:

  • choose the data source that you want to query.
  • Write your query in Lucene (Elastic) syntax. 
  • Choose your metric
  • You can adjust the interval to your needs


Grafana Variables

Variables are the filters at the top of the dashboard.

To configure a new variable:

  1. Go to dashboard settings (the gear at the top right)
  2. Choose variables and click new
  3. Give it a name, choose your data source, and set the type to query
  4. Define your filter query. As an example, the following filter query will create a selection list that includes the first 1000 usernames, ordered alphabetically {“find”: “terms”, “field”: “username”, “size”: 1000}
  5. Add the variables’ names to each panel you would like the filter to be applied to. The format is $username (using the example from step 4).


Grafana Dashboard Visualizations

Now, let’s explore the new dashboard visualizations:


  1. Data from the top 10 applications: This panel (of type query) displays the account data flow (count of logs) aggregated by applications. You can change the number of applications that you want to monitor by increasing/decreasing the term size. You can see the panel definition here:

This panel includes an alert that will be triggered if an average of zero logs were sent during the past 5 minutes. To access the alert definition screen click on the bell icon on the panel definition pane. Note that you can’t define an alert when you apply a variable on the panel.

  1. Subsystem sizes vs. time: in this panel (of type query), you can see the sum by size. The sums are grouped by a subsystem, you can see the panel definition here:
  2. Debug, Verbose, Info, Warning, Error, Critical:  In these panels (of type query), you can see the data flow segmented by severity. Coralogix severities are identified by numbers 1-6 designating debug to critical. Here is the panel definition for debug:
  3. Logs:  In this panel (of type visualization), we’ve used the pie chart plugin, it shows all the logs of the selected timeframe grouped by severity. You can use this kind of panel when you want to aggregate your data by a specific field. You can see the panel definition here:
  4. The following 5 panels (of type visualization) are similar to each other regarding definition. They use the stat visualization format and show a number indicating the selected metric within the time frame. Here’s on example of the panel definition screen:
  5. GeoIP: In this panel (of type visualization), we use a world map plugin. Also, we’ve enabled the geo enrichment feature in Coralogix. Here is the panel definition:

Under the “queries” settings choose to group by “Geo Hash Grid”, the field should be from geo_point type.

Under the Visualization, settings select these parameters in “map data options” and add to the field mapping the name of the field that contains the coordinates (the same field you chose to group by). To access visualizations settings click on the graph icon on the left-hand side.


For any further questions on Grafana and how you can utilize it using Coralogix or even if managing your own Elasticseach, feel free to reach out via chat. We’re always available right here at the bottom right chat bubble. 

Continuously Manage Your CircleCI Implementation with Coralogix

For many companies, success depends on efficient build, test and delivery processes resulting in higher quality CI/CD solutions. However, development and deployment environments can become complex very quickly, even for small and medium companies.

A contributing factor to this complexity is the high adoption rate of microservices. This is where modern CI/CD solutions like CircleCI come in to provide greater visibility. In this post, we’ll walk through the Coralogix-CircleCI integration and how it provides data and alerts to allow CircleCI users to get even more value from their investment.

See this post for how to set up the integration.

Once completed, the integration ships CircleCI logs to Coralogix. Coralogix leverages our product capabilities and ML algorithms providing users with deep insight and proactive management capabilities. It allows them to continuously adjust, optimize and improve their CI processes. To borrow from CI/CD vocabulary, it becomes a CM[CI/CD], or a Continuously Managed CI/CD, process.

In addition, using the CircleCI Orb will automatically tag each new version you deploy allowing you to enjoy our ML Auto Version Benchmarks. 

The rest of this document provides examples of visualizations and alerts that will help implement this continuous management of your CircleCI implementation.

Visualizations

Top committers

This table shows the top committers per day. The time frame can be adjusted based on specific customer profiles. It uses the user.name’ field to identify the user.

Jobs with most failures

This visualization uses the ‘status’ and ‘workflows.job_name’ fields. It shows the jobs that had the most failures per time frame specified by the customer profile.

Class distribution

Class usage relates to memory and resource allocation. This visualization uses the field  ‘picard.resource_class.class’, part of the log’s picard object. Its optional values are ‘small’, ‘medium’, and ‘large’. The second field used is ‘workflows.workflow_name’ that holds the workflow name. Although classes are set by configuration and do not change dynamically, they are tightly related to your credit charges. It will be good to have this monitored to identify if a developer unexpectedly runs a new build that will impact your quota.

For the same reasons mentioned above, it could be beneficial to see a view of the class distribution per executors like the following example:

Average job runtime

The following visualizations help identify trends in job execution time, per build environment, and per executor. They give different perspectives on the average job runtime.

The first one gives an executor perspective for each job environment. It uses the ‘picard.build_agent.executor’ and the ‘build_time_millis’ to calculate the average per environment and per day (in this example day is the aggregation unit).

Depending on your needs, you can change the time frame for calculating the averages. It is important to note that the visualization should calculate the average time of successful job runs based on the filter ‘status:success’. 

In a very similar way, this visualization shows the average job runtime per workflow, using the ‘workflows.workflow_name’ field:

This visualization shows the average job runtime for each job:

Depending on preference these visualizations can be configured to show a line graph. This is applicable to companies with higher frequency runs:

Job runs distribution per workflow

This visualization gives information about the number of runs for each workflow’s job. It can alert the analyst or engineer to situations where a job has more than the usual number of runs due to failures or frequent builds:

Number of workflows

These two are quite simple. Again, it is the user specific circumstances that will determine the time range for data aggregation.

Job status ratio

This visualization shows the distribution of job completion statuses. There are four optional values; ‘success’, ‘onhold’, ‘failed’, and ‘cancelled’. The ‘onhold’ and ‘cancelled’ values are very rare. It is important to get visibility into the ratio as an indicator of when things actual do go wrong.

Alerts

In this section we will show how you can transform managing your deployment environment to be more proactive by using some of Coralogix’s innovative capabilities. Such as, its ability to identify changes from normal application behavior and the easy-to-use alert engine. Here are a few examples of alerts covering different aspects of monitoring CircleCI insights.

This tutorial explains how to use and define Coralogix alerts.

Job failure

This is an operational alert. It sends a notification when a job named ‘smtt’ fails.

Alert query:

workflows.job_name:smtt AND status:failed

If we have more than one job with the same name, running in different workflows, we can add the workflow name to the query, ‘AND workflows.workflow_name:CS’. The alert query can also be changed to capture a set of alerts based on a query language. For example ‘workflows.job_names:sm*’ or ‘workflows.job_names:/sm[a-z]+/’.

The alert condition is an immediate alert

Job duration

This is another example of an operational alert that sends a notification if a job runtime is larger than a threshold. We use ‘build_time_millis.numeric’. This is a numeric version Coralogix creates for every field. Since every job is different, the query for this alert can come with a job or workflow name. It can also look for outlier values like in this example:

Alert query:

build_time_millis.numeric:>20000

Alert condition:

Ratio of ‘failure’ compared to to all job runs is above the threshold

In this operational alert, a user will get a notification when the ratio of failed job runs to overall number of runs, is over a certain threshold. In this purpose, we’ll use the Coralogix ‘Ratio alerts’ type. For this alert type, users define two queries and then alert on the ratio between the number of logs in both queries’ results. Our query example counts the overall number of jobs and the number of failures:

Alert query 1:

status:*

Alert query 2:

status:failed

This condition alerts the user if failures are more than 25% of job outcomes:

SSH Disabled

This is a security alert. The field ‘ssh_disabled’ is a boolean field. When false, it indicates that users are running jobs and workflows remotely using SSH. For some companies, SSH runs will be considered a red flag.

Alert query:

ssh_disabled:false

Alert condition:

If choosing specific fields for the notification using the Coralogix Alert Notification Content, make sure you include ‘ssh_users’. Its value is an array of strings that includes the user names of the SSH users. 

You can of course set security alerts based on other key-value pairs like ‘user.login’, ‘user.name’, or ‘picard.build_agent.instance_ip’.

As an example, this query will create an alert if picard.build_agent.instance_ip does not belong to a group of approved IP addresses that start with 170:

Alert query:

NOT picard.build_agent.instance_ip.keyword:/170.d{1,3}.d{1,3}.d{1,3}/

To learn more about keyword fields and how to use regular expressions in queries see our queries tutorial.

As you know each company has its own build schedule and configuration. One of the powers of Coralogix is its ease of use and flexibility, allowing you to take the concepts and examples found in this document and adapt them to your own environment and needs. We are always an email or intercom chat away.

A practical guide to FluentD

In this post we will cover some of the main use cases FluentD supports and provides example FluentD configurations for the different cases.

What is Fluentd

Fluentd is an open source data collector, which allows you to unify your data collection and consumption. Fluentd was conceived by Sadayuki “Sada” Furuhashi in 2011. Sada is a co-founder of Treasure Data, Inc., the primary sponsor of the Fluentd and the source of stable Fluentd releases.

Installation

Fluentd installation instructions can be found on the fluentd website.

Here are Coralogix’s Fluentd plugin installation instructions

Coralogix also has a Fluentd plug-in image for k8s.  This doc describes Coralogix integration with Kubernetes. 

Configuration

Flunetd configuration file consists of the following directives (only source and match are mandatory ones):

  1. source directives determine the input sources.
  2. match directives determine the output destinations.
  3. filter directives determine the event processing pipelines. (optional)
  4. system directives set system wide configuration. (optional)
  5. label directives group the output and filter for internal
    routing (optional)
  6. @include directives include other files. (optional)

Fluentd configuration is organized by hierarchy. Each of the directives has different plug-ins and each of the plug-ins has its own parameters. There are numerous plug-ins and parameters associated with each of them. In this post I will go over  on a few of the commonly used ones and focus on giving examples that worked for us here at Coralogix. I also tried to plug pointers to existing documentation to help you locate directive and plug-ins that are not mentioned here. 

Without further ado let’s dive in.

These directives will be present in any Fluentd configuration file:

Source

This is an example of a typical source section in a Fluentd configuration file:

<source>
  @type tail
  path /var/log/msystem.log
  pos_file /var/log/msystem.log.pos
  tag mytag
  <parse>
    @type none
  </parse>
</source>

Let’s examine the different components:

@type tail –  This is one of the most common  Fluentd input plug-ins. There are built-in input plug-ins and many others that are customized. The ‘tail’ plug-in allows Fluentd to read events from the tail of text files. Its behavior is similar to the tail -F command. The file that is read is indicated by ‘path’. Fluentd starts from the last log in the file on restart or from the last position stored in ‘pos_file’, You can also read the file from the beginning by using the ‘read_from_head true’ option in the source directive. When the log file is rotated Fluentd will start from the beginning. Each input plug-in comes with parameters that control its behavior. These are the tail parameters.

Tags allow Fluentd to route logs from specific sources to different outputs based on conditions. E.g – send logs containing the value “compliance” to a long term storage and logs containing the value “stage” to a short term storage.

The parser directive, <parse>, located within the source directive, , opens a format section. This is mandatory. It can use type none (like in our example) if no parsing is needed. This list includes the built-in parsers. There is an option to add a custom parser

One of the commonly used built-in parsers is ‘multiline’. Multiline logs are logs that span across lines. Log shippers will ship these lines as separate logs, making it hard to get the needed information from the log. The ‘Multiline’ parser enables the restructuring and formatting of multiline logs into the one log they represent. You can see a few examples of this parser in action in our examples’ section. See here for a full logging in multiline guide

An example of a multiline configuration file using regex:

<source>
  @type tail
  path /var/log/msystem.log
  pos_file /var/log/msystem.log.pos
  tag mytag
  <parse>
          @type multiline
          # Each firstline starts with a pattern matching the below REGEX.
          format_firstline /^d{2,4}-d{2,4}-d{2,4} d{2,4}:d{2,4}:d{2,4}.d{3,4}/
          format1 /(?<message>.*)/
  </parse>
</source>

These input plug-ins support the parsing directive.

Match  

The Match section uses a rule. Matches each incoming event to the rule and and routes it through an output plug-in. There are different output plug-ins. This is a simple example of a Match section:

<match mytag**>
   @type stdout
</match>

It will match the logs that have a tag name starting with mytag and direct them to stdout. Like the input plug-ins, the output ones come with their own parameters. See The http documentation as an example.  

Combining the two previous directives’ examples will give us a functioning Fluentd configuration file that will read logs from a file and send them to stdout.

HTTP output plug-in

One of the most common plugins is HTTP. We recommend using the generic HTTP output plugin, as it has plenty of adjustability and exposed metrics. Just insert the private key and paste the correct endpoint (you can look at the table below). You can read more in our tutorial.

Here is a basic HTTP plug in example:

<match **>
  @type http
  @id out_http_coralogix
#The @id parameter specifies a unique name for the configuration. It is used as paths for buffer, storage, logging and for other purposes.
  endpoint "https://ingress.<domain>/logs/rest/singles"
  headers {"private_key":"xxxxxxx"}
  error_response_as_unrecoverable false
  <buffer tag>
    @type memory
    chunk_limit_size 5MB
    compress gzip
    flush_interval 1s
    overflow_action block
    retry_max_times 5
    retry_type periodic
    retry_wait 2
  </buffer>
  <secondary>
    #If any messages fail to send they will be send to STDOUT for debug.
    @type stdout
  </secondary>
</match>

Choose the correct https://ingress.<domain>/logs/rest/singles endpoint that matches the cluster under this URL.

Filter

Another common directive, and one that is mandatory in this case, is ‘filter’. The name of this directive is self explanatory. The filter plug-ins allow users to:

  • Filter out events by grepping the value of one or more fields.
  • Enrich events by adding new fields.
  • Delete or mask certain fields for privacy and compliance.
  • Parse text log messages into JSON logs

Filters can be chained together.

In order to pass our data to Coralogix API we must manipulate our data (using the record_transformer plugin) so the structure of the data will be valid by the API.

As an example, this filter will show the fields needed in order to be valid by the API:

  <filter **>
    @type record_transformer
    @log_level warn
    #will only show warn and info logs
    enable_ruby true
    #allows the usage of ${}
    auto_typecast true
    renew_record true
    <record>
      # In this example we are using record to set values.
      # Values can also be static, dynamic or simple variables
      applicationName app
      subsystemName subsystem
      timestamp ${time.strftime('%s%L')} # Optional
      text ${record.to_json} # using {record['message']} will display as txt
    </record>
  </filter>

At this point we have enough Fluentd knowledge to start exploring some actual configuration files.

The rest of this document includes more complex examples of Fluentd configurations. They include detailed comments and you can use them as references to get additional information about different plug-ins and parameters or to learn more about Fluentd.

Configuration examples

Example 1

This configuration example shows how to use the rewrite_tag_filter plug-in to separate the logs into two groups and send them with different metadata values.

<source>
  @type tail
  #Reading from file locateed in path and saving the pointer to the file line in pos_file
  @label @CORALOGIX
  #Label reduces complex tag handling by separating data pipelines, CORALOGIX events are routed to label @CORALOGIX
  path /var/log/nginx/access.log
  pos_file /var/log/td-agent/nginx/access.log.pos
  tag nginx.access
  #tagging it as the nginx access logs
  <parse>
    @type nginx
    #nginx parsing plugin
  </parse>
</source>

<source>
  @type tail
  @label @CORALOGIX
  path /var/log/nginx/error.log
  pos_file /var/log/td-agent/nginx/error.log.pos
  tag nginx.error
  #tagging it as the nginx error logs
  <parse>
    @type none
    #no parsing is done
  </parse>
</source>

<label @CORALOGIX>
#as mentioned above events are routed from @label @CORALOGIX
  <filter nginx.access>
  #nginx access logs will go through this filter
    @type record_transformer
    #using this plugin to manipulate our data
    <record>
      severity "info"
      #nginx access logs will be sent as info
    </record>
  </filter>

  <filter nginx.error>
    @type record_transformer
    #error logs will go throgh this filter
    <record>
      severity "error"
      #error logs will be sent as error
    </record>
  </filter>
  <filter **>
    @type record_transformer
    @log_level warn
    enable_ruby true
    auto_typecast true
    renew_record true
    <record>
      # In this example we are using record.dig to dynamically set values.
      # Values can also be static or simple variables
      applicationName fluentD
      subsystemName ${tag}
      timestamp ${time.strftime('%s%L')} # Optional
      text ${record['message']}
#will send the log as a regular text
    </record>
  </filter>
  <match **>
    @type http
    @id coralogix
    endpoint "https://ingress.coralogixstg.wpengine.com/logs/rest/singles"
    headers {"private_key":"XXXXX"}
    retryable_response_codes 503
    error_response_as_unrecoverable false
    <buffer>
      @type memory
      chunk_limit_size 5MB
      compress gzip
      flush_interval 1s
      overflow_action block
      retry_max_times 5
      retry_type periodic
      retry_wait 2
    </buffer>
    <secondary>
      #If any messages fail to send they will be send to STDOUT for debug.
      @type stdout
    </secondary>
  </match>
</label>

Example 2

In this example a file is read starting with the last line (the default). The message section of the logs is extracted and the multiline logs are parsed into a json format.

<source>
  @type tail
  path M:/var/logs/inputlogs.log
  pos_file M:/var/logs/inputlogs.log.pos
  tag mycompany
  <parse>
# This parse section will find the first line of the log that starts with a date. The log 
#includes  the substring “message”. ‘Parse’ will extract what follows “message” into a #json field called ‘message’. See additional details in #Example 1.
    @type multiline
    format_firstline /^d{2,4}-d{2}-d{2,4}/
    format1 /(?<message>.*)/
  </parse>
</source>
  <match **>
#match is going to use the HTTP plugin
    @type http
    @davidcoralogix-com
#The @id parameter specifies a unique name for the configuration. It is used as paths for buffer, storage, logging and for other purposes.
    endpoint "https://ingress.coralogixstg.wpengine.com/logs/rest/singles"
    headers {"private_key":"XXXXX"}
    retryable_response_codes 503
    error_response_as_unrecoverable false
    <buffer>
      @type memory
      chunk_limit_size 5MB
      compress gzip
      flush_interval 1s
      overflow_action block
      retry_max_times 5
      retry_type periodic
      retry_wait 2
    </buffer>
    <secondary>
      #If any messages fail to send they will be send to STDOUT for debug.
      @type stdout
    </secondary>
  </match>

Example 3

This example uses the http input plug-in. This plug-in enables you to gather logs while sending them to an end point. It uses the enable_ruby option to transform the logs and uses the copy plug-in to send logs to two different inputs.

<source>
  @type http
  port 1977
  bind 0.0.0.0
  tag monitor
#This indicates the max size of a posted object   
  body_size_limit 2m
#This is the timeout to keep a connection alive
  keepalive_timeout 20s
#If true adds the http prefix to the log
  add_http_headers true
#If true adds the remote, client address, to the log. If there are multiple forward headers in the request it will take the first one  
  add_remote_addr true
  <parse> 
     @type none
  </parse>
</source>

<filter monitor>
#record_transformer is a filter plug-in that allows transforming, deleting, and adding events
  @type record_transformer
#With the enable_ruby option, an arbitrary Ruby expression can be used inside #${...}
  enable_ruby
#Parameters inside <record> directives are considered to be new key-value pairs
  <record>
#Parse json data inside of the nested field called “log”. Very useful with #escaped fields. If log doesn’t exist or is not a valid json, it will do #nothing. 
    log ${JSON.parse(record["log"]) rescue record["log"]}
#This will create a new message field under root that includes a parsed log.message field.
    message ${JSON.parse(record.dig(“log”, “message”)) rescue ""}
  </record>
</filter>
<match monitor>
  @type copy
  <store>
    @type http
    @id coralogix
    endpoint "https://ingress.coralogixstg.wpengine.com/logs/rest/singles"
    headers {"private_key":"XXXXX"}
    retryable_response_codes 503
    error_response_as_unrecoverable false
    <buffer>
      @type memory
      chunk_limit_size 5MB
      compress gzip
      flush_interval 1s
      overflow_action block
      retry_max_times 5
      retry_type periodic
      retry_wait 2
    </buffer>
  </store>

  <store>
    @type stdout
    output_type json
  </store>
</match>

<match **>
#Split is a third party output plug-in. It helps split a log and parse #specific fields.
  @type split
#separator between split elements 
  separator   s+
#regex that matches the keys and values within the splitted key
  format      ^(?<key>[^=]+?)=(?<value>.*)$
#Key that holds the information to be splitted
  key_name message
#keep the original field
  reserve_msg yes
  keep_keys HTTP_PRIVATE_KEY
</match>

Example 4

This example uses label in order to route the logs through its Fluentd journey. At the end we send Fluentd logs to stdout for debug purpose.

# Read Tomcat logs
<source>
#Logs are read from a file located at path. A pointer to the last position in #the log file is located at pos_file
  @type tail
#Labels allow users to separate data pipelines. You will see the lable section #down the file.
  @label @AGGREGATION
  path /usr/local/tomcat/logs/*.*
#adds the watched file path as a value of a new key filename in the log
  path_key filename
#This path will not be watched by fluentd
  exclude_path ["/usr/local/tomcat/logs/gc*"]
  pos_file /fluentd/log/tomcat.log.pos
  <parse>
#This parse section uses the multi_format plug-in. This plug-in needs to be #downloaded and doesn’t come with Fluentd. After installing it users can #configure multiple <pattern>s to #specify multiple parser formats. In this #configuration file we have 2 patterns being formatted. 
    @type multi_format
    # Access logs
    <pattern>
      format regexp
      expression /^(?<client_ip>.*?) [(?<timestamp>d{2}/[a-zA-Z]{3}/d{4}:d{2}:d{2}:d{2} +d{4})] "(?<message>.*?)" (?<response_code>d+) (?<bytes_send>[0-9-]+) (?<request_time>d+)$/
      types response_code:integer,bytes_send:integer,request_time:integer
#Specifies time field for event time. If the event doesn't have this field, #current time is used.
      time_key timestamp
#Processes value using specific formats
      time_format %d/%b/%Y:%T %z
#When true keeps the time key in the log
      keep_time_key true
    </pattern>
# Stacktrace or undefined logs are kept as is
    <pattern>
      format none
    </pattern>
  </parse>
  tag tomcat
</source>

# Read Cloud logs
<source>
  @type tail
  @label @AWS
  path /usr/local/tomcat/logs/gc*
  pos_file /fluentd/log/gc.log.pos
  format none
  tag gclogs
</source>

# Route logs according to their types
<label @AGGREGATION>
  # Strip log message using a filter section
  <filter tomcat.**>
#record_transformer is a filter plug-in that allows transforming, deleting, and #adding events
    @type record_transformer
#With the enable_ruby option, an arbitrary Ruby expression can be used inside #${...}
    enable_ruby
#Parameters inside <record> directives are considered to be new key-value pairs
    <record>
      message ${record["message"].strip rescue record["message"]}
    </record>
  </filter>
# Delete undefined character
# This filter section filters the tomcat logs 
  <filter tomcat.**>
#record_transformer is a filter plug-in that allows transforming, deleting, and #adding events
    @type record_transformer
    Enable_ruby
#Parameters inside <record> directives are considered to be new key-value pairs
    <record>
      message ${record["message"].encode('UTF-8', invalid: :replace, undef: :replace, replace: '?') rescue record["message"]}
    </record>
  </filter>

# Concat stacktrace logs to processing
  <filter tomcat.**>
#A plug-in that needs to be installed
    @type concat
#This is the key for part of the multiline log
    key message
#This defines the separator
    separator " "
#The key to determine which stream an event belongs to
    stream_identity_key filename
#The regexp to match beginning of multiline.
    multiline_start_regexp /^((d{2}/d{2}/d{4} d{2}:d{2}:d{2}.d{1,3})|(d{2}-[a-zA-Z]{3}-d{4} d{2}:d{2}:d{2}.d{1,3})|NOTE:) /
#Use timestamp of first record when buffer is flushed.
    use_first_timestamp true
#The number of seconds after which the last received event log will be flushed
    flush_interval 5
#The label name to handle events caused by timeout
    timeout_label @PROCESSING
  </filter>
# Route logs to processing
  <match tomcat.**>
    @type relabel
    @label @PROCESSING
  </match>
</label>

 # Process simple logs before sending to Coralogix
<label @PROCESSING>
# Parse stacktrace logs
  <filter tomcat.**>
    @type parser
    format /^(?<timestamp>d{2}/d{2}/d{4} d{2}:d{2}:d{2}.d{1,3}) (?<hostname>.*?)|(?<thread>.*?)|(?<severity>[A-Z ]+)|(?<TenantId>.*?)|(?<UserId>.*?)|(?<executor>.*?) - (?<message>.*)$/
#Specifies time field for event time. If the event doesn't have this field, #current time is used.
    time_key timestamp
#Processes value using specific formats
    time_format %d/%m/%Y %T.%L
#When true keeps the time key in the log
    keep_time_key true
    key_name message
    reserve_data true
    emit_invalid_record_to_error false
  </filter>

 # Parse access logs request info
  <filter tomcat.**>
    @type parser
    format /^(?<method>GET|HEAD|POST|PUT|DELETE|CONNECT|OPTIONS|TRACE|PATCH) (?<path>/.*?) (?<protocol>.+)$/
    key_name message
    hash_value_field request
    reserve_data true
    emit_invalid_record_to_error false
  </filter>

# Other logs  
  <filter tomcat.**>
#This is a filter plug-in that pases the logs
    @type parser
    format /^(?<timestamp>d{2}-[a-zA-Z]{3}-d{4} d{2}:d{2}:d{2}.d{1,3}) (?<severity>[A-Z ]+) [(?<thread>.*?)] (?<executor>.*?) (?<message>.*)$/
#Specifies time field for event time. If the event doesn't have this field, #current time is used.
    time_key timestamp
#Processes value using specific formats
    time_format %d-%b-%Y %T.%L
#When true keeps the time key in the log
    keep_time_key true
#message is a key in the log to be filtered
    key_name message
#keep the other key:value pairs
    reserve_data true
#Emit invalid records to @ERROR label. Invalid cases are key not exist, format #is not matched, and unexpected error. If you want to ignore these errors set #to false.
    emit_invalid_record_to_error false
  </filter>

# Add filename and severity
  <filter tomcat.**>
#record_transformet is a filter plug-in that allows transforming, deleting, and #adding events
    @type record_transformer
#With the enable_ruby option, an arbitrary Ruby expression can be used inside #${...}
    Enable_ruby
#Parameters inside <record> directives are considered to be new key-value pairs
    <record>
#Overwrite the value of filename with the filename itself without the full path
      filename ${File.basename(record["filename"])}
#Takes the value of the field “severity” and trims it. If there is no severity #field create it and return the value DEBUG
      severity ${record["severity"].strip rescue "DEBUG"}
    </record>
  </filter> 
  # Route logs to output
  <match tomcat.**>
#Routes all logs to @labe
    @type relabel
    @label @CORALOGIX
  </match>
</label>

<label @CORALOGIX>
  <match **>
    @type http
    @id coralogix
    endpoint "https://ingress.coralogixstg.wpengine.com/logs/rest/singles"
    headers {"private_key":"d2aaf000-4bd8-154a-b7e0-aebaef7a9b2f"}
    retryable_response_codes 503
    error_response_as_unrecoverable false
    <buffer>
      @type memory
      chunk_limit_size 5MB
      compress gzip
      flush_interval 1s
      overflow_action block
      retry_max_times 5
      retry_type periodic
      retry_wait 2
    </buffer>
</label>

# Send GC logs to AWS S3 bucket
#<label> indicates that only AWS labeled logs will be processed here. They will #skip sections not labeled with AWS
<label @AWS>
  <match gclogs.**>
#The S3 output plugin is included with td-agent (not with Fluentd). You can get #information about its specific parameters in the documentation
   @type s3
   aws_key_id "#{ENV['AWS_ACCESS_KEY_ID']}"
   aws_sec_key "#{ENV['AWS_SECRET_ACCESS_KEY']}"
   s3_bucket "#{ENV['S3Bucket']}"
   s3_region us-east-1
   path /logs/"#{ENV['SUBSYSTEM_NAME']}"
   buffer_path /fluentd/logs
   store_as text
   utc
   time_slice_format %Y%m%d%H
   time_slice_wait 10m
   s3_object_key_format "%{path}%{time_slice}_#{Socket.gethostname}%{index}.%{file_extension}"
   buffer_chunk_limit 256m
   <buffer time>
    timekey      1h # chunks per hours ("3600" also available)
    timekey_wait 5m # 5mins delay for flush ("300" also available)
   </buffer>
  </match>
</label>
 
# Print internal Fluentd logs to console for debug
<match fluent.**>
  @type stdout
  output_type hash
</match>

Example 5

The following configuration reads the input files starting with the first line. Then transform multi line logs into a json format. It sends the logs to stdout.

<source>
  @type tail
#The parameter ‘read_from_head’ is set to true. It will read all files from the #first line instead of #the default last line
  tag audit
  read_from_head true
# Adds the file name to the sent log.  
  path_key filename
  path /etc/logs/product_failure/*.*.testInfo/smoke*-vsim-*/mroot/etc/log/auditlog.log.*
  pos_file /etc/logs/product_failure/audit_logs.fluentd.pos
  <parse>
#The multiline parser plugin parses multiline logs. This plugin is multiline #version of regexp parser.
    @type multiline
#This will match the first line of the log to be parsed. The plugin can skip #the logs until format_firstline is matched.
    format_firstline /^(?<timestamp>[a-zA-Z]{3} [a-zA-Z]{3} *[0-9]{1,2} [0-9]{2}:[0-9]{2}:[0-9]{2}(?: [A-Z]+)?)/
#Specifies regexp patterns. For readability, you can separate regexp patterns #into multiple format1 … formatN. The regex will match the log and each named #group will become a key:value pair in a json formatted log. The key will be #the group name and the value will be the group value.
    format1 /^(?<timestamp>[a-zA-Z]{3} [a-zA-Z]{3} *[0-9]{1,2} [0-9]{2}:[0-9]{2}:[0-9]{2}(?: [A-Z]+)?) [(?<machine>[^:]+):(?<shell>[^:]+):(?<severity>[^]]+)]: (?<message>.*)/
  </parse>
</source>

# Send to STDOUT
<match *>
  @type stdout
</match>