With over 7.3 million docker accounts created in 2021, Docker’s popularity has seen a meteoric rise since its launch in 2013. However, more businesses using it also means attackers are incentivized to target docker vulnerabilities.
As per a 2020 report, 50% of poorly configured docker instances were subjected to cyber-attacks. And it’s not that easy to spot these poor configurations either because you must conduct checks at multiple levels.
What if attackers create a Malware-laden container and upload it to your company’s data repositories due to these poor configurations? The business impact this untrusted container can cause is horrifying, isn’t it?
Consider adding container security to your DevOps pipeline if you’re using Docker to set up containers and portability easily. With the rising number of organization-level cyberattacks, container security needs to be part of your overall security framework.
What is Container Security?
From CI/CD pipeline, container runtime, and protecting applications running on containers, container security encompasses risk management throughout your environment. The process of docker container security is similar, but you have to address a few safety concerns.
A prerequisite to container security is observability. Container-based deployments can include tens or hundreds of services being spun up at a given instant. Thus, logging and monitoring across these multiple cloud and on-premise environments become serious challenges. You need to use a full-stack observability platform like Coralogix to get a complete picture of your containerized environment’s health.
After you have observability in place, using a robust set of container security best practices will help you in the long term, especially when your company looks to expand the dockers in the environment. Let’s look at some of the prominent ones for protecting containerized applications.
Container Security Best Practices
1. Using minimal and secure base images
Cloud developers often use a large number of images for their Docker containers. If your project doesn’t require system libraries and utilities, you must avoid using an entire OS as a base image. Let’s understand why.
Bundling images can increase the chances of vulnerabilities. We recommend you use minimal images with just the right number of libraries and tools sufficient for your project. By doing so, you are consciously cutting down the attack surface.
2. Securing Container Runtime
In an agile setup, securing container applications’ runtime is typically the developer’s responsibility. In case of a network breach, it is vital to configure the runtime settings to curb the damage immediately. Developers need to keep track of container engine runtime settings.
Kubernetes comes with built-in tools that enhance container security, such as:
Network policies – to finely control container behavior.
Admission controllers – apply rules customized for specific attack parameters.
Role-Based Access Control (RBAC) – fine-tune authorization policies at the cluster level.
Secrets – use the secrets management tool to store your credentials instead of saving them in container images or configuration files.
Falco – analyzes threats using its audit logging feature.
3. Securing Registries
In addition to ensuring docker container security, protecting the container infrastructure stack is equally essential. Registries (storage and distribution platforms for docker images) can act as a hub for vulnerabilities and malware.
As a safe practice, always provide role-based “need-to-know” access for any user that needs to access the registries.
4. Securing Container Orchestrators such as Kubernetes
Container orchestration means using tools to automate the operations associated with running containers. Orchestration platforms like Kubernetes help automate tasks like assigning specific nodes to containers and their efficient packing.
Although Kubernetes helps you manage container applications, it doesn’t secure the health of the underlying infrastructure. You must build observability at a full-stack level to keep track of system behavior.
To ensure real-time security, you need to leverage the log data stored by Kubernetes in the nodes. Forward these logs to a centralized observability platform like Coralogix, and you can now perform Kubernetes monitoring seamlessly.
5. Securing the build pipeline
You can create an additional security layer for your containerized applications’ CI/CD pipelines. Scan your container images during their entry into registries.
These checks help detect malicious code that slipped your security checks in the earlier stages of your build pipelines. How does this slippage happen?
Vulnerabilities may be absent at the source code stage but may enter as a part of dependencies as the code proceeds through the build pipeline. Tools like SAST or SCA, which perform checks at the source stage, may fail to detect these. Scanning at the registry stage improves the probability of detection of these vulnerabilities.
6. Securing deployment
Use these five steps to make your container deployment more secure:
Run third-party debugging tools like the static analysis on your Container code. This step identifies coding errors that lead to security issues.
Broaden your testing framework. In addition to testing functions, also cross-check dependencies and their associated vulnerabilities.
Destroy affected containers instead of patching them. This practice will help avoid the chances of manual errors.
Ensure your host system meets CIS benchmarks. The container software and orchestrator at the host need to satisfy this compliance standard to avoid insecure code.
Restrict container privileges. Enabling root privileges and flags allows attackers to gain control outside the container and stage an attack.
7. Monitoring Container Traffic
Container traffic involves the continuous collection of application metrics needed for their health and smooth operation. As a developer, you can identify irregular traffic patterns in your container patterns via API monitoring. You can trace connections between containers and external entities.
Another safety practice is by strengthening your defenses against traffic sniffing via Kubernetes. Enable Transport Layer Security (TLS) to authenticate user identities at both ends.
Default Kubernetes permit unrestricted traffic between pods. You can tighten the traffic by configuring network policies.
Improving Container Security with Coralogix
As your container environment grows, traditional monitoring just isn’t enough. With applications distributed across environments, full-stack observability fills in the blind spots of complex IT systems and their dependencies.
Coralogix ensures the security of collaborative containerized environments via real-time observability and data analytics capabilities. You can view application metrics from logs, traces, and metrics on a single centralized dashboard, ensuring hassle-free troubleshooting and security control.
There is a common painful workflow with many observability solutions. Each data type is separated into its own user interface, creating a disjointed workflow that increases cognitive load and slows down Mean Time to Diagnose (MTTD).
At Coralogix, we aim to give our customers the maximum possible insights for the minimum possible effort. We’ve expanded our APM features (see documentation) to provide deep, contextual insights into applications – but we’ve done something different.
Why is APM so important?
Application Performance Monitoring (APM) is one of the most sophisticated capabilities in the observability industry. It allows engineers and operators to inspect detailed application and infrastructure performance metrics. This can include everything from correlated host and application metrics to the time taken for a specific subsystem call.
APM has become essential due to two major factors:
Engineers are reusing more and more code. Open-source libraries provide vast portions of our applications. Engineers don’t always have visibility of most of our application(s).
As the application stack grows more extensive, with more and more components performing increasingly sophisticated calculations, the internal behavior of our applications contains more and more useful information.
What is missing in other providers?
Typically, most providers fall victim to the data silo. A siloed mentality encourages engineers to separate their interface and features from the data, not the user journey. This means that in most observability providers, APM data is held in its own place, hidden away from logs, metrics, traces, and security data.
This makes sense from a data perspective. They are entirely different datasets typically used, with varying data demands. This is the basis for the argument to separate this data. We saw this across our competitors and realized that this was slowing down engineers, prolonging outages, and making it more difficult for users to convert their data into actionable insights.
How is Coralogix approaching APM differently?
Coralogix is a full-stack observability platform, and the features across our application exemplify this. For example, our home dashboard covers logs, metrics, traces, and security data:
The expansion of our APM capability (see documentation) is no different. Rather than segregating our data, we want our customers to journey through the stack naturally rather than leaping between different data types to try and piece together the whole picture. With this in mind, It all begins with traces.
Enter the tracing UI and view traces. The filter UI allows users to slice data in several ways, for example, filtering by the 95th Percentile of latency.
Select a span within a trace. This opens up a wealth of incredibly detailed metrics related to the source application. Users can view the logs that were written during the course of this span. This workflow is typically achieved by noting the time of a span and querying them in the logging UI. At Coralogix, this is simply one click.
Track Application Pod Metrics
However, the UI now has the Pod and Host metric for a more detailed insight into application health at the time that the span was generated. These metrics will provide detailed insights into the health of the application pod itself within the Kubernetes cluster. It shows metrics from a few minutes before and after the span so that users can clearly see the sequence of events leading to their span. This level of detail allows users to diagnose even the most complex application issues immediately.
Track Infrastructure Host Metrics
In addition to tracking the application’s behavior, users can also take a wider view of the host machine. Now, it’s possible to detect when the root cause isn’t driven by the application but by a “noisy neighbor.” All this information is available, alongside the tracing information, with only one click between these detailed insights.
Tackle Novel Problems Instantly
If a span took longer than expected, inspect the memory and CPU to understand if the application was experiencing a high load. If an application throws an error, inspect the logs and metrics automatically attached to the trace to better understand why. This connection, between application level data and infrastructure data, is the essence of cutting-edge APM.
Combined with a user-focused journey, with Coralogix, a 30-minute investigation becomes a 30-second discovery.
Distributed tracing is the ability to follow a request through a software system from beginning to end. While that may sound trivial, a single request can easily spawn multiple child requests to different microservices with modern distributed architectures. These, in turn, trigger further sub-requests, resulting in a complex web of transactions to service a single originating request.
While each microservice can generate logs for the specific transactions they handle, those logs don’t describe the entire flow of a request. Piecing transactions together manually is a labor-intensive process.
This is where distributed tracing comes in: by propagating identifiers to each child request (or “span”), tracing allows you to join the dots between transactions and map the entire chain of events. When you’re debugging a complex issue or looking for the source of a performance bottleneck in a distributed microservice-based architecture, distributed tracing provides the insights that logs and the metrics on their own cannot.
In response to the growth in popularity of microservice architectures, several distributed tracing tools have been developed, of which Jaeger is one. Jaeger distributed tracing is an open-source distributed tracing platform that allows you to collect, aggregate, and analyze trace data from software systems.
Initially developed in 2015 by ride-share giant, Uber, Jaeger was adopted by the Cloud Native Computing Foundation (CNCF) in 2017. Two years later, the project was promoted from incubation to graduated status, reflecting its maturity as an established, widely used, and well-documented platform.
Jaeger Architecture
As you might expect from a CNCF project, Jaeger is designed for cloud-hosted, containerized, microservice-based systems. It consists of the following elements:
Instrumentation logic – To propagate identifiers and collect timestamps and other trace metadata, you first need to instrument your application code. Until recently, this was achieved using the Jaeger client libraries – language-specific implementations of the OpenTracing API. However, following the consolidation of OpenTracing and OpenCensus into OpenTelementry, the Jaeger client libraries have been deprecated in favor of the OpenTelemetry APIs and SDKs.
Jaeger agent – The agent listens for the individual spans that make up a complete trace and forwards them to the collector. While you don’t have to include the Jaeger agent, it’s helpful for larger, more complex systems as it takes care of service discovery for the Jaeger collectors.
Jaeger collector – The collector is a key part of the Jaeger platform. It’s responsible for receiving and processing traces before forwarding them to storage and sending sampling instructions back to the instrumentation logic.
Database – When you implement Jaeger, you need to set up a database to store your traces for analysis. Jaeger supports both Elasticsearch and Cassandra, and provides an extensible plugin framework so that you can implement a different storage mechanism. You can send traces data from the collector to the database directly, or – for larger loads – use Kafka to stream the data. If you use Kafka, you’ll also need to deploy the Jaeger ingester to write traces from Kafka to the database.
Jaeger query and UI – The Jaeger query service exposes an API that allows you to query trace data and start making sense of how your system is behaving. It ships with a GUI to search for traces based on various parameters, including the services involved and the trace duration.
Implementing tracing with Jaeger
When implementing jaeger distributed tracing, there are various considerations to bear in mind.
Instrumenting your application code
The first step towards distributed tracing is to instrument your application code. While this involves some initial effort, it’s an investment that renders your system more observable. The result is that you can later answer questions that you didn’t know you would want to ask. To facilitate the adoption of distributed tracing and avoid vendor lock-in, the industry has centered on an open standard for tracing instrumentation: OpenTelemetry.
Jaeger added native support for OpenTelemetry in 2022, meaning that if you’ve instrumented your application code using the OpenTelemetry Protocol (OTLP) API or SDKs, you can now send traces directly to the Jaeger collector. The Jaeger client libraries have been deprecated, so for new implementations, it’s best to use OpenTelemetry for instrumentation. Using this open standard also allows you to move to other tracing solutions without having to re-instrument your application code first.
Distributed vs. all-in-one deployment
Jaeger ships with an all-in-one deployment option, with the agent, collector, and query service in a single container image. However, as this design offers no resilience in the event of the node failing, it’s only suitable for proof-of-concept and demo implementations.
You’ll need to implement multiple collectors to provide resilience and scale for production deployments. This is where it’s beneficial to use the agent for service discovery. You can then send data directly to the storage backend or stream it via Kafka.
Deploying Jaeger on Kubernetes
If you’re using Kubernetes to orchestrate a containerized deployment, it’s relatively straightforward to add distributed tracing to your K8s cluster using the Jaeger operator. The Jaeger agent is deployed as a sidecar in each pod. You can specify whether to write traces directly to the database from the collector (production strategy) or stream them via Kafka (streaming strategy).
Sampling rates
Jaeger distributed tracing can add considerable overhead to your application, as trace identifiers are propagated to each sub-request, and the data from each span is then processed and written to storage. Sampling rates reduce processing and storage costs while still collecting a representative sub-set of trace data.
With Jaeger, sampling can either be configured on the client as part of the instrumentation logic or defined centrally and propagated to clients via the agent. The advantage of remote sampling is that you can apply sampling rates consistently across the system and update them easily.
Jaeger distributed tracing supports two forms of remote sampling: file-based and adaptive. With the former, you define sampling rates for each service or operation explicitly using either probability or rate-limiting. With adaptive sampling, Jaeger adjusts the sampling rate dynamically to meet a pre-determined target tracing rate, meaning it can adjust to changes in traffic.
Summary
Jaeger is a cloud-native distributed tracing platform designed to address the challenges of building observability into microservice-based systems. It offers native Kubernetes support via the Kubernetes operator, while support for OpenTelemetry ensures the flexibility to move to other tracing solutions without having to re-instrument your application code.
Kubernetes, a Greek word meaning pilot, has found its way into the center stage of modern software engineering. Its in-built observability, log monitoring, metrics, and self-healing make it an outstanding toolset out of the box, but its core offering has a glaring problem. The Kubernetes logging challenge is its ephemeral resources disappearing into the ether, and without some 2005-style SSHing into the correct server to find the rolled over log files, you’ll never see the log data again.
If your server is destroyed, which is perfectly normal, your logs are scattered to the winds – precious information, trends, insights, and findings are gone forever. And should you get a hold of your logs, pulling them out will place extra stress on the very API that you need to orchestrate your entire application architecture. This situation is not palatable for any organization looking to manage a complex set of microservices. A modern, persistent, reliable, sophisticated Kubernetes logging strategy isn’t just desirable – it’s non-negotiable.
Fortunately, there is a remedy. Creating a production-ready K8s logging architecture is no longer the complex feat of engineering that it once was and by leveraging the innate features of Kubernetes, combined with ubiquitous open source tooling, logs will be safely streamed out into a powerful set of analytics tools, where they can become the cornerstone of your operational success.
This tutorial will walk you step-by-step through the process of setting up a logging solution based on Elasticsearch, Fluend and Kibana.
This article is aimed at users who have some experience with Kubernetes. Before proceeding to the tutorials and explanations, there are some concepts that you should be familiar with. The Kubernetes documentation does an excellent job of explaining each of these ideas. If you don’t recognize any of these terms, it is strongly recommended that you take a minute to read the relevant documentation:
Due to the consistency of Kubernetes, there are only a few high-level approaches to how organizations typically solve the problem of logging. One of these archetype patterns can be found in almost every production-ready Kubernetes cluster.
Straight from the Pod
In this example, logs are pushed directly from a container that lives inside of the pod. This can take the form of the “sidecar” pattern, or the logs can be pushed directly from the “app-container”. This method offers a high degree of flexibility, enabling application-specific configuration for each stream of logs that you’re collecting. The trade-off here, however, is repetition. You’re solving the problem once for a single app, not everywhere.
Collected Asynchronously
The other common approach is to read the logs directly from the server, using an entirely external pod. This pod will aggregate logs for the entire server, ingesting and collecting everything once. This can either be implemented using the somewhat unknown static pod, or more commonly, using the DaemonSet. Here, we take more of a platform view of the problem, ingesting logs for every pod on the server, or in the case of the DaemonSet, every server in the cluster. Alas, we sacrifice the vital flexibility that the previous pattern afforded us.
Types of Kubernetes Logs
Kubernetes is itself software that needs to be monitored. It is tempting to only consider your application logs when you’re monitoring your system, but this would only give you part of the picture. At the simplest level, your application is pushing out log information to standard output.
Your application is running on a node, however, and it is also crucial that these logs are harvested. Misbehavior in your node logs may be the early warning you need that a node is about to die and your applications are about to become unresponsive.
On each of your nodes, there is a kubelet running that acts as sheriff of that server, alongside your container runtime, most commonly Docker. These can not be captured using typical methods since they do not run within the Kubernetes framework but are a part of it.
A crucial and often ignored set of logs are HTTP access logs. It is common practice in a Kubernetes cluster to have a single ingress controller through which all of the inbound cluster traffic flows. This creates a single swimlane that needs to be tightly monitored. Fortunately, these logs are represented as pod logs and can be ingested in much the same way.
Alongside this, there are nodes that are running your control plane components. These components are responsible for the orchestration and management of all of your services. The logs that are generated here include audit logs, OS system level logs, and events. Audit logs are especially important for troubleshooting, to provide a global understanding of the changes that are being applied to your cluster.
Collecting Kubernetes Logs
Log collection in Kubernetes comes in a few different flavors. There is the bare basic solution, offered by Kubernetes out of the box. From there, the road forks and we can take lots of different directions with our software. We will cover the most common approaches, with code and Kubernetes YAML snippets that go from a clear cluster to a well oiled, log collecting machine.
The Basic Approach to Kubernetes Logging
In order to see some logs, we’ll need to deploy an application into our cluster. To keep things simple, we’ll run a basic busybox container with a command to push out one log message a second. This will require some YAML, so first, save the following to a file named busybox.yaml.
apiVersion: v1
kind: Pod
metadata:
 name: counter
spec:
 containers:
 - name: count
   image: busybox
   args: [/bin/sh, -c,
           'i=0; while true; do echo "$i: Hello"; i=$((i+1)); sleep 1; done']
Then, run the following command to deploy this container into your cluster. If you wish to deploy into a specific namespace, be sure to specify it in your command.
kubectl apply -f busybox.yaml
This should deploy almost instantly into your cluster. Reading the logs is then simple:
kubectl logs counter
You should see output that looks something like this:
The standard logging tools within Kubernetes are not production-ready, but that’s not to say they’re lacking in every feature. To see these logs in real-time, a simple switch can be applied to your previous command:
kubectl logs counter -f
The -f switch instructs the CLI to follow the logs, however, it has some limitations. For example, you can’t tail the logs from multiple containers at once. We can also see logs after a given time, using the following command:
Let’s test out how well our logs hold up in an error scenario. First, let’s delete the pod.
kubectl delete -f busybox.yaml
Now let’s try to get those logs again, using the same command as before.
Error from server (NotFound): pods "counter" not found
The logs are no longer accessible because the pod has been destroyed. This gives us some insight into the volatility of the basic Kubernetes log storage. Let’s amend our busybox so that it has trouble starting up.
If we query for the logs this time, we’ll get the logs from the last attempt. We won’t see all of the logs that the pod has printed out since it was deployed. This can be remedied with the -p switch, but we can see quickly that the tool becomes cumbersome with even the most basic of complications. If this were a 3 am, high impact outage, this CLI would quite quickly become a stumbling block. When combined with the volatility of the pod log storage, these examples betray the lack of sophistication in this tooling. Next, we’ll remedy these issues, step by step, by introducing some new concepts and upgrading the logging capabilities of our Kubernetes cluster.
Note: Before proceeding, you should delete the counter pod that you have just made and revert it to the fully working version.
Kubernetes Logging Agent
Logging agents the middlemen of log collection. There is an application that is writing logs and a log collection stack, such as Elasticsearch Kibana Logstash that is analyzing and rendering those logs. Something needs to get the logs from A to B. This is the job of the logging agent.
The advantage of the logging agent is that it decouples this responsibility from the application itself. Instead of having to continuously write boilerplate code for your application, you simply attach a logging agent and watch the magic happen. However, as we will see, this reuse comes at a price, and sometimes, the application-level collection is the best way forward.
Prerequisites
Before proceeding, you should have an Elasticsearch server and a Kibana server that is communicating with one another. This can either be hosted on a cloud provider or, for the purposes of a tutorial, ran locally. If you wish to run them locally, the following file can be used with docker compose to spin up your very own instances:
Write this to a file named docker-compose.yaml and run the following command from the same directory to bring up your new log collection servers:
docker-compose up
They will take some time to spin up, but once they’re in place, you should be able to navigate to https://localhost:5061 and see your fresh Kibana server, ready to go. If you’re using Minikube with this setup (which is likely if Elasticsearch is running locally), you’ll need to know the bound host IP that minikube uses. To find this, run the following command:
This will print out an IP address. This is the IP address of your Elasticsearch server. Keep a note of this, you’ll need it in the next few sections.
As a DaemonSet
This is our first step into a production-ready Kubernetes logging solution. Exciting! When we’ve made it through the following steps, we’ll have Fluentd collecting logs from the server itself and pushing them out to an Elasticsearch cluster that we can view in Kibana.
From YAML
Deploying raw YAML into a Kubernetes cluster is the tried and true method of deploying new software into your environment. It has the advantage of being explicit about the changes you’re about to make to your cluster. Firstly, we’ll need to define our DaemonSet. This will deploy one pod per node in our cluster. There are plenty of great examples and variations that you can play within the fluent github repository. For the sake of ease, we’ll pick a simple example to run with:
apiVersion: apps/v1
kind: DaemonSet
metadata:
 name: fluentd
 namespace: kube-system
 labels:
   k8s-app: fluentd-logging
   version: v1
spec:
 selector:
   matchLabels:
     k8s-app: fluentd-logging
     version: v1
 template:
   metadata:
     labels:
       k8s-app: fluentd-logging # This label will help group your daemonset pods
       version: v1
   spec:
     tolerations:
     - key: node-role.kubernetes.io/master
       effect: NoSchedule # This will ensure fluentd collects master logs too
     containers:
     - name: fluentd
       image: fluent/fluentd-kubernetes-daemonset:v1-debian-elasticsearch
       env:
         - name:  FLUENT_ELASTICSEARCH_HOST
           value: "localhost" # Or the host of your elasticsearch server
         - name:  FLUENT_ELASTICSEARCH_PORT
           value: "9200" # The port that your elasticsearch API is exposed on
         - name: FLUENT_ELASTICSEARCH_SCHEME
           value: "http" # Either HTTP or HTTPS.
         - name: FLUENT_ELASTICSEARCH_USER
           value: "elastic" # The username you've set up for elasticsearch
         - name: FLUENT_ELASTICSEARCH_PASSWORD
           value: "changeme" # The password you've got. These are the defaults.
       resources:
         limits:
           memory: 200Mi
         requests:
           cpu: 100m
           memory: 200Mi
       volumeMounts:
       - name: varlog
         mountPath: /var/log
       - name: varlibdockercontainers
         mountPath: /var/lib/docker/containers
         readOnly: true
     terminationGracePeriodSeconds: 30
     volumes:
     - name: varlog
       hostPath:
         path: /var/log
     - name: varlibdockercontainers
       hostPath:
         path: /var/lib/docker/containers
Save this to a file named fluentd-daemonset.yaml and deploy it to your cluster using the following command:
kubectl apply -f fluentd-daemonset.yaml
Then, you can monitor the pod status with the following command:
kubectl get pods -n kube-system
Eventually, you’ll see the pod become healthy and the entry in the list of pods will look like this:
fluentd-4d566 1/1 Running 0 2m22s
At this point, we’ve deployed a DaemonSet and we’ve pointed it at our Elasticsearch server. We now need to deploy our counter back into the cluster.
kubectl apply -f busybox.yaml
From here, we can see what our cluster is pushing out. Open up your browser and navigate to https://localhost:5601. You should see a dashboard and on the left-hand side, a menu. The discover icon is a compass and it’s the first one on the list. Click on that and you’ll be taken to a page, listing out your indices.
Here, you’ll need to create an index pattern. An index pattern simply groups indices together. You can see that Fluentd has kindly followed a Logstash format for you, so create the index logstash-* to capture the logs coming out from your cluster.
In the next window, select @timestamp as your time filter field. You’ll notice that you didn’t need to put this in your application logs, Fluentd docker did this for you! You’ve just gained a really great benefit from Fluentd. Your application didn’t care about its log format. Your logging agent just captured that and made it compatible, without any extra effort from you.
Create your index pattern and let’s explore the next screen a little bit. You’ll notice that there are lots of fields in this index. That’s because Fluentd didn’t just add a @timestamp for you, it also added a bunch of extra fields that you can use as dimensions on which to query your logs.
One example is kubernetes.pod_name. We’re now going to use this to hunt down the logs from our counter app, which is faithfully running in the background. Head back to the discover screen (the compass icon on the left) and in the search bar at the top of the screen, enter the following:
kubernetes.pod_name.keyword: counter
The logs from your counter application should spring up on the screen.
So thanks to your clever use of Fluentd, you’ve just taken your cluster from volatile, unstable log storage, all the way through to external, reliable and very searchable log storage. We can even visualize our logs, using the power of Kibana:
Explore these labels, they are immensely powerful and require no configuration. You can query all sorts of dimensions, such as namespace or host server. If you like the open source Kibana but need ML-powered alerting, tools like Coralogix offer an even greater level of sophistication that can help you get the most of your K8s log data.
From Helm
Helm hides away much of the complex YAML that you find yourself stuck with when rolling out changes to a Kubernetes cluster. Instead of a complex list of different resources, Helm provides production-ready deployments with a single configuration file to tweak the parameters you want. First, let’s remove our DaemonSet from Kubernetes. Don’t worry, because we have the YAML file, we can reinstall it whenever we want.
kubectl delete -f fluentd-daemonset.yaml
Next, we’ll create our very own fluentd-daemonset-values.yaml file. This values file contains the configuration that we can use for a Helm chart. Paste in the following values:
elasticsearch:
   hosts: ["10.0.2.2:9200"]
Then, you’ve got two commands to run. The first links up to your local Helm CLI with the repository that holds the Fluentd Helm chart:
helm repo add kiwigrid https://kiwigrid.github.io
The next one will actually install Fluentd into your cluster. You’re going to notice a lot more resources are created. This is the power of Helm – abstracting away all of the inner details of your deployment, in much the same way that Maven or NPM operates. Our first example got something working, but this Helm chart will include many production-ready configurations, such as RBAC permissions to prevent your pods from being deployed with god powers.
This command is a little longer, but it’s quite straight forward. We’re instructing Helm to create a new installation, fluentd-logging, and we’re telling it the chart to use, kiwigrid/fluentd-elasticsearch. Finally, we’re telling it to use our configuration file in which we have specified the location of our Elasticsearch cluster. Navigate back to Kibana and logs have started flowing again.
But there are no credentials!
The Helm chart assumes an unauthenticated Elasticsearch by default. While this sounds crazy, if the Elasticsearch instance is hidden behind networking rules, many organizations deem this secure enough. However, we’ll do the job properly and finish this off. We first need to create a secret to hold our credentials. My secret is using the default Elasticsearch credentials, but you can craft yours as needed – the key part is to keep the keys and secret names the same. Create a file named credentials-secret.yaml and paste this inside:
You’ll see now that the file is referring out to an existing secret, rather than holding credentials in plaintext (or, not at all, like before). Additionally, authentication has now been enabled in the Helm chart. This means your Fluentd instance is now communicating with your Elasticsearch using a username and password.
The advantage of a DaemonSet
So now you’ve got your logs, but there is another perk that we haven’t touched on yet. That is the power of a DaemonSet. From now on, any new pod on every server is going to be aggregated. We can test this. Create a new file, busybox-2.yaml and add the following content to it:
apiVersion: v1
kind: Pod
metadata:
name: counter-2
labels:
   app: counter-2
spec:
containers:
- name: count
  image: busybox
  args: [/bin/sh, -c,
          'i=0; while true; do echo "$i: Hello from pod 2"; i=$((i+1)); sleep 1; done']
Run the following command to deploy this new counter into our cluster:
kubectl apply -f busybox-2.yaml
That’s it. Head back to your Kibana instance and, this time, search for logs coming from the default namespace:
kubernetes.namespace_name.keyword: "default"
And you’ll see logs from both of your pods. No additional configuration or work needed. Your app started logging and Fluentd started collecting. Now imagine if you’ve got servers spinning up and closing down every hour, hundreds of nodes popping in and out of service. This creates a very scalable model for collecting logs.
This is a very powerful tool, but that automatic log collection creates complications. Sooner or later, a special case will pop up. Even the best rules have exceptions, and without a provision to put special cases into your cluster, you’re likely to run into some trouble. You’ll need a second option. For this, we can implement a sidecar.
As a SideCar
Sidecars have fallen out of favor of late. You will still find examples of them floating around but the ease and scalability of DaemonSets have continually won out. A sidecar pod is often a wasteful allocation of resources, effectively doubling the number of pods that your cluster needs to run, in order to surface the logs.
There are some edge cases for using a sidecar. For example, some open-source software will not write to standard out but instead to a local file. This file needs to be picked up and handled separately.
Yet, even this can be restricting. Dynamic properties on logs, small optimizations, computed fields. Sometimes, our logging logic can become so complex that we need access to a much more sophisticated programming capability. As our last port of call, we can bring everything up to the application level.
Push logs directly to a backend from within an application.
Application-level logging is rapidly falling out of favor, especially in Kubernetes clusters. It is recommended to try and keep as much of this logic out of your application code as possible so that your code most succinctly reflects the business problems that you are trying to solve.
It is very difficult to write a tutorial for this since it highly depends on the application level code you’re writing, so instead, it is best to give a few common problems and challenges to look out for:
Separation of concerns is crucial here. You do not want your business logic polluted with random invocations of the Elasticsearch API. Instead, abstract this behind a service and try to make some semantic method names that describe what you’re doing.
Rate limiting from the Elasticsearch API will happen if your application is too busy. Many libraries offer automatic retry functionality, but this can often make things worse. Error handling, retry and exponential back-off logic will become crucial at scale.
Backing up log messages during an Elasticsearch outage is vital. Backfilling log messages that are held on disk creates a property of eventual consistency with your logs, which is far superior to large gaps in important information, such as audit data.
These problems are covered for you by bringing in a logging agent and should be strongly considered over including such low-level detail in your application code. The aim should be to solve the problem once for everything and we should pathologically avoid reinventing the wheel.
Transforming your Logs
Logs are an incredibly flexible method of producing information about the state of your system. Alas, with flexibility comes the room for error and this needs to be accounted for. We can filter out specific fields from our application logs, or we can add additional tags that we’d like to include in our log messages.
By including these transformations in our logging agents, we are once again abstracting low-level details from our application code and creating a much more pleasant codebase to work with. Let’s update our fluentd-daemonset-values.yaml to overwrite the input configuration. You’ll notice that this increases the size of the file quite a bit. This is an unfortunate side effect of using the Helm chart, but it is still one of the easiest ways to make this change in an automated way:
elasticsearch:
hosts: ["10.0.2.2:9200"]
configMaps:
useDefaults:
containersInputConf: false
extraConfigMaps:
containers.input.conf: |-
@id fluentd-containers.log
@type tail
path /var/log/containers/*.log
pos_file /var/log/containers.log.pos
tag raw.kubernetes.*
read_from_head true
@type multi_format
format json
time_key time
time_format %Y-%m-%dT%H:%M:%S.%NZ
format /^(?
# Detect exceptions in the log output and forward them as one log entry.
@id raw.kubernetes
@type detect_exceptions
remove_tag_prefix raw
message log
stream stream
multiline_flush_interval 5
max_bytes 500000
max_lines 1000
# Concatenate multi-line logs
@id filter_concat
@type concat
key message
multiline_end_regexp /n$/
separator ""
timeout_label @NORMAL
flush_interval 5
# Enriches records with Kubernetes metadata
@id filter_kubernetes_metadata
@type kubernetes_metadata
# This is what we've added in. The rest is default.
@type record_transformer
hello "world"
# Fixes json fields in Elasticsearch
@id filter_parser
@type parser
key_name log
reserve_time true
reserve_data true
remove_key_name_field true
@type multi_format
format json
format none
Now go to Elasticsearch and look for the logs from your counter app one more time. If you inspect one of the documents, you should see a brand new field.
Notice the exclamation mark next to world there? That means the field has not been indexed and you won’t be able to search on it yet. Navigate to the settings section (the cog in the bottom left of the page) and bring up your Logstash index that you created before.
In the top left, we can see the refresh icon. This button will automatically index new fields that are found on our logs. Click this and confirm. If you search for your new field, it should appear in the search result:
This is a very basic feature but it illustrates the power of this mechanism. We could, for example, remove the password field from any logs, or we could delete any logs that contain the word password. This creates a basic layer of security on which your applications can sit and further reduces the worries of the engineers who are building the application code.
A word of warning
To make even a small change to the Fluentd config, as you have seen, requires a much more complex values file for your Helm chart. The more logic that you push into this file, the more complex and unmaintainable this file is going to become. There are a few things you can do to mitigate this, such as merging multiple Helm values files, but it is something of a losing battle. Use this functionality sparingly and when it is most effective, to maintain a balance between a sophisticated log configuration and a complex, hidden layer of rules that can sometimes mean mysteriously lost logs or missing fields.
Helm or simple YAML?
At scale, almost all major Kubernetes clusters end up abstracting the raw YAML in one way or another. It simply doesn’t work to have hundreds of YAML files that are floating about in the ether. The temptation to copy and paste, often spreading the same errors across dozens of files, is far too strong.
Helm is one way of abstracting the YAML files behind a Helm chart and it certainly makes for a more straightforward user experience. There are some other games in town, such as FluxCD, that can offer a similar service (and quite a bit more), so investigate the various options that are at your disposal.
The question comes down to scale and maintainability. If you expect more and more complexity, it’s wise to start baking in scalability into your solutions now. If you’re confident that things are going to remain simple, don’t over-invest. Helm is great but it comes with its own complexities, such as very specific upgrade and rollback rules.
Working Examples
So now we’ve got some logs flowing into our Elasticsearch cluster. What can we do with them? Here, we’ll work through some examples of how we can use the logs to fulfill some common requirements.
Monitoring ETCD
ETCD is the distributed database that underpins Kubernetes. It often works behind the scenes and many organizations that are making great use of Kubernetes are not monitoring their ETCD databases to ensure nothing untoward is happening. We can prevent this with a bit of basic monitoring, for example, tracking the frequency of ETCD compaction.
Compaction of its keyspace is something that ETCD does at regular intervals to ensure that it can maintain performance. We can easily use the logs as the engine behind our monitoring for this functionality. Navigate into Elasticsearch and click on the Visualise button on the left-hand side of the screen.
Create a new visualization, select your Logstash index, and add the following into the search bar at the top of the query. This is Lucene syntax and it will pull out the logs that indicate a successful run of the ETCD scheduled compaction:
kubernetes.labels.component.keyword: "etcd" and message.keyword: *finished scheduled compaction*
Next, on the left-hand side, we’ll need to add a new X-axis to our graph.
Click on X-axis and select the Date Histogram option. Elasticsearch will automatically select the @timestamp field for you. Simply click on the blue Run button just above and you should see a lovely, saw-tooth shape in your graph:
This is a powerful insight into a low-level process that would normally go hidden. We could use this and many other graphs like it to form a full, ETCD monitoring board, driven by the many different log messages that we’re ingesting from ETCD.
Maintenance
Okay, so you have your logs, but how do you prune them down? How do you decide how long to keep those logs for? We’ll iron out these weaknesses and add the finishing touches to your log collection solution and we’ll do this in the same production-quality, the secure way we’ve been doing everything else. No corners cut.
Log Pruning
This is a problem as old as logging itself. As soon as you’re bringing all of those logs into one place, be it a file on a server or a time-series database like Elasticsearch, you’re going to run out of space sooner or later. There needs to be a decision on how long you keep those logs for and what to do with them when you’re done.
Elasticsearch Curator
The simple answer is to clear out old logs. A typical period to hold onto logs is a few weeks, although given some of your constraints, you might want to retain them for longer. Elasticsearch can hold huge volumes of data, but even such a highly optimized tool has its limits. Thanks to Kubernetes and Helm, deploying your curator is trivial.
First, let’s create ourselves a YAML file, curator-values.yaml and put the following content inside:
configMaps:
   config_yml: |-
       ---
       client:
       hosts:
           - 10.0.2.2 # Or the IP of your elasticsearch cluster.
       port: 9200
       http_auth: elastic:changeme # These are default. Set to your own.
   action_file_yml: |-
       ---
       actions:
           1:
           action: delete_indices
           description: "Clean up ES by deleting old indices"
           options:
               timeout_override:
               continue_if_exception: False
               disable_action: False
               ignore_empty_list: True
           filters:
           - filtertype: age
               source: name
               direction: older
               timestring: '%Y.%m.%d'
               unit: days
               unit_count: 7
               field:
               stats_result:
               epoch:
               exclude: False
This contains some important details. We can see in the config_yml property that we’re setting up the host and the credentials. Those of you who are security-minded will be glaring at the plaintext username and password, but not to worry, we’ll fix that in a moment.
The filters section is where the action is. This will delete indices in Elasticsearch that are older than 7 days, effectively meaning that you always have a week of logs available to you. For systems of a sufficient scale, this is a great deal of information. If you need more, it might be worth investigating some managed ELK options that take some of the headaches away for you.
Deploying this is the same as any other Helm chart:
You can then view the CronJob pod in your Kubernetes cluster.
NAME                            SCHEDULE    SUSPEND   ACTIVE   LAST SCHEDULE   AGE
curator-elasticsearch-curator   0 1 * * *   False     0                  33s
This job will run every day and clear out logs that are more than seven days old, giving you a sliding window of useful information that you can make use of.
Hiding those credentials
Our secret is in place from our previous work with Fluentd, so all you need to do is instruct the Helm chart to use this secret to populate some environment variables for you. To do this, you need to add a new property into the Helm chart envFromSecrets.
This is a feature of the curator Helm chart that instructs it to read the value of an environment variable from the value stored in a given secret and you’ll notice the syntax is slightly different from the Fluentd helm chart. The functionality is much the same, but the implementation is subtly different.
Now, we’ve only got one more final step. We need to instruct Curator to read these environment variables into the config. To do this, replace the entire contents of your curator-values.yaml with the following:
envFromSecrets:
   ES_USERNAME:
       from:
         secret: es-credentials
         key: 'ES_USERNAME'
   ES_PASSWORD:
       from:
         secret: es-credentials
         key: 'ES_PASSWORD'
configMaps:
config_yml: |-
---
client:
hosts:
- 10.0.2.2
port: 9200
http_auth: ${ES_USERNAME}:${ES_PASSWORD}
action_file_yml: |-
---
actions:
1:
action: delete_indices
description: "Clean up ES by deleting old indices"
options:
continue_if_exception: False
disable_action: False
ignore_empty_list: True
filters:
- filtertype: age
source: name
direction: older
timestring: '%Y.%m.%d'
unit: days
unit_count: 7
exclude: False
Now, the credentials don’t appear anywhere in this file. You can hide the secret file away somewhere else and control access to those secrets using RBAC.
Conclusion
Over the course of this article, we have stepped through the different approaches to pulling logs out of a Kubernetes cluster and rendering them in a malleable, queryable fashion. We have looked at the various problems that arise from not approaching this problem with a platform mindset and the power and scalability that you gain when you do.
Kubernetes is set to stay and, despite some of the weaknesses of its toolset, it is a truly remarkable framework in which to deploy and monitor your microservices. When combined with a sophisticated, flexible log collection solution, it becomes a force to be reckoned with. For a much smoother approach to Kubernetes logging, give Coralogix a spin and get all the (human) help you need 24/7 to manage your logs.
It’s impossible to ignore AWS service monitoring as a major player in the public cloud space. With $13.5 billion in revenue in the first quarter of 2021 alone, Amazon’s biggest earner is ubiquitous in the technology world. Its success can be attributed to the wide variety of services available, which are rapidly developed to match industry trends and requirements.
One service that keeps AWS ahead of the game is EKS or AWS’s monitoring tool Elastic Kubernetes Service. With customers from Snap Inc to HSBC, EKS is the most mature of the public cloud providers’ managed Kubernetes services. However, as we’ve said before, Kubernetes monitoring can be tricky. Add an extra layer of managed services to that, as with EKS, and it becomes more complex. Fortunately, at Coralogix, we’re the experts on observability and monitoring. Read on for our take on EKS and what you should be monitoring.
What is EKS? An overview
Launched in June 2018, AWS took the open-source Kubernetes project and promised to handle the control plane, leaving the nodes in the hands of the customers. Both Google’s GKE and Azure’s AKS do the same.
Of the three Kubernetes services, EKS has the fewest out-of-the-box features but favors the many organizations with pre-existing AWS infrastructure. For this reason, no doubt, EKS remains the most popular Kubernetes service.
EKS Architecture
As with any Kubernetes deployment, there are two main components in EKS – the control plane and the nodes/clusters. As mentioned, AWS runs the control plane for you, allowing your DevOps teams to focus on the nodes and clusters.
Whilst you can have the typical container compute and storage layer, or data fabric, EKS can also run on AWS Fargate. Fargate is basically AWS Lambda but for containers.
So then, EKS monitoring needs to focus on three main things. The Kubernetes objects, such as the control plane and nodes, the usage of these objects, and the underlying services that support or integrate with EKS.
Monitoring EKS Objects
So, we’ve covered what makes up a standard EKS deployment. Now, we’re going to examine some key metrics that need to be monitored within EKS. This focuses on health and availability, not usage (as we’ll get onto that later).
Cluster Status
There are a variety of cluster status metrics available on EKS which come from the Kubernetes API Server. We’ll examine the most important ones below.
Node Status
Monitoring the node status is one of the most important aspects of EKS monitoring. It returns a detailed health check on the availability and viability of your nodes. Node status will let you know if your node is ready to accept pods. It will also let you know if the node has enough disk space or is resource-constrained, which is useful for understanding whether there are too many processes running on a given node.
These metrics can be requested ad hoc, or by the configuration of heartbeats. Heartbeats are, as standard, configured to 40-second intervals. However, this may be too long for mission-critical clusters and can be altered for sub-second data insights.
Pod Status
In Kubernetes, you can describe your deployment declaratively. This can include the number of pods you wish to be running at any given point, which is likely to be contingent on both resource availability and workload requirements.
By inspecting and monitoring the delta between desired pods running, and actual pods running, you can diagnose a range of issues. If your nodes aren’t able to launch the number of pods that you’re looking for, it may point to underlying resource problems.
Control Plane Status
If AWS is running and managing the control plane, then why would you waste your time monitoring it? Simply put, the performance of the underlying control plane is going to be critical to the success and health of your Kubernetes deployment, whether you’re responsible for it or not.
Performance and Latency
Monitoring metrics like ‘apiserver_request_latencies_sum’ will give you the overall processing time on the Kubernetes API server. This is useful for understanding the performance of the control plane, and what the connectivity is like with your cluster.
You can also examine the latency from the controller to understand network constraints that might be affecting the relationship between the EKS cluster and the control plane.
Monitoring Resources for EKS
When talking about resources relevant to EKS, we are most interested in storage and compute or CPU availability. Specifically, this is likely to be EBS volumes and EC2 instances.
Memory and Disk
As one of the key resources for EKS, you must monitor several key memory-related metrics produced by Kubernetes.
Utilization
Memory utilization, or over-utilization, can be a big performance bottleneck for EKS. If a pod exceeds its predefined memory usage limit, then it will be killed by the node. Whilst this is good for resource management and workload balancing, if this happens frequently it could be harmful to your cluster overall.
Requests
When a new container is deployed, it will request a default allocation of memory if this is not already defined. The memory requests per node must not exceed the allocated memory per node, or your nodes will start killing off individual pods.
Disk
If a node is running with low available disk space, then the node will not be able to create new pods. Metrics such as ‘nodefs.available’ will give you the amount of available disk for a given node, to ensure you have adequate resources and aren’t preventing new pods from being deployed.
CPU
The other important resource aspect for EKS is the CPU. This is typically supplied by EC2 worker nodes.
Utilization
Similarly to the memory above, EKS requires the CPU allocated per core to always be more than the CPU in use. By monitoring CPU usage between nodes, you can look for performance bottlenecks, underresourced nodes, and process efficiencies.
Monitoring Services for EKS
The last piece of the EKS monitoring puzzle is the various AWS services used to underpin any EKS deployment. We’ve touched on some of them above, but we’ll go on to discuss why it’s important to look at them and what you should be looking out for.
EC2
In an EKS deployment, your worker nodes are EC2 instances. Monitoring their capacity and performance is critical because it underpins the health and capacity of your Kubernetes clusters. We’ve already touched on CPU monitoring above, but so far have focused on the Kubernetes API server-side. For best practice, monitor both the EC2 instances and the CPU performance on the API server.
EBS
If EC2 instances are the CPU, then EBS volumes are the memory aspect. EBS volumes provide the persistent volume storage required for EKS deployments. Monitoring throughput and IOPs of EBS volumes are critical in understanding if your storage layer is causing bottlenecks. Because AWS throttle EBS volume IOPs, poor performance, or high latency could indicate that you have not provisioned adequate IOPs per volume for your workload.
Fargate
As mentioned above, Fargate is the serverless service for containers in AWS. Fargate has a completely separate set of metrics for both the Kubernetes Server API and other AWS services. However, there are some parities to look out for, such as memory utilization, allocated CPU, and others. Fargate runs on a task basis, so monitoring it directly will give you an idea of the success of your tasks and therefore an understanding of the health of your EKS deployment.
Load Balancers
AWS has the option of either an Elastic Load Balancer or Network Load Balancer, with the former being the default option. Load balancers form the interface between your containers and any web or web application layer. Monitoring load balancers for latency is a great way of rooting out network and connectivity issues and catching problems before they reach your user base.
Observability for EKS
As we know, monitoring and observability are not the same things. In this article, we have discussed what you need to be monitoring, but not necessarily how that boosts observability. AWS does provide Container Insights as part of Cloudwatch, but it hasn’t been well received in the market.
That’s where Coralogix comes in.
The power of observability is reviewing metrics from across your system with context from disparate data sources. The Coralogix integration with Fluentd gives you insights straight from the Kubernetes API server. What’s more, you can cross-compare data with the AWS Status Log in real-time, ensuring that you know of any issues arising with the organizations you’re entrusting with the hosting of your control plane. You can integrate Coralogix with your load balancer and even with Cloudwatch, and then view all of this data in a dashboard of your choice.
So, EKS is complicated. But monitoring it doesn’t need to be. Coralogix has helped enterprises and startups across the world with their Kubernetes observability challenges, so we have seen it all.
Observability is one of the most popular topics in technology at the moment, and that isn’t showing any sign of changing soon. Agentless log collection, automated analysis, and machine learning insights are all features and tools that organizations are investigating to optimize their systems’ observability. However, there is a new kid on the block that has been gaining traction at conferences and online: the Extended Berkeley Packet Filter, or eBPF. So, what is eBPF?
Let’s take a deep dive into some of the hype around eBPF, why people are so excited about it, and how best to apply it to your observability platform.
What came out of Cloud Week 2021?
Cloud Week, for the uninitiated, is a week-long series of talks and events where major cloud service providers (CSPs) and users get together and discuss hot topics of the day. It’s an opportunity for vendors to showcase new features and releases, but this year observability stole the show.
Application Performance Monitoring
Application Performance Monitoring, or APM, is not particularly new when it comes to observability. However, Cloud Week brought a new perception of APM: using it for infrastructure. Putting both applications and infrastructure under the APM umbrella in your observability approach not only streamlines operations but also gives you top-to-bottom observability for your stack.
Central Federated Observability
Whilst we at Coralogix have been enabling centralized and federated observability for some time (just look at our data visualization and cloud integration options), it was a big discussion topic at Cloud Week. Federated observability is vital for things like multi-cloud management and cluster management, and centralizing this just underpins one of the core tenets of observability. Simple, right?
eBPF
Now, not to steal the show, but eBPF was a big hit at Cloud Week 2021. This is because its traditional use (in security engineering) has been reimagined and reimplemented to address gaps in observability. We’ll dig deeper into what eBPF is later on!
What is eBPF – an Overview and Short History
Around 2007, the Berkeley Packet Filter (BPF) was designed to filter network packets and collect those packets based on predetermined rules. The filters took the form of programs that then run on a standard VM. However, the BPF quickly became outdated by the progression to 64-bit processors. So what is eBPF and how is it different?
It wasn’t until 2014 that the eBPF was introduced. eBPF is aligned to modern hardware standards (64-bit registers). It’s a Linux kernel technology (version 4.x and above) and allows you to bridge traditional observability and security gaps. It does this by allowing programs that assist with security and/or monitoring to continue running without having to alter the kernel source code or debug, essentially by running a virtual machine inside the kernel.
Where can you use eBPF?
As we’ve covered, eBPF isn’t brand new, but it is fairly nuanced when applied to a complex observability scenario.
Network Observability
Network observability is fundamental for any organization seeking total system observability. Traditionally, network or SRE teams would have to deploy myriad data collection tools and agents. This is because, in complex infrastructure, organizations will likely have a variety of on-premise and cloud servers from different vendors, with different code levels and operating systems for virtual machines and containers. Therefore, every variation could need a different monitoring agent.
Implementing eBPF does away with these complexities. By installing a program at a kernel level, network and SRE teams would have total visibility of all network operations of everything running on that particular server.
Kubernetes Observability
Kubernetes presents an interesting problem for observability, because of the number of kernels with different operating systems that you might be running across your system. As mentioned above, this makes monitoring things like their network usage and requirements exceptionally difficult. Fortunately, there are several eBPF applications to make Kubernetes observability a lot easier.
Dynamic Network Control
At the start, we discussed how eBPF uses predetermined rules to monitor and trace things like network performance. Combine this with network observability above, and we can see how this makes life a lot simpler. However, these rules are still constants (until they’re manually changed), which can make your system slow to react to network changes.
Cilium is an open-source project that seeks to help with the more arduous side of eBPF administration: rule management. On a packet-by-packet basis, Cilium can analyze network traffic usage and requirements and automatically adjust the eBPF rules to accommodate container-level workload requirements.
Pod-level Network Usage
eBPF can be used to carry out socket filtering at the cgroup level. So, by installing an eBPF program that monitors pod-level statistics, you can get granular information that would only normally be accessible in the /sys Linux directory. Because the eBPF program has kernel access, it can deliver more accurate information with context from the kernel.
What is eBPF best at – the Pros and Cons of eBPF for Observability
So far, we’ve explored what eBPF is and what it can mean for your system observability. Sure, it can be a great tool when utilized in the right way, but that doesn’t mean it’s without its drawbacks.
Pro: Unintrusive
eBPF is a very light touch tool for monitoring anything that runs with a Linux kernel. Whilst the eBPF program sits within the kernel, it doesn’t alter any source code which makes it a great companion for exfiltrating monitoring data and for debugging. What eBPF is great at is enabling clientless monitoring across complex systems.
Pro: Secure
As above, because an eBPF program doesn’t alter the kernel at all, you can preserve your access management rules for code-level changes. The alternative is using a kernel module, which brings with it a raft of security concerns. Additionally, eBPF programs have a verification phase that prevents resources from being over-utilized.
Pro: Centralized
Using an eBPF program gives you monitoring and tracing standards with more granular detail and kernel context than other options. This can easily be exported into the user space and ingested by an observability platform for visualization.
Con: It’s very new
Whilst eBPF has been around since 2017, it certainly isn’t battle-tested for more complex requirements like cgroup level port filtering across millions of pods. Whilst this is an aspiration for the open-source project, there is still some work to go.
Con: Linux restrictions
eBPF is only available on the newer version of Linux kernels, which could be prohibitive for an organization that is a little behind on version updates. If you aren’t running Linux kernels, then eBPF simply isn’t for you.
Conclusion – eBPF and Observability
There’s no denying that eBPF is a powerful tool, and has been described as a “Linux superpower.” Whilst some big organizations like Netflix have deployed it across their estate, others still show hesitancy due to the infancy and complexity of the tool. eBPF certainly has applications beyond those listed in this article, and new uses are still being discovered.
One thing’s for certain, though. If you want to explore how you can supercharge your observability and security, with or without tools like eBPF, then look to Coralogix. Not only are we trusted by enterprises across the world, but our cloud and platform-agnostic solution has a range of plugins and ingest features designed to handle whatever your system throws at it.
The world of observability is only going to get more complex and crowded as tools such as eBPF come along. Coralogix offers simplicity.
Since Google first introduced Kubernetes, it’s become one of the most popular DevOps platforms on the market.
Unfortunately, increasingly widespread usage has made Kubernetes a growing target for hackers. To illustrate the scale of the problem, a Stackrox report found that over 90% of respondents had experienced some form of security breach in 2020. These breaches were due primarily to poorly-implemented Kubernetes security.
This is such a serious problem it is even slowing the pace of innovation. Businesses are struggling to find people with the right Kubernetes skills to tackle security issues.
The way we see it, making Kubernetes secure is part of a wider conversation around integrating cybersecurity into DevOps practice. We’ve previously talked about how organizations are embracing DevSecOps as a way of baking security into DevOps.
Kubernetes security is really about taking those insights and applying them to Kubernetes systems.
1. Kubernetes Role-Based Access Control for Security
Many IT systems enhance security by giving different access rights to different levels of users. Kubernetes is no exception. RBAC Authorization (Role Based Access Control)allows you to control who can access your Kubernetes cluster. This reduces the possibility of an unauthorized third party stealing sensitive information.
RBAC can be easily enabled with a Kubernetes command that includes ‘RBAC’ in its authorization mode flags. For example:
The Kubernetes API allows you to specify the access rights to a cluster using four special-purpose objects.
ClusterRole and Role
These two objects define access permissions through sets of rules. The ClusterRole object can define these rules over your whole Kubernetes cluster. A typical ClusterRole might look like this.
apiVersion:rbac.authorization.k8s.io/v1kind:ClusterRolemetadata:# "namespace" omitted since ClusterRoles are not namespacedname:secret-readerrules:- apiGroups:[""]## at the HTTP level, the name of the resource for accessing Secret# objects is "secrets"resources:["secrets"]verbs:["get","watch","list"]
ClusterRoles are useful for granting access to nodes, the basic computational units of clusters. They are also useful when you want to specify permissions for resources such as pods without specifying a namespace.
In contrast, the Role object is scoped to particular namespaces, virtual clusters that are contained within your cluster. An example Role might look something like this.
apiVersion:rbac.authorization.k8s.io/v1kind:Rolemetadata:namespace:my-namespacename:pod-readerrules:- apiGroups:[""]# "" indicates the core API groupresources:["pods"]verbs:["get","watch","list"]
Roles are useful when you want to define permissions for particular namespaces.
ClusterRoleBinding and RoleBinding
These two objects can take the permissions defined in a Role/ClusterRole and grant them to particular groups of users. In these objects, the users, called subjects) are linked to the Role through a reference called RoleRef, similar to how your contacts can be grouped into “work” or “home”.
ClusterRoleBinding gives the permissions for a specific role to a group of users across an entire cluster. To enhance security, RoleRef is immutable. Once ClusterRoleBinding has granted a group of users a particular role, that role can’t be swapped out for a different role without creating a new ClusterRoleBinding.
Kubernetes Pod Security
Kubernetes also lets you specify permissions for pods, which sit on top of clusters and contain your application. Through the use of Kubernetes security contexts, you can define access privileges with Policies.
Policies come in three flavors. Privileged is the most permissive policy. It’s useful if you’re an admin. After this comes Baseline. This has minimal restrictions and is appropriate for trusted users who aren’t admins.
Restricted is the most restricted policy. With security features such as disallowing containers from running non-root, it’s adapted for maximal pod-hardening. Restricted should be used for applications where Kubernetes security is critical.
2. Kubernetes Security Monitoring and Logging
Malicious actors often betray themselves through their effects on the systems they’re trying to penetrate. Looking out for anomalous changes in web traffic or CPU usage can alert you to a security breach in time for you to stop it before it does any real damage.
To track these kinds of metrics successfully, you need really good monitoring and logging. That’s where Coralogix comes in handy. You can use FluentD to integrate Coralogix logging into your Kubernetes cluster.
This lets you leverage the power of machine learning to extract insights and trends from your logs. Machine learning allows computers to detect patterns in large datasets. With this tool, Coralogix can use your logs to identify behavior that shows a divergence from the norm in the future.
In the context of Kubernetes security, this predictive capability can allow you to spot a potential data breach before it happens. The benefits this brings to cybersecurity can’t be overstated.
Additionally, the Coralogix Kubernetes Operator enables you to configure Coralogix to do just what you need for Kubernetes security.
3. Kubernetes Service Meshes
In a previous post, we discussed the changing landscape of network security. In the early 2000s, most websites used 3-tier architectures which were vulnerable to attacks. The advent of containerized solutions like Kubernetes has increased security but required novel solutions to scale applications in a security-friendly way. Luckily, we’ve got Kubernetes service meshes to help with this.
A service mesh works to decouple security concerns from the particular application you happen to be running. Instead, security is handed off to the infrastructure layer through the use of a sidecar. One capability a service mesh has is encrypting traffic in a cluster. This prevents hackers from intercepting traffic, lowering the risk of data breaches.
In Kubernetes, service meshes typically integrate through the service mesh interface. This is a standard interface that provides features for the most common use cases, including security.
Service meshes can also help with observability. Observability, in this case, involves seeing how traffic flows between services. We’ve previously covered service meshes in the context of observability and monitoring more in-depth.
4. Kubernetes Security in the Cloud
Due to the popularity of cloud-based solutions, many organizations are opting for cloud-native Kubernetes. Cloud-native security splits into four layers. Going from the bottom up these are cloud, cluster, container, and code.
We’ve already talked about cluster and container security earlier in this article, so let’s discuss cloud and code.
Cloud security is contingent on the security of whichever cloud provider you happen to be using. Kubernetes recommends you read their documentation to understand how good their security is.
Code security, by contrast, is an area where you can take a lot of initiative. A running Kubernetes application is a primary attack surface for potential hackers to exploit. Because your development team writes the application code, there’s plenty of opportunities to implement good security features.
For example, if you’re using third-party libraries, you should scan them for potential security vulnerabilities to avoid being caught off guard. It’s also good to make sure your application has as few ports exposed as possible. This limits the effective attack surface of your system, making it harder for malicious actors to penetrate.
5. Kubernetes Security Through Containerization Best Practices
Kubernetes is founded on the concept of containerization. Systems like Docker wrap your application in layers of containers, which perform the role of a traditional server, but without any complex setup and configuration.
Trouble with Docker
When containerization isn’t done properly, Kubernetes security can be seriously compromised. Let’s look at Docker, for example. Docker applications are made of layers. This means they are constructed a bit like a pastry. The innermost layer provides for basic language support while successive layers, or images, add functionality.
Because each Docker layer is maintained in a Docker Hub and under the control of a central repository owner, there is nothing to stop the inner layer from changing without warning. In the worst case, a Docker image can be intentionally modified by a hacker trying to cause a Kubernetes security breach.
Docker Image Fixes
The problem of Docker layers changing can be solved by changing how Docker layers are tagged. Each Docker layer normally has a latest tag, signifying it is the most recent update in Docker Hub. It’s possible to swap out latest for a version-specific tag like node:14.5.0. With this, you can stop the inner layers from changing and guarantee security for your application.
Alternatively, there are third-party tools such as Clair. This particular tool scans external databases for known vulnerabilities and scans images layer by layer to check for vulnerabilities.
Wrapping Up
Google named their containerization solution Kubernetes, Greek for steersman/helmsman. To developers up to their necks in the vagaries of server management, Kubernetes can act like a lighthouse, guiding them smoothly through the high seas of CI/CD.
Kubernetes and containerization are fast becoming the most popular way to deploy and scale applications. But this popularity brings increasing security risks, particularly if DevOps teams aren’t always following best practices.
This hands-on Flux tutorial explores how Flux can be used at the end of your continuous integration pipeline to deploy your applications to Kubernetes clusters.
What is Flux?
Flux is an open-source tool that enables you to automate your application delivery pipelines to Kubernetes clusters. Flux uses source control platforms like Git, enabling users to describe their desired application state. While it was originally developed by Weaveworks, it’s recently been open-sourced.
Flux has been rapidly growing in popularity, as it integrates into Kubernetes and is straightforward to set up. Much like the Terraform project, Flux enables DevOps engineers to deploy solutions to Kubernetes using a declarative configuration file. It’s simple to read and straightforward to update.
Additionally, the configuration files reside within your application’s existing source control platform, enabling a single point for all of your application’s code and configuration.
Why Use Flux?
Once deployed, Flux synchronizes the Kubernetes manifests stored in your source control system with your Kubernetes clusters. This in turn uses periodical polling updating the cluster when changes are identified.
This automated approach removes the need to run kubectl commands and monitor your clusters to see if they have deployed the correct configuration and workloads!
The key benefits of deploying Flux are as follows:
Your source control becomes a single source of the truth.
Your source control becomes a central place for all of your environments, and configurations which are defined in code.
All changes are observable and verified.
How Does Flux Work?
Before we jump into deploying Flux, let’s familiarize ourselves with how the platform works!
Flux configuration files are written in YAML manifests declaratively. These configuration files define everything required to deploy your application to your Kubernetes clusters. The steps for deployment & changes are as follows:
The team describes the Kubernetes cluster configuration and defines this in a manifest that resides in their source control platform which is normally git.
The memcached pod stores the running configuration.
Flux periodically connects to your source control platform and compares the running configuration from the memcached pod vs the source control manifest.
If changes are detected, Flux runs several kubectl apply and delete commands to bring the cluster in sync. The new running configuration is then saved to the memcached pod.
Flux can also poll container registries and update the Kubernetes manifest with the latest versions. This is very powerful should you wish to automate the deployment of new containers.
Deploying Flux
In this Flux tutorial, we are going to deploy PodInfo to our Kubernetes cluster, but you can convert what we are doing to suit your requirements.
We are now going to run through the process of deploying Flux and configuring the solution to achieve the above. Before we jump in, make sure you have access to your Kubernetes cluster and access to the cluster-admin role.
Note: We are assuming that your Kubernetes cluster is version 1.16 or newer and your kubectl binary is version 1.18 or newer.
Install FluxCTL
Flux provides a binary that is used to deploy and manage Flux on your Kubernetes clusters. The first step of this Flux tutorial is to get Flux installed so we can start deploying it to our Kubernetes cluster.
To install Flux we will run the following command on macOS (In this tutorial we are using brew which is a package manager for OSX).
To confirm you have installed Flux and it’s working run:
deklan@Deklans-MacBook-Pro ~ % Flux -v
You should get back the below:
deklan@Deklans-MacBook-Pro ~ % Flux -vFlux version 0.8.2deklan@Deklans-MacBook-Pro ~ %
Using Flux to Create a Repo & Configuration
Before we use Flux to deploy to our cluster, we need to have a repository with our Kubernetes configuration. In this step of the Flux tutorial, we are going to create a repo in Git and define our workspace and namespace within it. The Flux binary will take care of all of this for you. This tutorial expects that you have already got kubectl working and your cluster is connected.
First, let’s define our Github credentials for Flux to use to deploy your new repo and link it to your cluster.
Generating a Github token is done on the Github site. Go to your profile and then select ‘Developer Settings’ on the left-hand side. From there select ‘Personal access token’ and then ‘Generate new token’. Flux requires the permissions below:
With your credentials loaded as environmental variables, we can now use the Flux command to create a repo, create configuration files and link them to your cluster. Run the below (modify the example to suit your requirements):
The Flux-system folder contains the configuration for the Flux service running on the cluster. When deploying a new application, you should create a new folder under your cluster name to house the manifest files. Also for multi-cluster setups (for example development and production), you will have separate <my-cluster> folders to house their respective configuration.
Deploying an Application
In this part of the Flux tutorial, we are going to deploy Podinfo. Podinfo is a tiny web application made with Go that showcases best practices of running microservices in Kubernetes. Now that we have a repo and it’s connected to our Kubernetes cluster using Flux, it’s time to build our configuration to define how our cluster should operate.
Add Podinfo Repository to Flux
Let’s deploy the Podinfo web app to the cluster. We will be using a public repository https://github.com/stefanprodan/podinfo.
Make sure you are in the base level of your local GitHub repository. Create a GitRepository manifest pointing to hello-kubernetes repository’s master branch:
Let’s commit and push it back to our remote GitHub repository so that Flux will pick it up and add it to our Flux running configuration:
git add -A && git commit -m "Add Hello-Kube GitRepository"
And then commit this to the remote repo:
git push
Deploy the Podinfo Application
Now we have the connection to the repository configured, it’s time to deploy the application. Next, we will create a Flux Kustomization manifest for podinfo. This configures Flux to build and apply the kustomize directory located in the podinfo repository. Using the Flux command run the following:
Flux will monitor the repository and detect the changes. It should take about 30 seconds for the new changes to be deployed. You can check using the following command (it will run the Flux get command every two seconds:
If we check our running pods using kubectl we can see that the application has been deployed and is running:
kubectl get pods NAME READY STATUS RESTARTS AGEpodinfo-65c5bdfc77-9zvp2 1/1 Running 0 94spodinfo-65c5bdfc77-pl8j7 1/1 Running 0 110s
Deploying an Operator
In this section of the Flux tutorial, we are going to deploy an operator to our cluster. Operators are extensions to Kubernetes that enable functions to support your applications. A great example of this is the Coralogix operator that enables log shipping from your applications. The advantage of using operators in Flux is that their configuration resides in your Flux repository providing a single source of the truth.
The example used in this Flux tutorial assumes you have an application configured ready for use with the Coralogix Kubernetes operator. We are going to use the Helm commandlet to deploy this operator.
Great! We now have the operator installed! This operator can be used to define your integrations with Coralogix in your application configuration. The advantage is a simple interface defined as code that can be included in your Git repository which configures any additional services your application may require. You can find out more about the Coralogix operator for Kubernetes, so that you can increase your system observability and enhance your Flux deployment.
Conclusion
When it comes to continuous integration and Kubernetes clusters, Flux is one of the most lightweight platforms available to declaratively define your Kubernetes configuration. Flux enables you to push code rather than containers, and with operators like the Coralogix cx-operator, you can build your entire stack in a YAML manifest.
The benefits include no learning curve for new engineers, a standardized deployment process, and a single source of the truth. Moreover, the Flux system is simple to use and provides the ability to sync multiple clusters for example development and production.
This Flux tutorial has covered the basics so go ahead and get building the GitOps way!
As our customers scale and utilize Coralogix for more teams and use cases, we decided to make their lives easier and allow them to set up their Coralogix account using declarative, infrastructure-as-code techniques.
In addition to setting up Log Parsing Rules andAlerts through the Coralogix user interface and REST API, Coralogix users are now able to use modern, cloud-native infrastructure provisioning platforms.
Part of this is managing Coralogix through Kubernetes custom resources. These custom resources behave just like any other Kubernetes monitoring resource; their main benefit is that they can be packaged and deployed alongside services deployed in the cluster (through a Helm chart, for example), and their definition can be managed by source code management tools. This also means that the process for modifying Coralogix rules and alerts can be the standard code review process applied to application changes. This is a big win on all fronts: better auditing, better change management leveraging pull requests and reviews, easier rollbacks, and more.
Intro
To demonstrate this functionality, let’s define an example alert. We start by defining it in a custom AlertSet resource:
This resource describes several alerts that will be created in the Coralogix account associated with the Kubernetes cluster. The structure of the resource mirrors the Coralogix alert definition interface.
Once the resource definition is saved in a file, it can be applied and persisted to Kubernetes using kubectl:
kubectl apply -f test-alertset-1.yaml
The new alert immediately appears on the Coralogix user interface:
How is this possible with Kubernetes? The Operator pattern can be used to extend the cluster with custom behavior. An operator is a containerized application running in the cluster that uses the Kubernetes API to react to particular events. Once installed and deployed in a cluster, the operator will automatically register its custom resources, allowing users to immediately start working with the Coralogix resources without any additional setup.
In the above use case, the operator would watch the event stream of Coralogix-specific custom resources and apply any addition/modification/deletion through the Coralogix API to the user’s account.
Operators can be written in any language. While other operator frameworks and libraries exist, especially for Go, we wanted to use Scala and ZIO to implement the Coralogix Operator in order to enjoy Scala’s expressive type system and the efficiency and developer productivity proven by many of our existing Scala projects.
Birth of a New Library
So, faced with the task of writing a Kubernetes Operator with ZIO, we investigated the optimal way to communicate with the Kubernetes API.
After evaluating several existing Java and Scala Kubernetes client libraries, none of them checked all of our boxes. All had different flaws: non-idiomatic data models, having to wrap everything manually in effects, lack of support for custom resources, and so forth. We felt we could do better and decided to create a new library, an idiomatic ZIO native library to work with the Kubernetes API.
This new library is developed in parallel with the Coralogix Operator, which already supports numerous features and runs in production. Both are fully open source. The library itself will soon be officially released.
Meet zio-k8s
Let’s have a closer look at our new library, called zio-k8s. It consists of several sub-projects:
The client library (zio-k8s-client), written using a mix of generated and hand-written code. The hand-written part contains a generic Kubernetes client implementation built onsttp. On top of that, generated data models and ZIO modules provide access to the full Kubernetes API;
Support for optics libraries (zio-k8s-client-quicklens, zio-k8s-client-monocle), allowing for easy modification and interrogation of the generated data model;
The custom resource definition (CRD) support (zio-k8s-crd), which is an sbt plugin providing the same data model and client code generator functionality for custom resource types;
And finally, the operator library (zio-k8s-operator), which provides higher level constructs built on top of the client library to help to implement operators.
We have some more ideas for additional higher-level libraries coming soon, so stay tuned. Meanwhile, let’s dive into the different layers.
Client
As mentioned above, the client library is a mix of generated code and a core generic Kubernetes client. To get the feel of it, let’s take a look at an example:
As we can see the Kubernetes data models are simple case classes and their names and fields fully match the Kubernetes names, so using YAML examples to build up the fully typed Scala representation is very straightforward.
One special feature to mention is the use of a custom optional type instead of Option in these data models. This provides the implicit conversion from T to Optional[T] which significantly reduces the boilerplate in cases like the one above while still reducing the scope of this conversion to the Kubernetes models only. In practice, the custom optional type works just like the built-in one, and conversion between them is also straightforward.
Next, let’s create the ZIO program that will create a Job in the Kubernetes cluster:
val runJobs: ZIO[Jobs with Clock, K8sFailure, Unit] =for { job <- jobs.create(job(2000), K8sNamespace.default) name <- job.getName _ <- waitForJobCompletion(name) } yield ()
The first thing to note is that each resource has its own ZIO layer. In this example, we can see that runJobs requires the Jobs module in its environment. This lets us access the resources in a resourcename.method fashion (like jobs.create) and additionally provides nice documentation of what resources a given effect needs access to.
The second interesting thing is getName. The Kubernetes data schema is full of optional values and in practice many times we want to assume that a given field is provided. We’ve already seen that for constructing resources the custom optional type tries to reduce the pain of this. The getter methods are the other side of it, they are simple getter effects unpacking the optional fields, failing the effect in case it is not defined. They can be used in places where optional fields are mandatory for the correct operation of the code, like above where we have to know the newly created Job resource’s name.
To finish the example, let’s see how the waitForJobCompletion can be implemented!
def waitForJobCompletion(jobName: String): ZIO[Jobs with Clock, K8sFailure, Unit] = {val checkIfAlreadyCompleted =for { job <- jobs.get(jobName, K8sNamespace.default) isCompleted = job.status.flatMap(_.completionTime).isDefined _ <- ZIO.never.unless(isCompleted) } yield ()val watchForCompletion = jobs.watchForever(Some(K8sNamespace.default)) .collect {// Only look for MODIFIED events for the job given by namecase Modified(item) if item.metadata.flatMap(_.name).contains(jobName) =>// We need its status only item.status }// Dropping updates until completionTime is defined .dropWhile {case None => truecase Some(status) => status.completionTime.isEmpty }// Run until the first such update .runHead .unit checkIfAlreadyCompleted race watchForCompletion}
This is a good example of being able to take advantage of ZIO features when working with a ZIO-native Kubernetes client. We define two effects: one that gets the resource and checks if it has already been completed and another that starts watching the changes of Job resources to detect when the currently running Job becomes completed. Then we can race the two checks to guarantee that we detect when the job’s completionTime gets set.
The watch functionality is built on ZIO Streams. For a given resource type, watchForever provides an infinite stream of TypedWatchEvents. With the stream combinators, we can simply express the logic to wait until the Job with a given name has been modified in a way that it’s completionTime is no longer undefined.
Under the Hood
The code generator takes the Open API definition of the Kubernetes API, processes it, and generates Scala source code by building ASTs with Scalameta. For the data models, these are case classes with the already mentioned getter methods, with implicit JSON codecs and support for resource metadata such as kind and apiVersion.
In addition, for each resource, it generates a package with a type alias representing the set of ZIO layers required for accessing the given resource. Let’s see how it looks like for Pod resources:
type Pods = Has[NamespacedResource[Pod]]with Has[NamespacedResourceStatus[PodStatus, Pod]]with Has[NamespacedLogSubresource[Pod]] with Has[NamespacedEvictionSubresource[Pod]]with Has[NamespacedBindingSubresource[Pod]]
Each resource has either a NamespacedResource or a ClusterResource interface and optionally a set of subresource interfaces. The code generator also generates accessor functions to the package for each operation provided by these interfaces. This combination lets us use the syntax shown above to access concrete resources, such as jobs.create(), but also to write polymorphic functions usable to any resource or subresource.
Custom Resource Support
The zio-k8s-crdsbt plugin extends the client to supportcustom resources. The idea is to put the Custom Resource Definition (CRD) YAMLs to the project’s repository and refer to them from the build definition:
The plugin works very similar to the code generation step of zio-k8s-client itself, generating model classes and client modules for each referenced CRD. The primary difference is that for custom resources the data models are generated with guardrail – a Scala code generator for OpenAPI. This supports a wide set of features so it should be good enough to process arbitrary custom resource definitions.
Operator Framework
The zio-k8s-operator library builds on top of the client providing higher-level constructs that help to implement operators. One of these features performs the registration of a CRD. By simply calling the following effect:
We can guarantee that the custom resource AlertSet, with the definition alertsets.customResourceDefinition, both generated by the zio-k8s-crd plugin is registered within the Kubernetes cluster during the operator’s startup.
Another feature that is useful for operators is to guarantee that only a single instance runs at the same time. There are several ways to implement this, the operator library currently provides one such implementation that is based on creating a resource tied to the pod’s life. For the library’s user, it is as simple as wrapping the ZIO program in a Leader.leaderForLife block or using a ZManaged resource around the application provided by Leader.lease.
Defining an operator for a given resource with this library is simply done by defining an event processor function with the type:
type EventProcessor[R, E, T] =
  (OperatorContext, TypedWatchEvent[T]) => ZIO[R, OperatorFailure[E], Unit]
Then, create an operator with Operator.namespaced. To keep the primary operator logic separated from other concerns we also define operator aspects, modifiers that wrap the operator and can provide things like logging and metrics. A logging aspect is provided with the library out of the box, with the following signature:
def logEvents[T: K8sObject, E]: Aspect[Logging, E, T]
It is based on zio-logging and can be simply applied to an event processor with the @@ operator:
def eventProcessor(): EventProcessor[ Logging with alertsets.AlertSets with AlertServiceClient, CoralogixOperatorFailure, AlertSet ] = ???Operator.namespaced( eventProcessor() @@ logEvents @@ metered(metrics))(Some(namespace), buffer)
Summary
Coralogix users can already take advantage of tighter integration with their infrastructure and application provisioning processes by using the Coralogix Operator. Check out the tutorial on our website to get started.
As for zio-k8s, everything we’ve described in this post is already implemented, available under the friendly Apache 2.0 open-source license. There are some remaining tasks to make it as easy to use as possible and cover most of the functionalities before an official 1.0 release, but it’s very close. PRs and feedback are definitely welcome! And as mentioned, this is just the beginning; we have many ideas in store about how to make the Kubernetes APIs easily accessible and ergonomic for ZIO users. Stay tuned!
This part 2 of a 3-part series on running ELK on Kubernetes with ECK. If you’re just getting started, make sure to checkout Part 1.
Setting Up Elasticsearch on Kubernetes
Picking up where we left off, our Kubernetes cluster is ready for our Elasticsearch stack. We’ll first create an Elasticsearch Node and then continue with setting up Kibana.
Importing Elasticsearch Custom Resource Definitions (CRD) and Operators
Currently, Kubernetes doesn’t yet know about how it should create and manage our various Elasticsearch components. We would have to spend a lot of time manually creating the steps it should follow. But, we can extend Kubernetes’ understanding and functionality, with Custom Resource Definitions and Operators.
Luckily, the Elasticsearch team provides a ready-made YAML file that defines the necessary resources and operators. This makes our job a lot easier, as all we have to do is feed this file to Kubernetes.
Let’s first log in to our master node:
vagrant ssh kmaster
Note: if your command prompt displays “vagrant@kmaster:~$“, it means you’re already logged in and you can skip this command.
With the next command, we import and apply the structure and logic defined in the YAML file:
Optionally, by copying the “https” link from the previous command and pasting it into the address bar of a browser, we can download and examine the file.
Many definitions have detailed descriptions which can be helpful when we want to understand how to use them.
We can see in the command’s output that a new namespace was created, named “elastic-system”.
Let’s go ahead and list all namespaces in our cluster:
kubectl get ns
Now let’s look at the resources in this namespace:
kubectl -n elastic-system get all
“-n elastic-system” selects the namespace we want to work with and “get all” displays the resources.
The output of this command will be useful when we need to check on things like which Pods are currently running, what services are available, at which IP addresses they can be reached at, and so on.
If the “STATUS” for “pod/elastic-operator-0” displays “ContainerCreating“, then wait a few seconds and then repeat the previous command until you see that the status change to “Running“.
We need the operator to be active before we continue.
Launching an Elasticsearch Node in Kubernetes
Now it’s time to tell Kubernetes about the state we want to achieve.
The Kubernetes Operator will then proceed to automatically create and manage the necessary resources to achieve and maintain this state.
We’ll accomplish this with the help of a YAML file. Let’s analyze its contents before passing it to the kubectl command:
kind here means the type of object that we’re describing and intend to create
Under metadata, the name, a value of our choosing, helps us identify the resources that’ll be created
Under nodeSets, we define things like:
The name for this set of nodes.
In count, we choose the number of Elasticsearch nodes we want to create.
Finally, under config, we define how the nodes should be configured. In our case, we’re choosing a single Elasticsearch instance that should be both a Master Node and a Data Node. We’re also using the config option “node.store.allow_mmap: false“, to quickly get started. Note, however, that in a production environment, this section should be carefully configured. For example, in the case of the allow_mmap config setting, users should read Elasticsearch’s documentation about virtual memory before deciding on a specific value.
Under podTemplate we have spec (or specifications) for containers.
Under env we’re passing some environment variables. These ultimately reach the containers in which our applications will run and some programs can pick up on those variables to change their behavior in some way. The Java Virtual Machine, running in the container and hosting our Elasticsearch application, will notice our variable and change the way it uses memory by default.
Also, notice that under resources we define requests with a cpu value of “0.5“. This decreases the CPU priority of this pod.
Under http, we define a service, of the type: NodePort. This creates a service that will be accessible even from outside of Kubernetes’ internal network. In this lesson, we will analyze why this option is important and when we’d want to use it.
Under the ports section we find:
Port tells the service on which port to accept connections. Only apps running inside the Kubernetes cluster can connect to this, so no external connections allowed. For external connections, nodePort will be used.
targetPort makes the requests received by the Kubernetes service on the previously defined port to be redirected to this targetPort in one of the Pods. Of course, the application running in that Pod/Container will also need to listen on this port, to be able to receive the requests. For example, a program makes a request on port 12345, the service will redirect the request to a pod, on targetPort 54321.
Kubernetes runs on Nodes, that is physical or virtual machines. Each physical or virtual machine can have its own IP address, on which other computers can communicate with it. This is called the Node’s IP address or external IP address. nodePort opens up a port, on every node in your cluster, that can be accessed by computers that are outside of Kubernetes’ internal network. For example, if one node would be using a publicly accessible IP address, we could connect to that IP and the specified nodePort and Kubernetes would accept the connection and redirect it to the targetPort to one of the Pods.
As mentioned earlier, we can find a lot of the Elasticsearch-specific objects defined in the “all-in-one.yaml” file we used to import Custom Resource Definitions. For example, if we would open the file and search for “nodeSets“, we would see the following:
This will take a while, but we can verify progress by looking at the resources available. Initially, the status for our Pod will display “Init:0/1”.
kubectl get all
When the Pod containing our Elasticsearch node is finally created, we should notice in the output of this command that “pod/quickstart-es-default-0” has availability of “1/1” under READY and a STATUS of “Running“.
Link to image file
Now we’re set to continue.
Retrieving a Password from Kubernetes Secrets
First, we’ll need to authenticate our cURL requests to Elasticsearch with a username and password. Storing this password in the Pods, Containers, or other parts of the filesystem would not be secure, as, potentially, anyone and anything could freely read them.
Kubernetes has a special location where it can store sensitive data such as passwords, keys or tokens, called Secrets.
To list all secrets protected by Kubernetes, we use the following command:
kubectl get secrets
In our case, the output should look something like this:
We will need the “quickstart-es-elastic-user” secret. With the following command we can examine information about the secret:
Let’s extract the password stored here and save it to a variable called “PASSWORD”.
PASSWORD=$(kubectl get secret quickstart-es-elastic-user -o go-template='{{.data.elastic | base64decode}}')
To display the password, we can type:
echo $PASSWORD
Making the Elasticsearch Node Publicly Accessible
Let’s list the currently available Kubernetes services:
kubectl get svc
Here’s an example output we will analyze:
A lot of IP addresses we’ll see in Kubernetes are so-called internal IP addresses. This means that they can only be accessed from within the same network. In our case, this would imply that we can connect to certain things only from our Master Node or the other two Worker Nodes, but not from other computers outside this Kubernetes cluster.
When we will run a Kubernetes cluster on physical servers or virtual private servers, these will all have external IP addresses that can be accessed by any device connected to the Internet. By using the previously discussed NodePort service, we open up a certain port on all Nodes. This way, any computer connected to the Internet can get access to services offered by our pods, by sending requests to the external IP address of a Kubernetes node and the specified NodePort number.
Alternatively, instead of NodePort, we can also use a LoadBalancer type of service to make something externally available.
In our case, we can see that all incoming requests, on the external IP of the Node, to port 31920/TCP will be routed to port 9200 on the Pods.
We extracted the necessary password earlier, so now we can fire a cURL request to our Elasticsearch node:
Since we made this request from the “kmaster” Node, it still goes through Kubernetes’ internal network.
So to see if our service is indeed available from outside this network, we can do the following.
First, we need to find out the external IP address for the Node we’ll use. We can list all external IPs of all Nodes with this command:
kubectl get nodes --selector=kubernetes.io/role!=master -o jsonpath={.items[*].status.addresses[?(@.type=="InternalIP")].address} ; echo
Alternatively, we can use another method:
ip addr
And look for the IP address displayed under “eth1”, like in the following:
However, this method requires closer attention, as the external IP may become associated with a different adapter name in the future. For example, the identifier might start with the string “enp”.
In our case, the IP we extracted here belongs to the VirtualBox machine that is running this specific Node. If the Kubernetes Node would run on a server instead, it would be the publicly accessible IP address of that server.
Now, let’s assume for a moment that the external IP of our node is 172.42.42.100. If you want to run this exercise, you’ll need to replace this with the actual IP of your own Node, in case it differs.
You will also need to replace the password, with the one that was generated in your case.
Let’s display the password again:
echo $PASSWORD
Select and copy the output you get since we’ll need to paste it in another window.
In our example, the output is 3sun1I8PB41X2C8z91Xe7DGy, but you shouldn’t use this. We brought attention to this value just so you can see where your password should be placed in the next command.
Next, minimize your current SSH session or terminal window, don’t close it, as you’ll soon return to that session.
Windows: If you’re running Windows, open up a Command Prompt and execute the next command.
Linux/Mac: On Linux or Mac, you would need to open up a new terminal window instead.
Windows 10 and some versions of Linux have the cURL utility installed by default. If it’s not available out of the box for you, you will have to install it before running the next command.
Remember to replace highlighted values with what applies to your situation:
And there it is, you just accessed your Elasticsearch Node that’s running in a Kubernetes Pod by sending a request to the Kubernetes Node’s external IP address.
Now let’s close the Command Prompt or the Terminal for Mac users and return to the previously minimized SSH session, where we’re logged in to the kmaster Node.
Setting Up Kibana
Creating the Kibana Pod
As we did with our Elasticsearch node, we’ll declare to Kubernetes what state we want to achieve, and it will take the necessary steps to bring up and maintain a Kibana instance.
Let’s look at a few key points in the YAML file that we’ll pass to the kubectl command:
The elasticsearchRef entry is important, as it points Kibana to the Elasticsearch cluster it should connect to.
In the service and ports sections, we can see it’s similar to what we had with the Elasticsearch Node, making it available through a NodePort service on an external IP address.
Now let’s apply these specifications from our YAML file:
It will take a while for Kubernetes to create the necessary structures. We can check its progress with:
kubectl get pods
The name of the Kibana pod will start with the string “quickstart-kb-“. If we don’t see “1/1” under READY and a STATUS of Running, for this pod, we should wait a little more and repeat the command until we notice that it’s ready.
Accessing the Kibana Web User Interface
Let’s list the services again to extract the port number where we can access Kibana.
kubectl get svc
We can see the externally accessible port is 31560. We also need the IP address of a Kubernetes Node.
The procedure is the same as the one we followed before and the external IPs should also be the same:
kubectl get nodes --selector=kubernetes.io/role!=master -o jsonpath={.items[*].status.addresses[?(@.type=="InternalIP")].address} ; echo
Finally, we can now open up a web browser, where, in the URL address bar we type “https://” followed by the IP address and the port number. The IP and port should be separated by a colon (:) sign.
Here’s an example of how this could look like:
https://172.42.42.100:31560
Since Kibana currently uses a self-signed SSL/TLS security certificate, not validated by a certificate authority, the browser will automatically refuse to open the web page.
To continue, we need to follow the steps specific to each browser. For example, in Chrome, we would click on “Advanced” and then at the bottom of the page, click on “Proceed to 172.42.42.100 (unsafe)“.
On production systems, you should use valid SSL/TLS certificates, signed by a proper certificate authority. The Elasticsearch documentation has instructions about how we can import our own certificates when we need to.
Finally, the Kibana dashboard appears:
Under username, we enter “elastic” and the password is the same one we retrieved in the $PASSWORD variable. If we need to display it again, we can go back to our SSH session on the kmaster Node and enter the command:
echo $PASSWORD
Inspecting Pod Logs
Now let’s list our Pods again:
kubectl get pods
By copying and pasting the pod name to the next command, we can look at the logs Kubernetes keeps for this resource. We also use the “-f” switch here to “follow” our log, that is, watch it as it’s generated.
kubectl logs quickstart-es-default-0 -f
Whenever we open logs in this “follow” mode, we’ll need to press CTRL+C when we want to exit.
Installing The Kubernetes Dashboard
So far, we’ve relied on the command line to analyze and control various things in our Kubernetes infrastructure. But just like Kibana can make some things easier to visualize and analyze, so can the Kubernetes Web User Interface.
Important Note: Please note that the YAML file used here is meant just as an ad-hoc, simple solution to quickly add Kubernetes Web UI to the cluster. Otherwise said, we used a modified config that gives you instant results, so you can experiment freely and effortlessly. But while this is good for testing purposes, it is NOT SAFE for a production system as it will make the Web UI publicly accessible and won’t enforce proper login security. If you intend to ever add this to a production system, follow the steps in the official Kubernetes Web UI documentation.
Let’s pass the next YAML file to Kubernetes, which will do the heavy lifting to create and configure all of the components necessary to create a Kubernetes Dashboard:
As usual, we can check with the next command if the job is done:
kubectl get pods
Once the Dashboard Pod is running, let’s list the Services, to find the port we need to use to connect to it:
kubectl get svc
In our example output, we see that Dashboard is made available at port 30000.
Just like in the previous sections, we use the Kubernetes Node’s external IP address, and port, to connect to the Service. Open up a browser and type the following in the address bar, replacing the IP address and port, if necessary, with your actual values:
https://172.42.42.100:30000
The following will appear:
Since we’re just testing functionality here, we don’t need to configure anything and we can just click “Skip” and then we’ll be greeted with the Overview page in the Kubernetes Web UI.
Installing Plugins to an Elasticsearch Node Managed by Kubernetes
We might encounter a need for plugins to expand Elasticsearch’s basic functionality. Here, we will assume we need the S3 plugin to access Amazon’s object storage service.
The process we’ll go through looks like this:
Storing S3 Authentication Keys as Kubernetes Secrets
We previously explored how to extract values from Kubernetes’ secure Secret vault. Now we’ll learn how to add sensitive data here.
To make sure that only authorized parties can access them, S3 buckets will ask for two keys. We will use the following fictional values.
AWS_ACCESS_KEY=123456
AWS_SECRET_ACCESS_KEY=123456789
If, in the future, you want to adapt this exercise for a real-world scenario, you would just copy the key values from your Amazon Dashboard and paste them in the next two commands.
To add these keys, with their associated values, to Kubernetes Secrets, we would enter the following commands:
Each command will output a message, informing the user that the secret has been created.
Let’s list the secrets we have available now:
kubectl get secrets
Notice our newly added entries:
We can also visualize these in the Kubernetes Dashboard:
Installing the Elasticsearch S3 Plugin
When we created our Elasticsearch node, we described the desired state in a YAML file and passed it to Kubernetes through a kubectl command. To install the plugin, we simply describe a new, changed state, in another YAML file, and pass it once again to Kubernetes.
The modifications to our original YAML config are highlighted here:
Here, we create environment variables named AWS_ACCESS_KEY_ID and AWS_SECRET_ACCESS_KEY, inside the Container. We assign them the values of our secret keys, extracted from the Kubernetes Secrets vault.
Here, we simply instruct Kubernetes to execute certain commands when it initializes the Containers. The commands will first install the S3 plugin and then configure it with the proper secret key values, passed along through the $AWS_ACCESS_KEY_ID and $AWS_SECRET_ACCESS_KEY environment variables.
To get started, let’s first delete the Elasticsearch node from our Kubernetes cluster, by removing its associated YAML specification:
After a while, we can check the status of the Pods again to see if Kubernetes finished setting up the new configuration:
kubectl get pods
As usual, a STATUS of “Running” means the job is complete:
Verifying Plugin Installation
Since we’ve created a new Elasticsearch container, this will use a newly generated password to authenticate cURL requests. Let’s retrieve it, once again, and store it in the PASSWORD variable:
PASSWORD=$(kubectl get secret quickstart-es-elastic-user -o go-template='{{.data.elastic | base64decode}}')
It’s useful to list the Services again, to check which port we’ll need to use in order to send cURL requests to the Elasticsearch Node:
kubectl get svc
Take note of the port displayed for “quickstart-es-http” since we’ll use it in the next command:
Finally, we can send a cURL request to Elasticsearch to display the plugins it is using:
More and more employers are looking for people experienced in building and running Kubernetes-based systems, so it’s a great time to start learning how to take advantage of the new technology. Elasticsearch consists of multiple nodes working together, and Kubernetes can automate the process of creating these nodes and taking care of the infrastructure for us, so running ELK on Kubernetes can be a good options in many scenarios.
We’ll start this with an overview of Kubernetes and how it works behind the scenes. Then, armed with that knowledge, we’ll try some practical hands-on exercises to get our hands dirty and see how we can build and run Elastic Cloud on Kubernetes, or ECK for short.
What we’ll cover:
Fundamental Kubernetes concepts
Use Vagrant to create a Kubernetes cluster with one master node and two worker nodes
Create Elasticsearch clusters on Kubernetes
Extract a password from Kubernetes secrets
Publicly expose services running on Kubernetes Pods to the Internet, when needed.
How to install Kibana
Inspect Pod logs
Install the Kubernetes Web UI (i.e. Dashboard)
Install plugins on an Elasticsearch node running in a Kubernetes container
System Requirements: Before proceeding further, we recommend a system with at least 12GB of RAM, 8 CPU cores, and a fast internet connection. If your computer doesn’t meet the requirements, just use a VPS (virtual private server) provider. Google Cloud is one service that meets the requirements, as it supports nested virtualization on Ubuntu (VirtualBox works on their servers).
There’s a trend, lately, to run everything in isolated little boxes, either virtual machines or containers. There are many reasons for doing this so we won’t get into it here, but if you’re interested, you can read Google’s motivation for using containers.
Let’s just say that containers make some aspects easier for us, especially in large-scale operations.
Managing one, two, or three containers is no big deal and we can usually do it manually. But when we have to deal with tens or hundreds of them, we need some help.
This is where Kubernetes comes in.
What is Kubernetes?
By way of analogy, if containers are the workers in a company, then Kubernetes would be the manager, supervising everything that’s happening and taking appropriate measures to keep everything running smoothly.
After we define a plan of action, Kubernetes does the heavy lifting to fulfill our requirements.
Examples of what you can do with K8s:
Launch hundreds of containers, or whatever number needed with much less effort
Set up ways that containers can communicate with each other (i.e. networking)
Automatically scale up or down. When demand is high, create more containers, even on multiple physical servers, so that the stress of the high demand is distributed across multiple machines, making it easier to process. As soon as demand goes down, it can remove unneeded containers, as well as the nodes that were hosting them (if they’re sitting idle).
If there are a ton of requests coming in, Kubernetes can load balance and evenly distribute the workload to multiple containers and nodes.
Containers are carefully monitored with health checks, according to user-defined specifications. If one stops working, Kubernetes can restart it, create a new one as a replacement, or kill it entirely. If a physical machine running containers fails, those containers can be moved to another physical machine that’s still working correctly.
Kubernetes Cluster Structure
Let’s analyze the structure from the top down to get a good handle on things before diving into the hands-on section.
First, Kubernetes must run on computers of some kind. It might end up being on dedicated servers, virtual private servers, or virtual machines hosted by a capable server.
Multiple such machines running Kubernetes components form a Kubernetes cluster, which is considered the whole universe of Kubernetes, because everything, from containers to data, to monitoring systems and networking exists here.
In this little universe, there has to be a central point of command, like the “brains” of Kubernetes. We call this the master node. This node assumes control of the other nodes, sometimes also called worker nodes. The master node manages the worker nodes, while these, in turn, run the containers and do the actual work of hosting our applications, services, processing data, and so on.
Master Node
Basically, we’re the master of our master node, and it, in turn, is the master of every other node.
We instruct our master node about what state we want to achieve which then proceeds to take the necessary steps to fulfill our demands.
Simply put, it automates our plan of action and tries to keep the system state within set parameters, at all times.
Nodes (or Worker Nodes)
The Nodes are like the “worker bees” of a Kubernetes cluster and provide the physical resources, such as CPU, storage space, memory, to run our containers.
Basic Kubernetes Concepts
Up until this point, we kept things simple and just peaked at the high-level structure of a Kubernetes cluster. So now let’s zoom in and take a closer look at the internal structure so we better understand what we’re about to get our hands dirty with.
Pods
Pods are like the worker ants of Kubernetes – the smallest units of execution. They are where applications run and do their actual work, processing data. A Pod has its own storage resources, and its own IP address and runs a container, or sometimes, multiple containers grouped together as a single entity.
Services
Pods can appear and disappear at any moment, each time with a different IP address. It would be quite hard to send requests to Pods since they’re basically a moving target. To get around this, we use Kubernetes Services.
A K8s Service is like a front door to a group of Pods. The service gets its own IP address. When a request is sent to this IP address, the service then intelligently redirects it to the appropriate Pod. We can see how this approach provides a fixed location that we can reach. It can also be used as a mechanism for things like load balancing. The service can decide how to evenly distribute all incoming requests to appropriate Pods.
Namespaces
Physical clusters can be divided into multiple virtual clusters, called namespaces. We might use these for a scenario in which two different development teams need access to one Kubernetes cluster.
With separate namespaces, we don’t need to worry if one team screws up the other team’s namespace since they’re logically isolated from one another.
Deployments
In deployments, we describe a state that we want to achieve. Kubernetes then proceeds to work its magic to achieve that state.
Deployments enable:
Quick updates – all Pods can gradually be updated, one-by-one, by the Deployment Controller. This gets rid of having to manually update each Pod. A tedious process no one enjoys.
Maintain the health of our structure – if a Pod crashes or misbehaves, the controller can replace it with a new one that works.
Recover Pods from failing nodes – if a node should go down, the controller can quickly launch working Pods in another, functioning node.
Automatically scale up and down based on the CPU utilization of Pods.
Rollback changes that created issues. We’ve all been there 🙂
Labels and Selectors
First, things like Pods, services, namespaces, volumes, and the like, are called “objects”. We can apply labels to objects. Labels help us by grouping and organizing subsets of these objects that we need to work with.
The way Labels are constructed is with key/value pairs. Consider these examples:
app:nginx
site:example.com
Applied to specific Pods, it can easily help us identify and select those that are running the Nginx web server and are hosting a specific website.
And finally, with a selector, we can match the subset of objects we intend to work with. For example, a selector like
app = nginx
site = example.com
This would match all the Pods running Nginx and hosting “example.com”.
Ingress
In a similar way that Kubernetes Services sit in front of Pods to redirect requests, Ingress sits in front of Services to load balance between different Services using SSL/TLS to encrypt web traffic or using name-based hosting.
Let’s take an example to explain name-based hosting. Say there are two different domain names, for example, “a.example.com” and “b.example.com” pointing to the same ingress IP address. Ingress can be made to route requests coming from “a.example.com” to service A and requests from “b.example.com” to service B.
Stateful Sets
Deployments assume that applications in Kubernetes are stateless, that is, they start and finish their job and can then be terminated at any time – with no state being preserved.
However, we’ll need to deal with Elasticsearch, which needs a stateful approach.
Kubernetes has a mechanism for this called StatefulSets. Pods are assigned persistent identifiers, which makes it possible to do things like:
Preserve access to the same volume, even if the Pod is restarted or moved to another node.
Assign persistent network identifiers, even if Pods are moved to other nodes.
Start Pods in a certain order, which is useful in scenarios where Pod2 depends on Pod1 so, obviously, Pod1 would need to start first, every time.
Rolling updates in a specific order.
Persistent Volumes
A persistent volume is simply storage space that has been made available to the Kubernetes cluster. This storage space can be provided from the local hardware, or from cloud storage solutions.
When a Pod is deleted, its associated volume data is also deleted. As the name suggests, persistent volumes preserve their data, even after a Pod that was using it disappears. Besides keeping data around, it also allows multiple Pods to share the same data.
Before a Pod can use a persistent volume, though, it needs to make a Persistent Volume Claim on it.
Headless Service
We previously saw how a Service sits in front of a group of Pods, acting as a middleman, redirecting incoming requests to a dynamically chosen Pod. But this also hides the Pods from the requester, since it can only “talk” with the Service’s IP address.
If we remove this IP, however, we get what’s called a Headless Service. At that point, the requester could bypass the middle man and communicate directly with one of the Pods. That’s because their IP addresses are now made available to the outside world.
This type of service is often used with Stateful Sets.
Kubectl
Now, we need a way to interact with our entire Kubernetes cluster. The kubectl command allows us to enter commands to get kubectl to do what we need. It then interacts with the Kubernetes API, and all of the other components, to execute our desired actions.
Let’s look at a few simple commands.
For example, to check the cluster information, we’d would enter:
kubectl cluster-info
If we wanted to list all nodes in the cluster, we’d enter:
kubectl get nodes
We’ll take a look at many more examples in our hands-on exercises.
Operators
Some operations can be complex. For example, upgrading an application might require a large number of steps, verifications, and decisions on how to act if something goes wrong. This might be easy to with one installation, but what if we have 1000 to worry about?
In Kubernetes, hundreds, thousands, or more containers might be running at any given point. If we would have to manually do a similar operation on all of them, it’s why we’d want to automate that.
Enter Operators. We can think of them as a sort of “software operators,” replacing the need for human operators. These are written specifically for an application, to help us, as service owners, to automate tasks.
Operators can deploy and run the many containers and applications we need, react to failures and try to recover from them, automatically backup data, and so on. This essentially lets us extend Kubernetes beyond its out-of-the-box capabilities without modifying the actual Kubernetes code.
Custom Resources
Since Kubernetes is modular by design, we can extend the API’s basic functionality. For example, the default installation might not have appropriate mechanisms to deal efficiently with our specific application and needs. By registering a new Custom Resource Definition, we can add the functionality we need, custom-tailored for our specific application. In our exercises, we’ll explore how to add Custom Resource Definitions for various Elasticsearch applications.
Hands-On Exercises
Basic Setup
Ok, now the fun begins. We’ll start by creating virtual machines that will be added as nodes to our Cluster. We will use VirtualBox to make it simpler.
We can then open the setup file we just downloaded and click “Next” in the installation wizard, keeping the default options selected.
After finishing with the installation, it’s a good idea to check if everything works correctly by opening up VirtualBox, either from the shortcut added to the desktop, or the Start Menu.
If everything seems to be in order, we can close the program and continue with the Vagrant setup.
1.2 Installing VirtualBox on Ubuntu
First, we need to make sure that the Ubuntu Multiverse repository is enabled.
Afterward, we install VirtualBox with the next command:
We can now open the DMG file, execute the PKG inside and run the installer. We keep the default options selected and continue with the steps in the install wizard.
Let’s open up the terminal and check if the install was successful.
virtualbox
If the application opens up and everything seems to be in order, we can continue with the Vagrant setup.
2. Installing Vagrant
It would be pretty time-consuming to set up each virtual machine for use with Kubernetes. But we will use Vagrant, a tool that automates this process, making our work much easier.
2.1 Installing Vagrant on Windows
Installing on Windows is easy. We just need to visit the following address, https://www.vagrantup.com/downloads.html, and click on the appropriate link for the Windows platform. Nowadays, it’s almost guaranteed that everyone would need the 64-bit executable. Only download the 32-bit program if you’re certain your machine has an older, 32-bit processor.
Now we just need to follow the steps in the install wizard, keeping the default options selected.
If at the end of the setup you’re prompted to restart your computer, please do so, to make sure all components are configured correctly.
Let’s see if the “vagrant” command is available. Click on the Start Menu, type “cmd” and open up “Command Prompt”. Next, type:
vagrant --version
If the program version is displayed, we can move on to the next section and provision our Kubernetes cluster.
2.2 Installing Vagrant on Ubuntu
First, we need to make sure that the Ubuntu Universe repository is enabled.
If that’s enabled, installing Vagrant is as simple as running the following command:
Finally, let’s double-check that the program was successfully installed, with:
vagrant --version
2.3 Installing Vagrant on macOS
Let’s first download the setup file from https://www.vagrantup.com/downloads.html, which, at the time of this writing, would be found at the bottom of the page, next to the macOS icon.
Once the download is finished, let’s open up the DMG file, execute the PKG inside, and go through the steps of the install wizard, leaving the default selections as they are.
Once the install is complete, we will be presented with this window.
But we can double-check if Vagrant is fully set up by opening up the terminal and typing the next command:
vagrant --version
Provisioning the Kubernetes Cluster
Vagrant will interact with the VirtualBox API to create and set up the required virtual machines for our cluster. Here’s a quick overview of the workflow.
Once Vagrant finishes the job, we will end up with three virtual machines. One machine will be the master node and the other two will be worker nodes.
Next, we have to extract the directory “k8s_ubuntu” from this ZIP file.
Now let’s continue, by entering the directory we just unzipped. You’ll need to adapt the next command to point to the location where you extracted your files.
For example, on Windows, if you extracted the directory to your Desktop, the next command would be “cd Desktopk8s_ubuntu”.
On Linux, if you extracted to your Downloads directory, the command would be “cd Downloads/k8s_ubuntu”.
cd k8s_ubuntu
We’ll need to be “inside” this directory when we run a subsequent “vagrant up” command.
Let’s take a look at the files within. On Windows, enter:
dir
On Linux/macOS, enter:
ls -lh
The output will look something like this:
We can see a file named “Vagrantfile”. This is where the main instructions exist, telling Vagrant how it should provision our virtual machines.
Let’s open the file, since we need to edit it:
Note: In case you’re running an older version of Windows, we recommend you edit in WordPad instead of Notepad. Older versions of Notepad have trouble interpreting EOL (end of line) characters in this file, making the text hard to read since lines wouldn’t properly be separated.
Look for the text “v.memory” found under the “Kubernetes Worker Nodes” section. We’ll assign this variable a value of 4096, to ensure that each Worker Node gets 4 GB of RAM because Elasticsearch requires at least this amount to function properly with the 4 nodes we will add later on. We’ll also change “v.cpus” and assign it a value of 2 instead of 1.
After we save our edited file, we can finally run Vagrant:
vagrant up
Now, this might take a while since there’re quite a few things that need to be downloaded and set up. We’ll be able to follow its progress in the output and we may get a few prompts to accept some changes.
When the job is done, we can SSH into the master node by typing:
vagrant ssh kmaster
Let’s check if Kubernetes is up and running:
kubectl get nodes
This will list the nodes that make up this cluster:
Pretty awesome! We are well on our way to implementing the ELK stack on Kubernetes. So far, we’ve created our Kubernetes cluster and just barely scratched the surface of what we can do with such automation tools.
Stay tuned for more about Running ELK on Kubernetes with the rest of the series!
Kubernetes log monitoring can be complex. To do it successfully requires several components to be monitored simultaneously. First, it’s important to understand what those components are, which metrics should be monitored and what tools are available to do so.
In this post, we’ll take a close look at everything you need to know to get started with monitoring your Kubernetes-based system.
Monitoring Kubernetes Clusters vs. Kubernetes Pods
Monitoring Kubernetes Clusters
When monitoring the cluster, a full view across all areas is obtained, giving a good impression of the health of all pods, nodes, and apps.
Key areas to monitor at the cluster level include:
Node load: Tracking the load on each node is integral to monitoring efficiency. Some nodes are used more than others. Rebalancing the load distribution is key to keeping workloads fluid and effective. This can be done via DaemonSets.
Unsuccessful pods: Pods fail and abort. This is a normal part of Kubernetes processes. When a pod that should be working at a more efficient level or is inactive, it is essential to investigate the reason behind the anomalies in pod failures.
Cluster usage: Monitoring cluster infrastructure allows adjustment of the number of nodes in use and the allocation of resources to power workloads efficiently. The visibility of resources being distributed allows scaling up or down and avoids the costs of additional infrastructure. It is important to set a container’s memory and CPU usage limit accordingly.
Monitoring Kubernetes Pods
Cluster monitoring provides a global view of the Kubernetes environment, but collecting data from individual pods is also essential. It reveals the health of individual pods and the workloads they are hosting, providing a clearer picture of pod performance at a granular level, beyond the cluster.
Key areas to monitor at the cluster level include:
Total pod instances: There needs to be enough instances of a pod to ensure high availability. This way hosting bandwidth is not wasted, however consideration is needed to not run ‘too many extra’ pod instances.
Actual pod instances: Monitoring the number of instances for each pod that’s running versus what is expected to be running will reveal how to redistribute resources to achieve the desired state in terms of pods instances. ReplicaSets could be misconfigured with varying metrics, so it’s important to analyze these regularly.
Pod deployment: Monitoring pods deployment allows to view any misconfigurations that might be diminishing the availability of pods. It’s critical to monitor how resources distribute to nodes.
Important Metrics for Kubernetes Monitoring
To gain a higher visibility into a Kubernetes installation, there are several metrics that will provide valuable insight into how the apps are running.
Common metrics
These are metrics collected from the Kubernetes code, written in Golang. They allow understanding of performance in the platform at a cellular level and display the state of what is happening in the GoLang processes.
Node metrics –
Monitoring the standard metrics from the operating systems that power Kubernetes nodes provides insight into the health of each node.
Each Kubernetes Node has a finite capacity of memory and CPU and that can be utilized by the running pods, so these two metrics need to be monitored carefully. Other common node metrics to monitor include CPU load, memory consumption, filesystem activity and usage and network activity.
One approach to monitoring all cluster nodes is to create a special kind of Kubernetes pod called DaemonSets. Kubernetes ensures that every node created has a copy of the DaemonSet pod, which virtually enables one deployment to watch each machine in the cluster. As nodes are destroyed, the pod is also terminated.
Kubelet metrics –
To ensure the Control Plane is communicating efficiently with each individual node that a Kubelet runs on, it is recommended to monitor the Kubelet agent regularly. Beyond the common GoLang common metrics described above, Kubelet exposes some internals about its actions that are useful to track as well.
Controller manager metrics –
To ensure that workloads are orchestrated effectively, monitor the requests that the Controller is making to external APIs. This is critical in cloud-based Kubernetes deployments.
Scheduler metrics
To identify and prevent delays, monitor latency in the scheduler. This will ensure Kubernetes is deploying pods smoothly and on time.
The main responsibility of the scheduler is to choose which nodes to start newly launched pods on, based on resource requests and other conditions.
The scheduler logs are not very helpful on their own. Most of the scheduling decisions are available as Kubernetes events, which can be logged easily in a vendor-independent way, thus are the recommended source for troubleshooting. The scheduler logs might be needed in the rare case when the scheduler is not functioning, but a kubectl logs call is usually sufficient.
etcd metrics –
etcd stores all the configuration data for Kubernetes. etcd metrics will provide essential visibility into the condition of the cluster.
Container metrics –
Looking specifically into individual containers will allow monitoring of exact resource consumption rather than more general Kubernetes metrics. CAdvisor analyzes resource usage happening inside containers.
API Server metrics –
The Kubernetes API server is the interface to all the capabilities that Kubernetes provides. The API server controls all the operations that Kubernetes can perform. Monitoring this critical component is vital to ensure a smooth running cluster.
The API server metrics are grouped into a major categories:
Request Rates and Latencies
Performance of controller work queues
etcd helper cache work queues and cache performance
General process status (File Descriptors/Memory/CPU Seconds)
Golang status (GC/Memory/Threads)
kube-state-metrics –
kube-state-metrics is a service that makes cluster state information easily consumable. Where the Metrics Server exposes metrics on resource usage by pods and nodes, kube-state-metrics listens to the Control Plane API server for data on the overall status of Kubernetes objects (nodes, pods, Deployments, etc) as well as the resource limits and allocations for those objects. It then generates metrics from that data that are available through the Metrics API.
kube-state-metrics is an optional add-on. It is very easy to use and exports the metrics through an HTTP endpoint in a plain text format. They were designed to be easily consumed / scraped by open source tools like Prometheus.
In Kubernetes, the user can fetch system-level metrics from various out of the box tools like cAdvisor, Metrics Server, and Kubernetes API Server. It is also possible to fetch application level metrics from integrations like kube-state-metrics and Prometheus Node Exporter.
Prometheus scrapes metrics from instrumented jobs, either directly or via an intermediary push gateway for short-lived jobs. It locally stores all scraped samples and runs rules over this data to either aggregate and record new time series from existing data or generate alerts. Grafana or other API tools can be used to visualize the collected data.
Prometheus, Grafana and Alertmanager
One of the most popular Kubernetes monitoring solutions is the open-source Prometheus, Grafana and Alertmanager stack, deployed alongside kube-state-metrics and node_exporter to expose cluster-level Kubernetes object metrics as well as machine-level metrics like CPU and memory usage.
What is Prometheus?
Prometheus is a pull-based tool used specifically for containerized environments like Kubernetes. It is primarily focused on the metrics space and is more suited for operational monitoring. Exposing and scraping prometheus metrics is straightforward, and they are human readable, in a self-explanatory format. The metrics are published using a standard HTTP transport and can be checked using a web browser.
Apart from application metrics, Prometheus can collect metrics related to:
Node exporter, for the classical host-related metrics: cpu, mem, network, etc.
Kube-state-metrics for orchestration and cluster level metrics: deployments, pod metrics, resource reservation, etc.
Kube-system metrics from internal components: kubelet, etcd, scheduler, etc.
Prometheus can configure rules to trigger alerts using PromQL, Alertmanager will be in charge of managing alert notification, grouping, inhibition, etc.
Using Prometheus with Alertmanager and Grafana
PromQL (Prometheus Query Language) lets the user choose time-series data to aggregate and then view the results as tabular data or graphs in the Prometheus expression browser. Results can also be consumed by the external system via an API.
How does Alertmanager fit in? The Alertmanager component configures the receivers, gateways to deliver alert notifications. It handles alerts sent by client applications such as the Prometheus server and takes care of deduplicating, grouping, and routing them to the correct receiver integration such as email, PagerDuty or OpsGenie. It also takes care of silencing and inhibition of alerts.
Grafana can pull metrics from any number of Prometheus servers and display panels and dashboards. It also has the added ability to register multiple different backends as a datasource and render them all out on the same dashboard. This makes Grafana an outstanding choice for monitoring dashboards.
Useful Log Data for Troubleshooting
Logs are useful to examine when a problem is revealed by metrics. They give exact and invaluable information which provides more details than metrics. There are many options for logging in most of Kubernetes’ components. Applications also generate log data.
Digging deeper into the cluster requires logging into the relevant machines.
The locations of the relevant log files are:
Master
/var/log/kube-apiserver.log – API Server, responsible for serving the API
/var/log/kube-scheduler.log – Scheduler, responsible for making scheduling decisions
/var/log/kube-controller-manager.log – Controller that manages replication controllers
Worker nodes
/var/log/kubelet.log – Kubelet, responsible for running containers on the node
/var/log/kube-proxy.log – Kube Proxy, responsible for service load balancing
etcd logs
etcd uses the Github capnslog library for logging application output categorized into levels.
A log message’s level is determined according to these conventions:
Error: Data has been lost, a request has failed for a bad reason, or a required resource has been lost.
Warning: Temporary conditions that may cause errors, but may work fine.
Notice: Normal, but important (uncommon) log information.
Info: Normal, working log information, everything is fine, but helpful notices for auditing or common operations.
Debug: Everything is still fine, but even common operations may be logged and less helpful but more quantity of notices.
kubectl
When it comes to troubleshooting the Kubernetes cluster and the applications running on it, understanding and using logs are crucial. Like most systems, Kubernetes maintains thorough logs of activities happening in the cluster and applications, which highlight the root causes of any failures.
Logs in Kubernetes can give an insight into resources such as nodes, pods, containers, deployments and replica sets. This insight allows the observation of the interactions between those resources and see the effects that one action has on another. Generally, logs in the Kubernetes ecosystem can be divided into the cluster level (logs outputted by components such as the kubelet, the API server, the scheduler) and the application level (logs generated by pods and containers).
Use the following syntax to run kubectl commands from your terminal window:
kubectl [command] [TYPE] [NAME] [flags]
Where:
command: the operation to perform on one or more resources, i.e. create, get, describe, delete.
TYPE: the resource type.
NAME: the name of the resource.
flags: optional flags.
Examples:
kubectl get pod pod1# Lists resources of the pod ‘pod1’
kubectl logs pod1# Returns snapshot logs from the pod ‘pod1’
Kubernetes Events
Since Kubernetes Events capture all the events and resource state changes happening in your cluster, they allow past activities to be analyzed in your cluster. They are objects that display what is happening inside a cluster, such as the decisions made by the scheduler or why some pods were evicted from the node. They are the first thing to inspect for application and infrastructure operations when something is not working as expected.
Unfortunately, Kubernetes events are limited in the following ways:
Kubernetes Events can generally only be accessed using kubectl.
The default retention period of kubernetes events is one hour.
The retention period can be increased but this can cause issues with the cluster’s key-value store.
There is no way to visualize these events.
To address these issues, open source tools like Kubewatch, Eventrouter and Event-exporter have been developed.
Summary
Kubernetes monitoring is performed to maintain the health and availability of containerized applications built on Kubernetes. When you are creating the monitoring strategy for Kubernetes-based systems, it’s important to keep in mind the top metrics to monitor along with the various monitoring tools discussed in this article.
Be Our Partner
Complete this form to speak with one of our partner managers.
Thank You
Someone from our team will reach out shortly. Talk to you soon!
 The new standard of observability is here. Discover Olly, the industry’s first
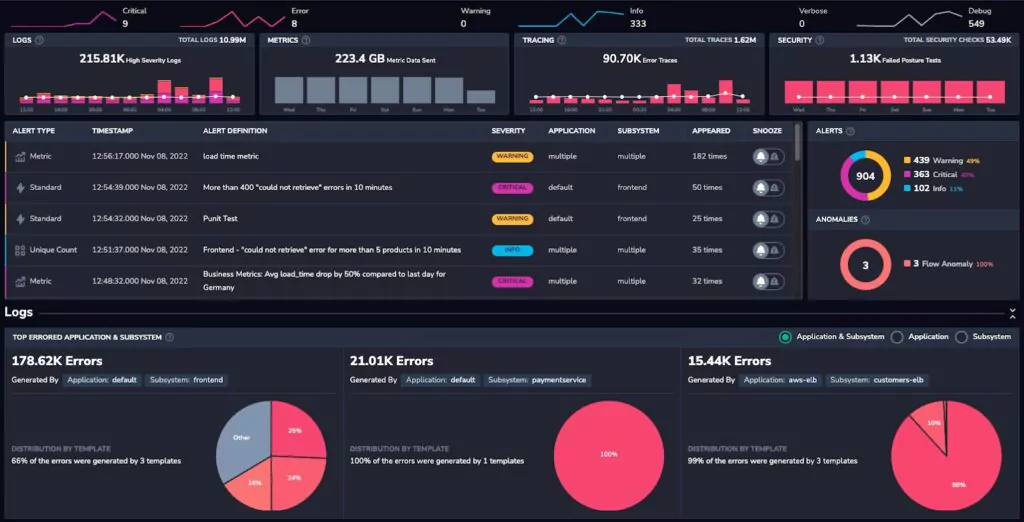
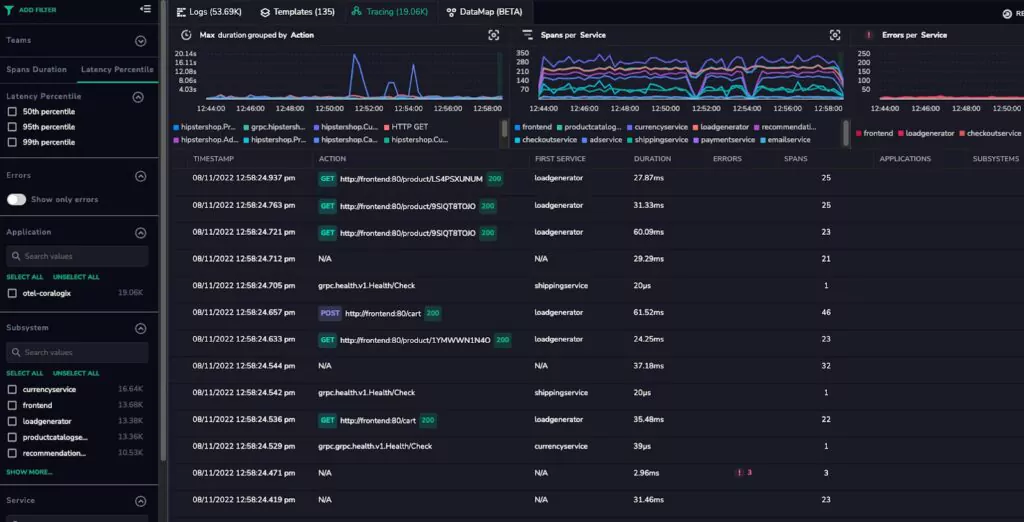
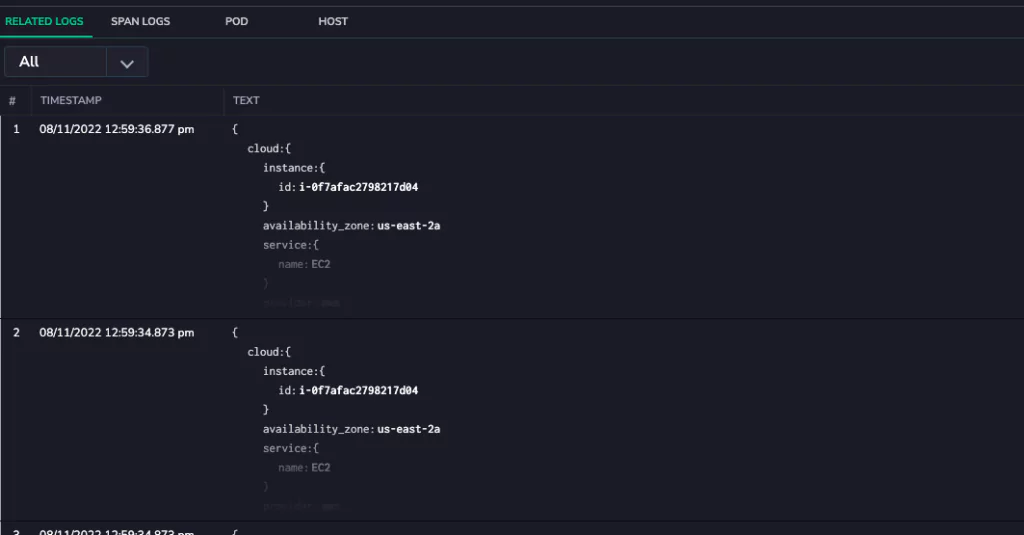
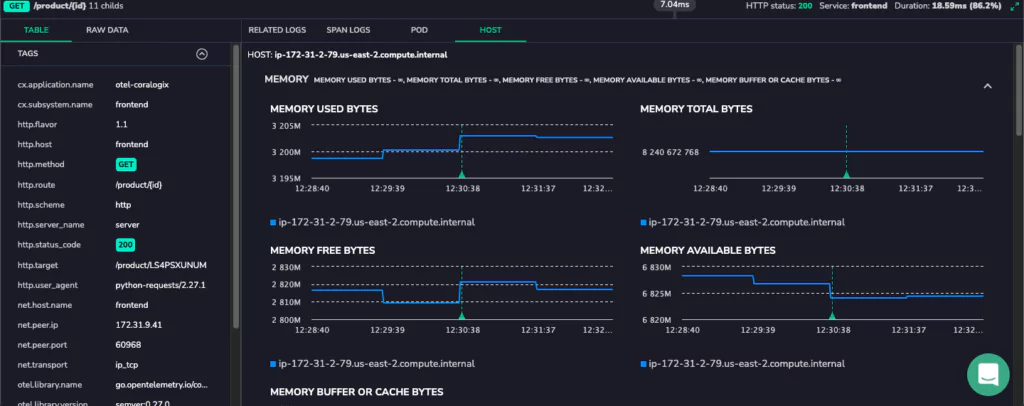
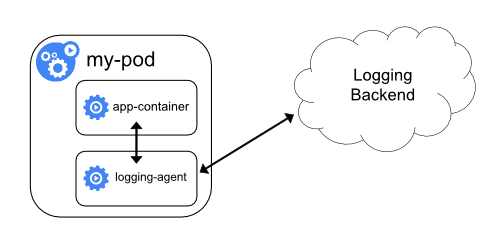
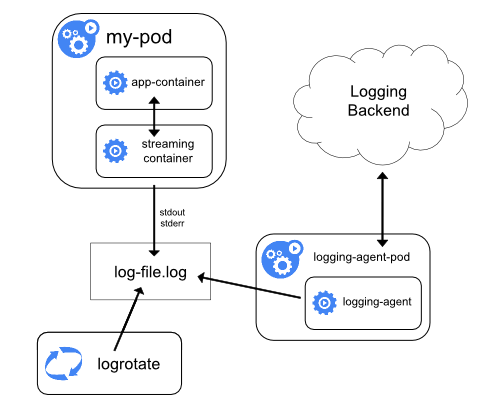
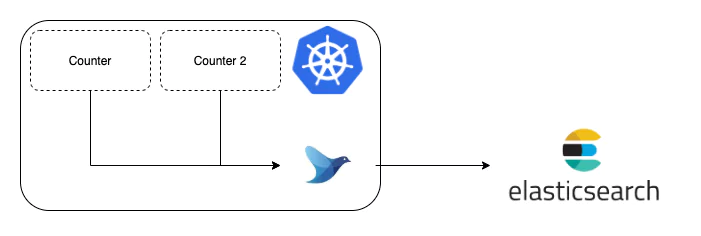
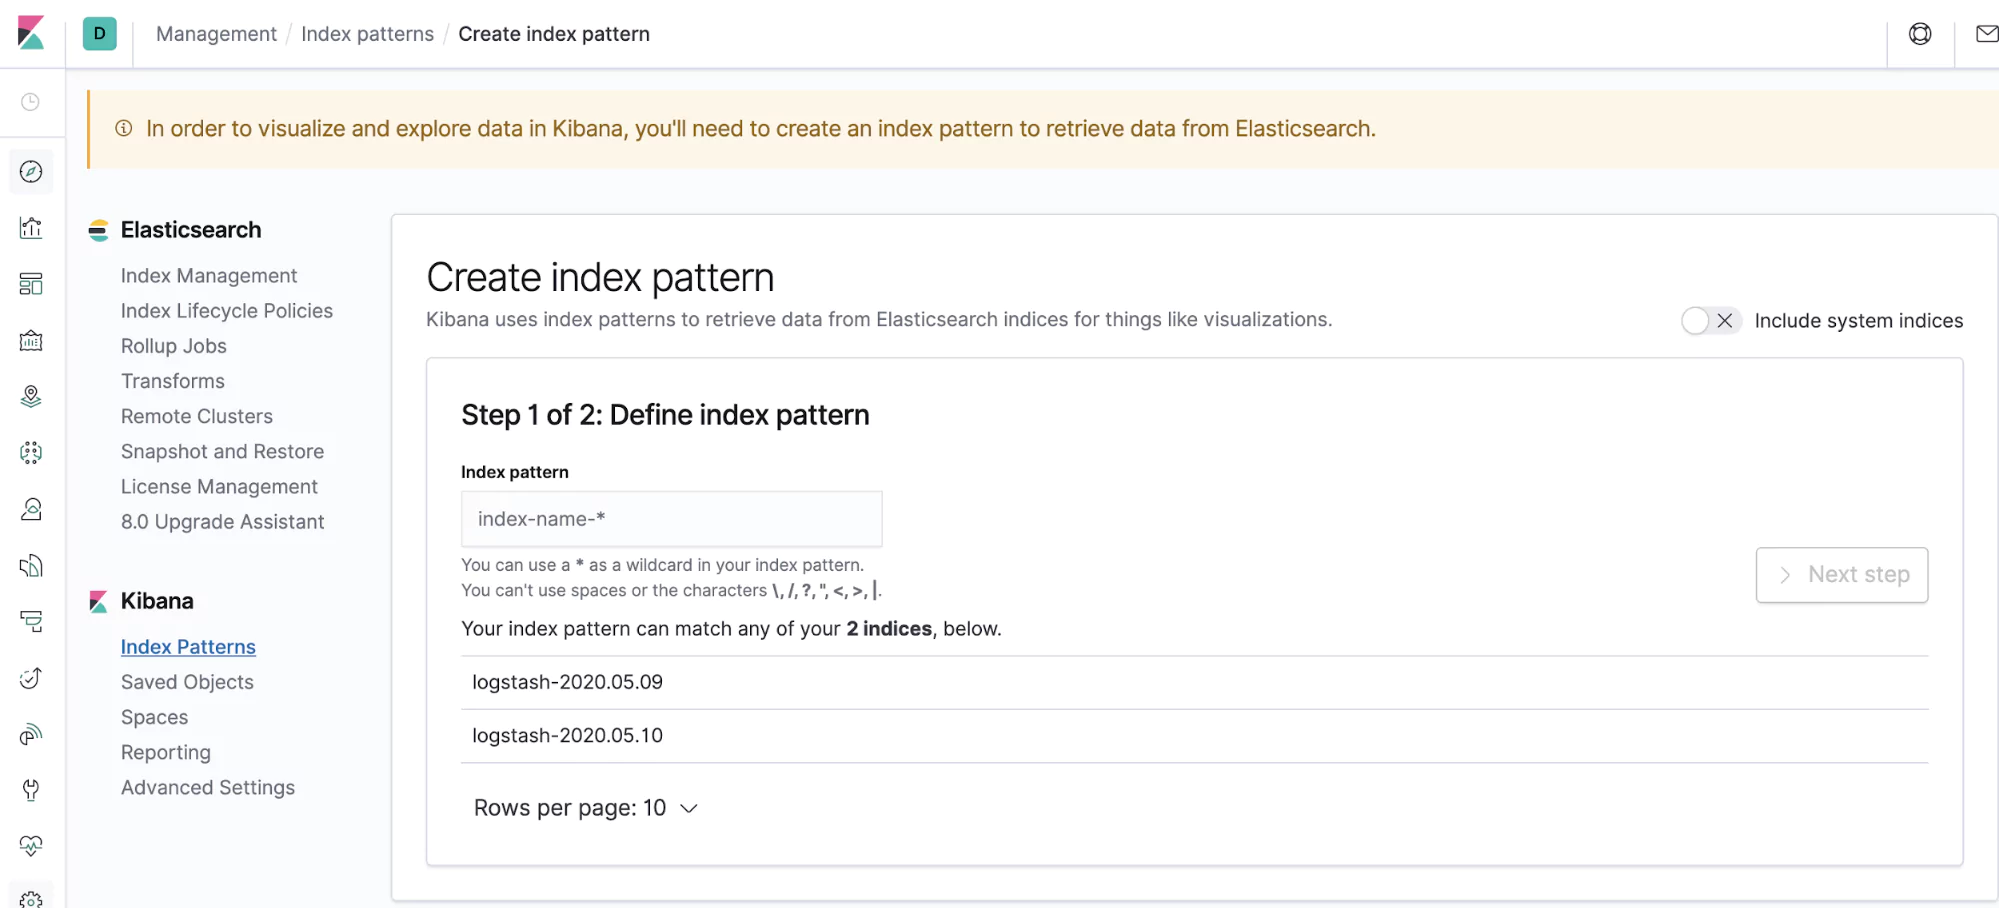
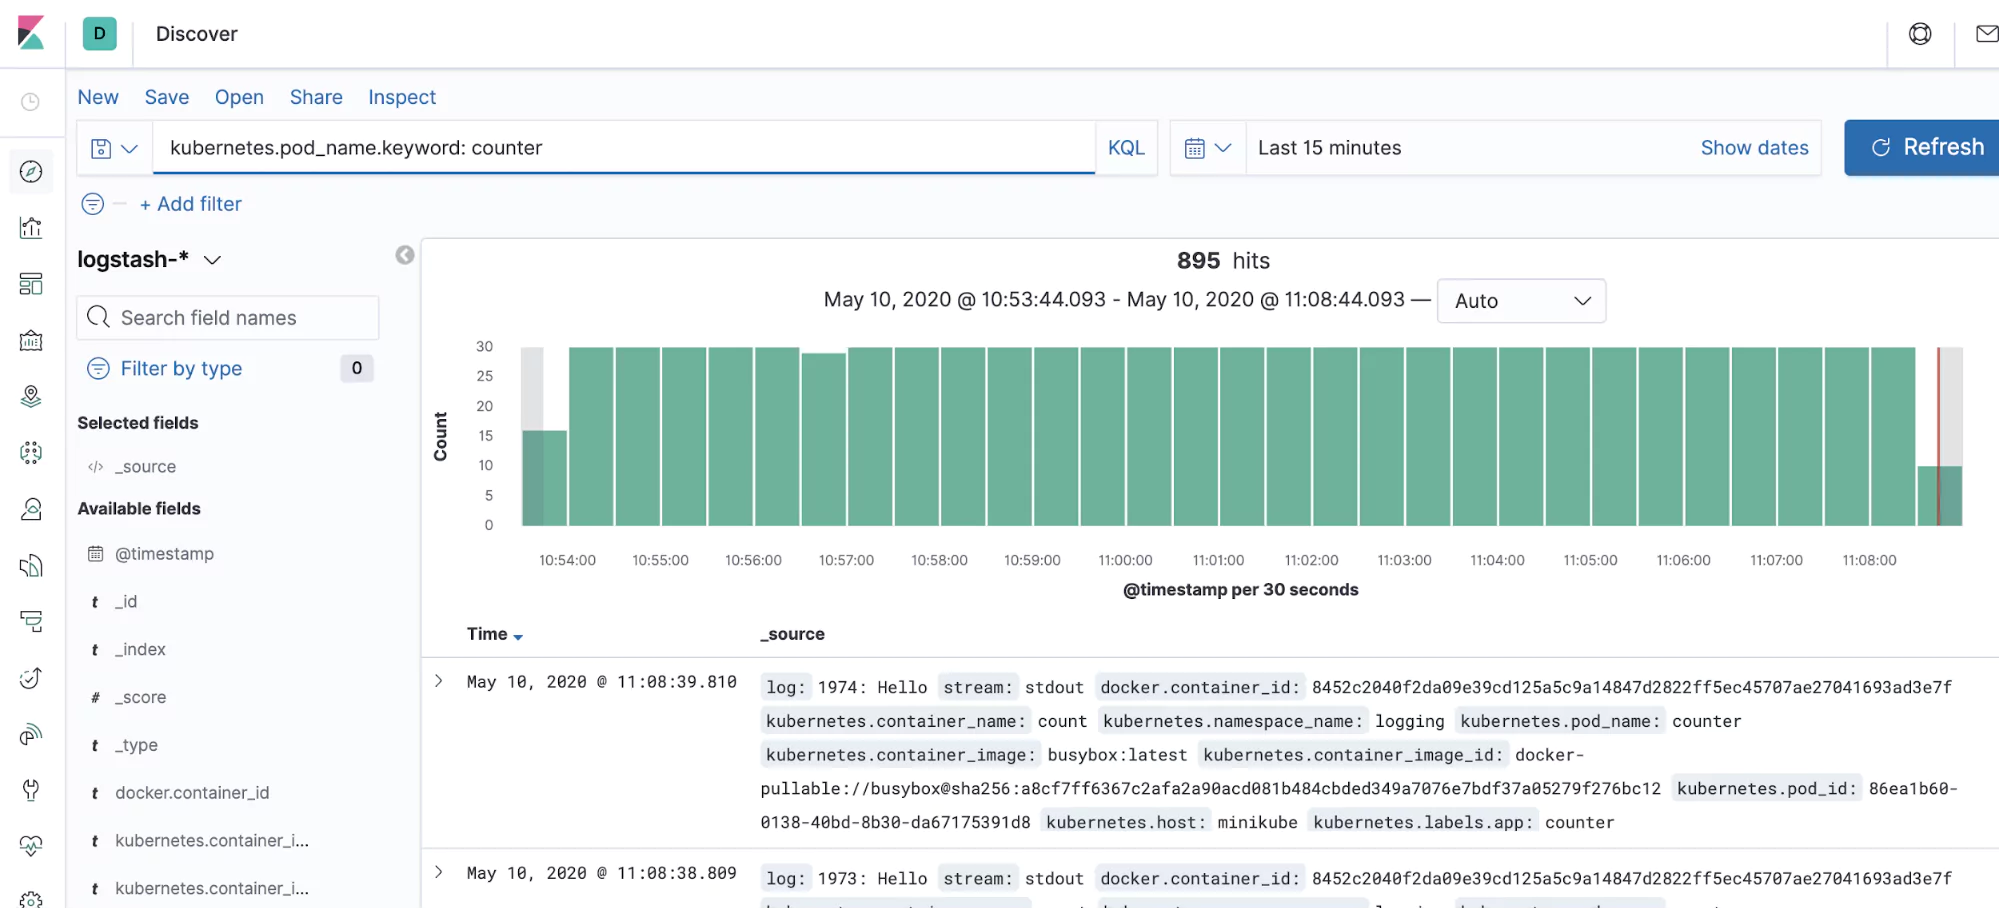
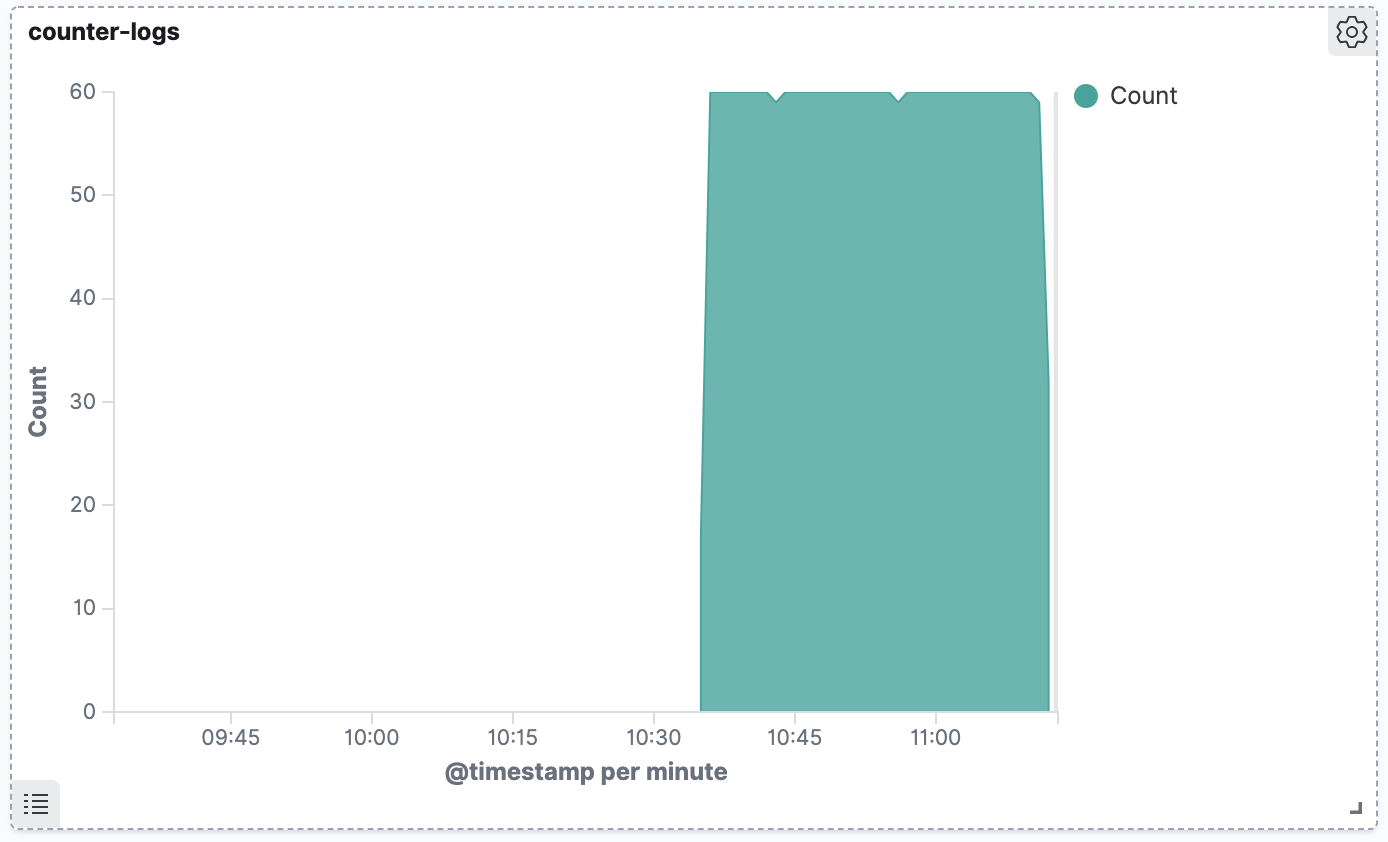

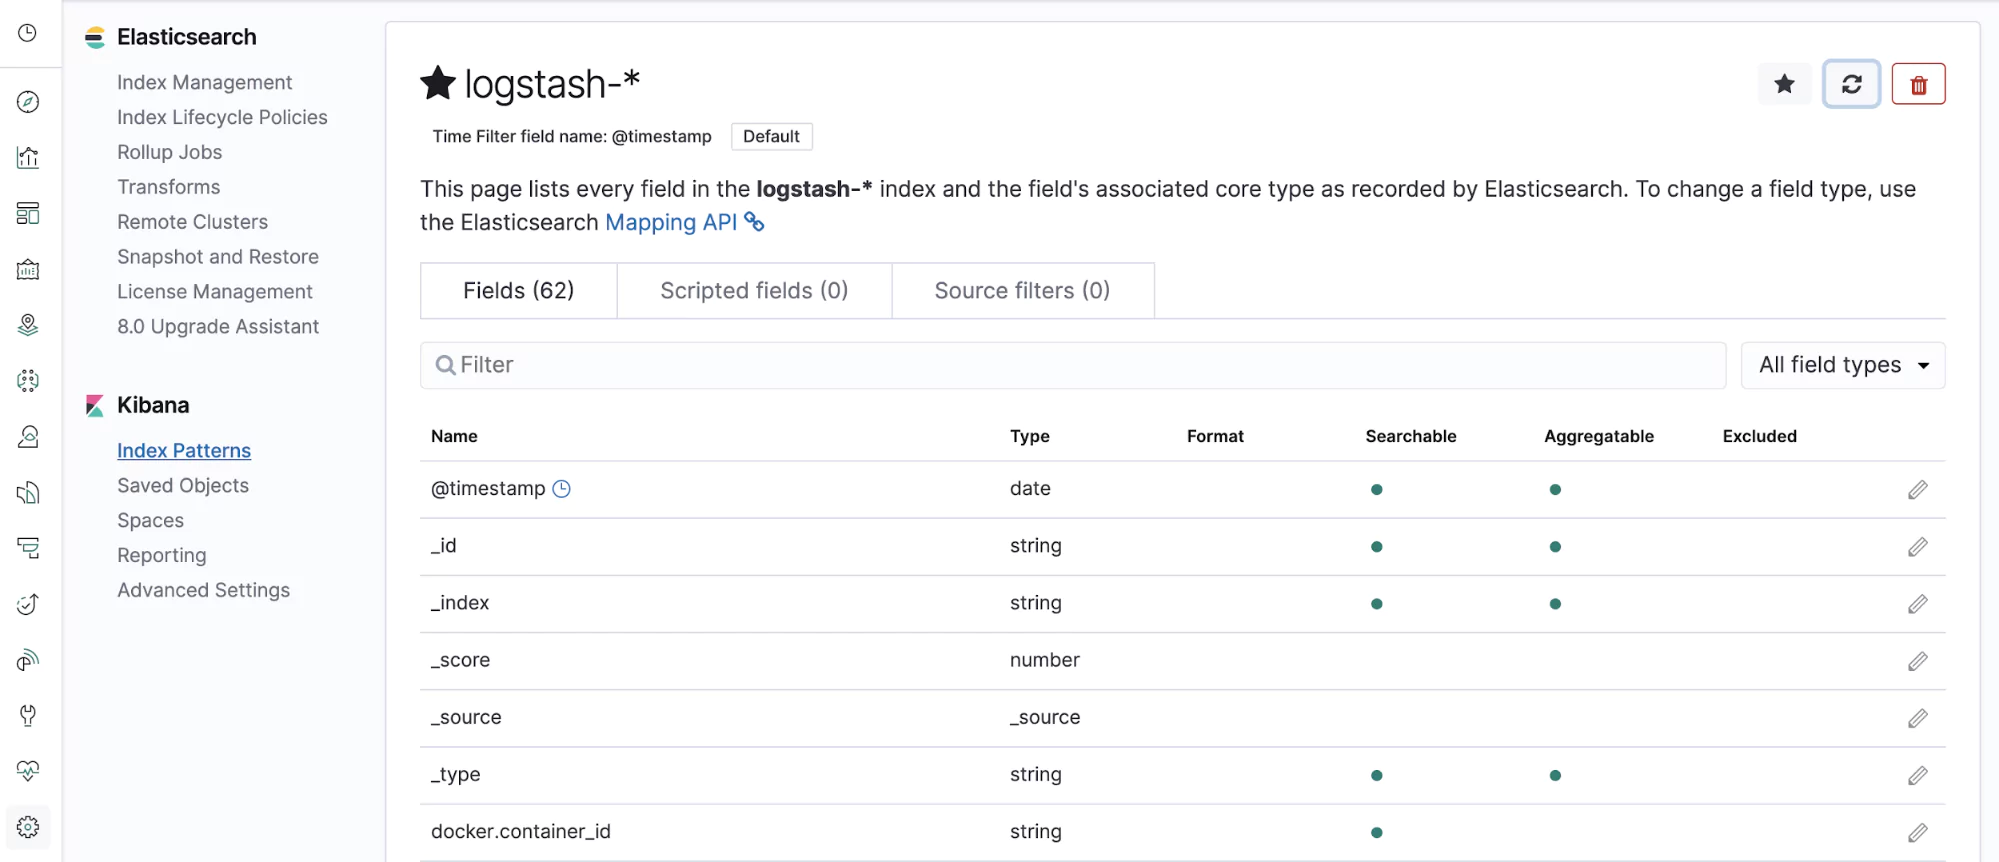
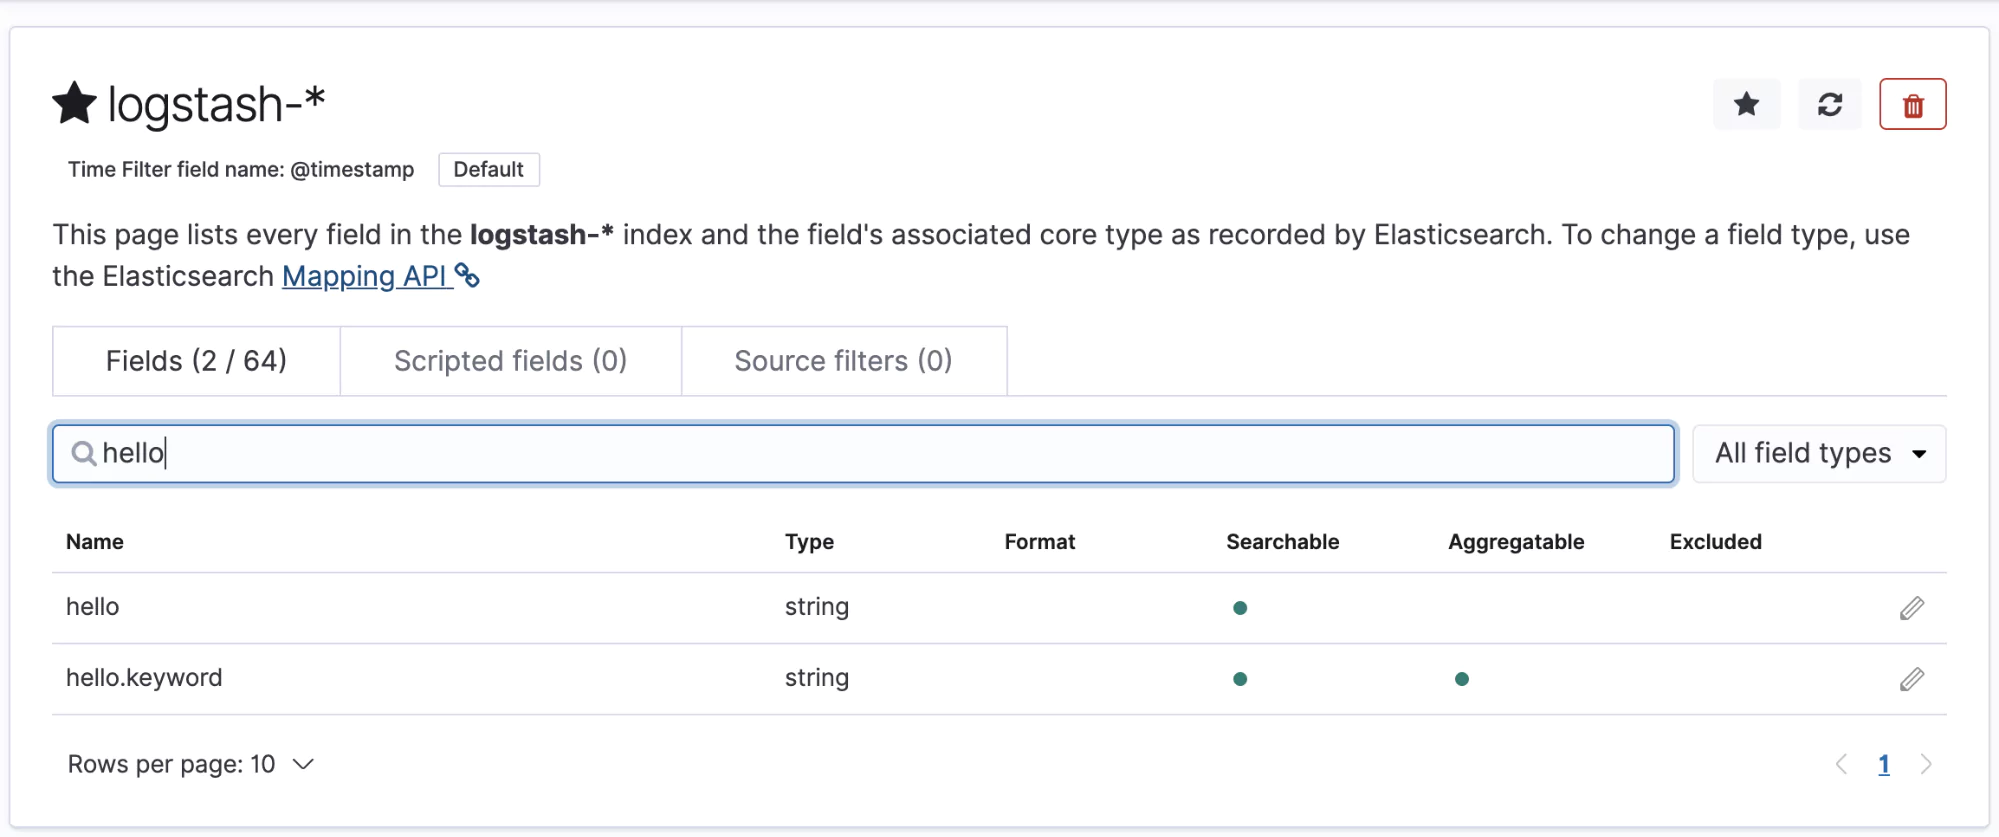
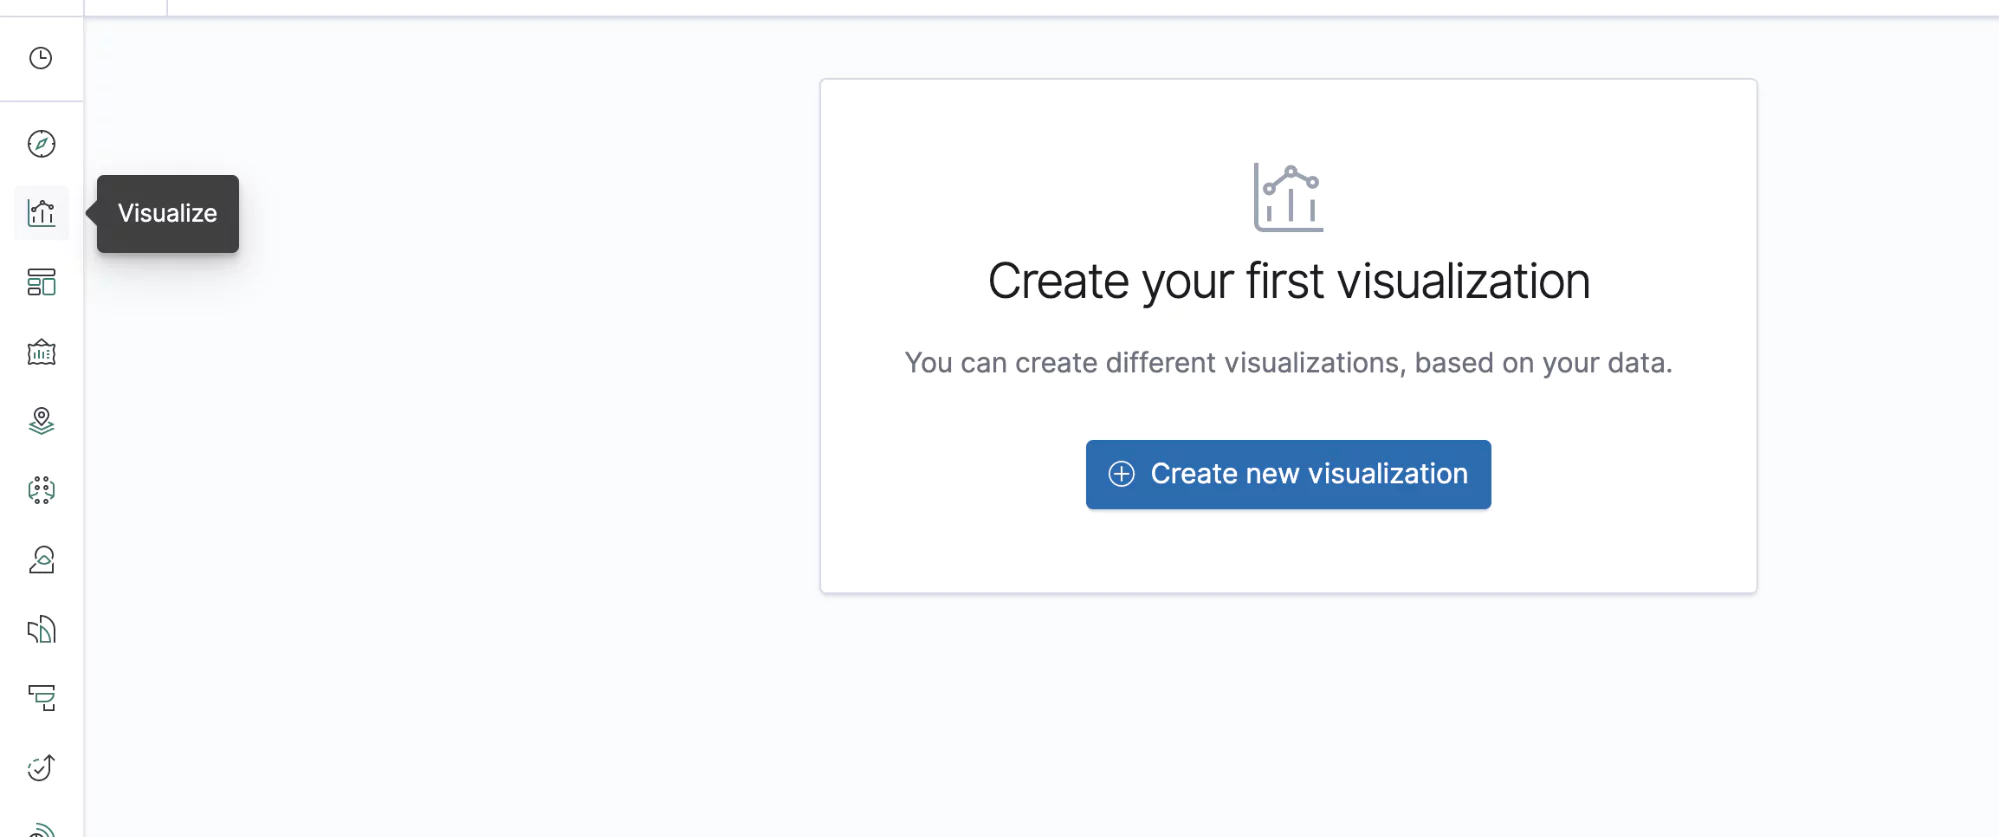
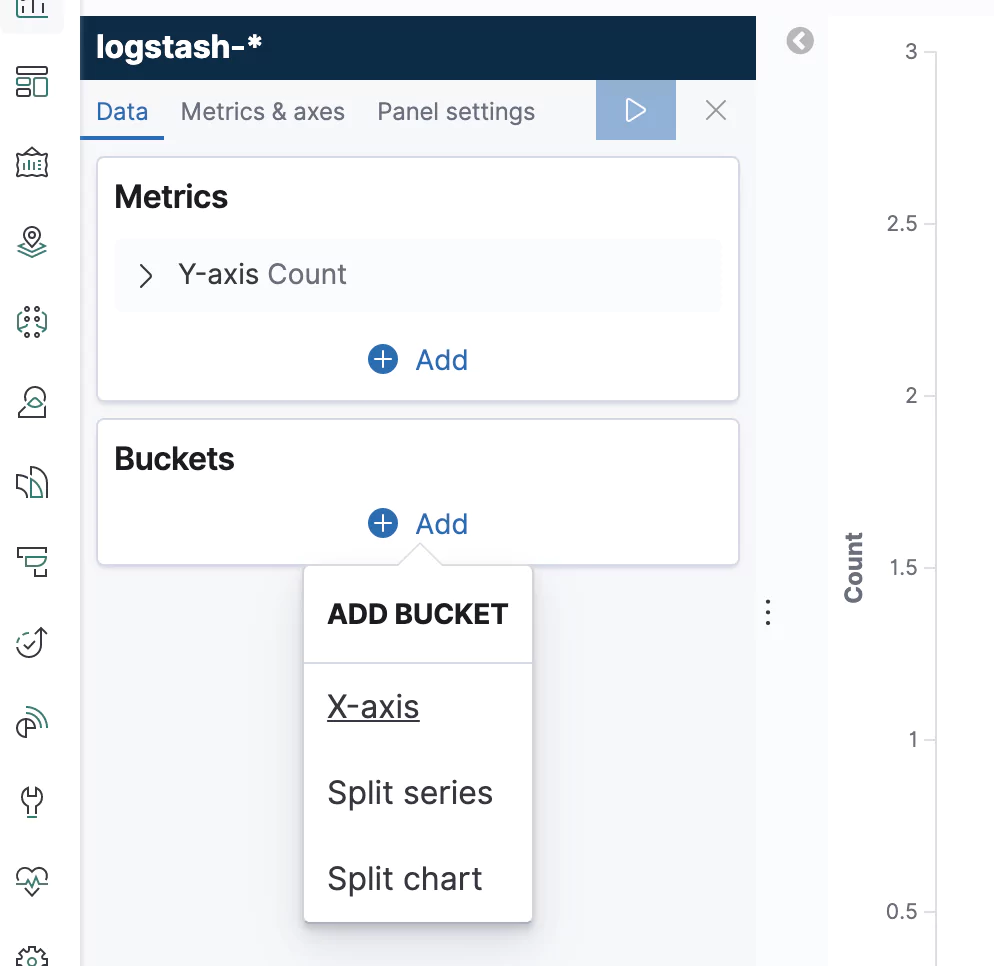
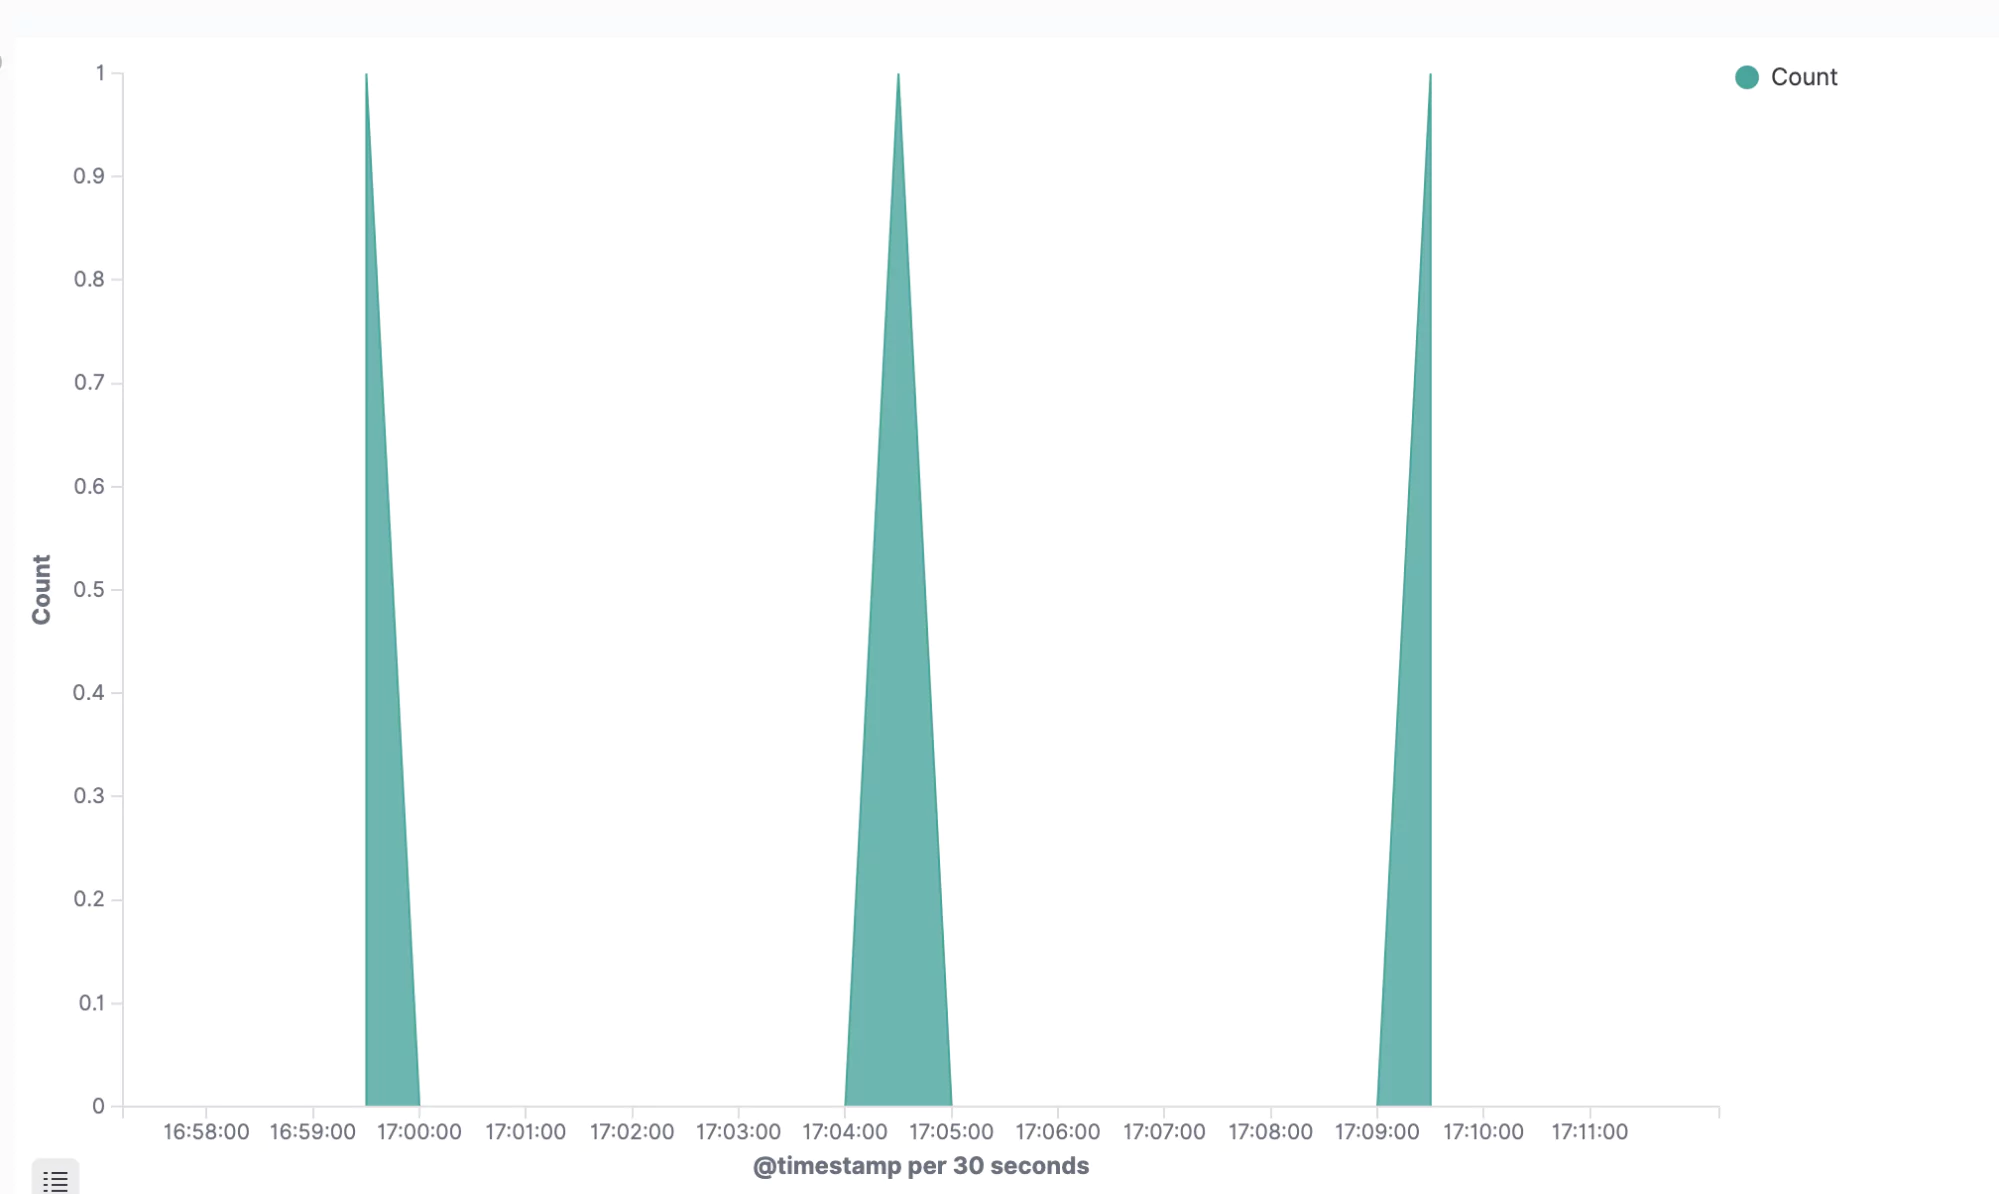


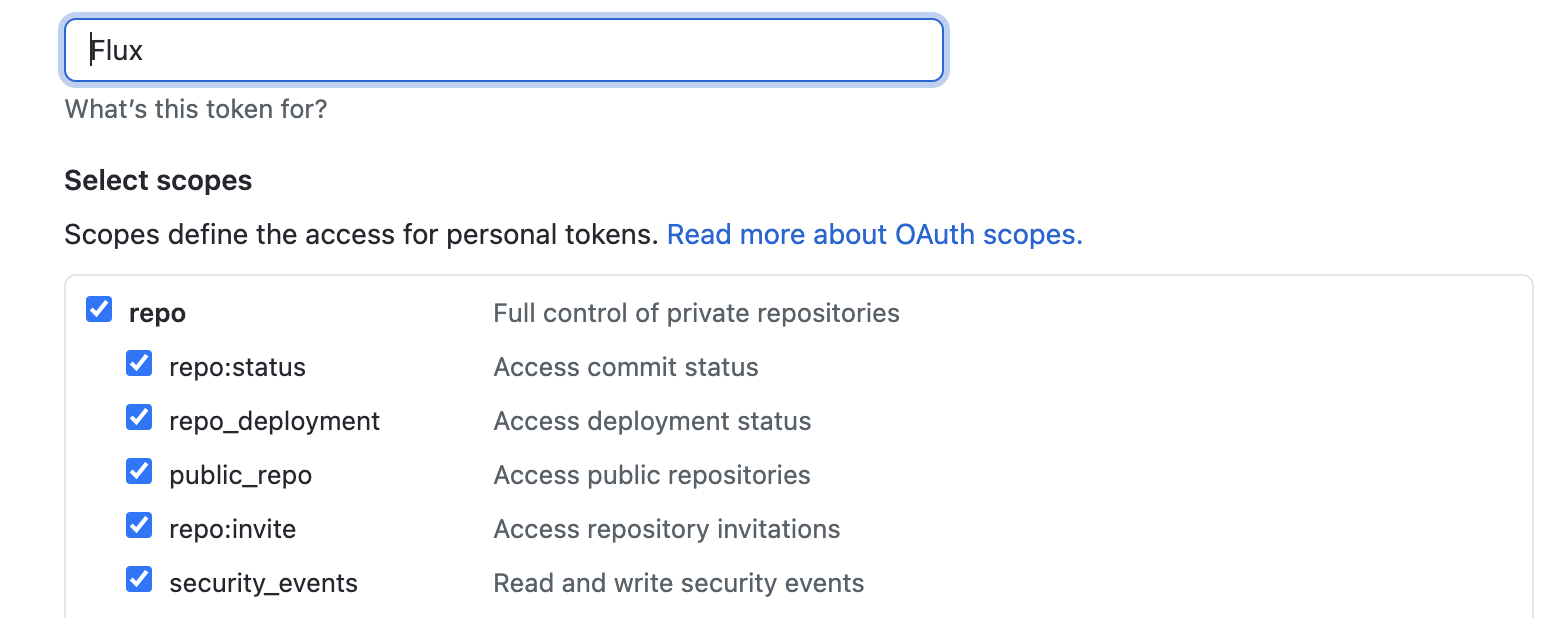
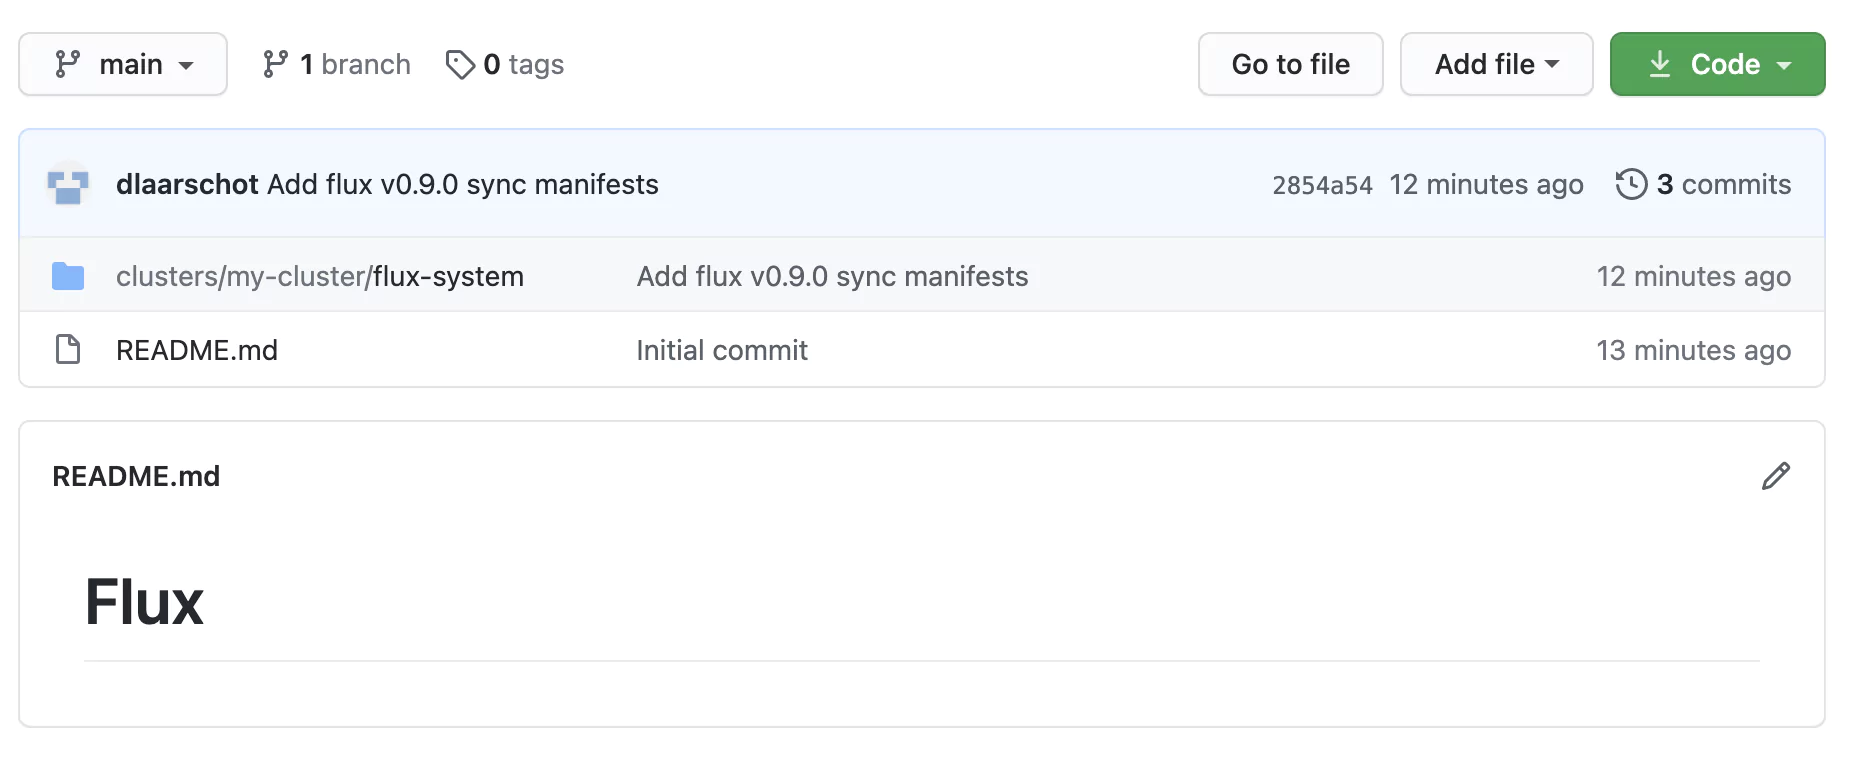
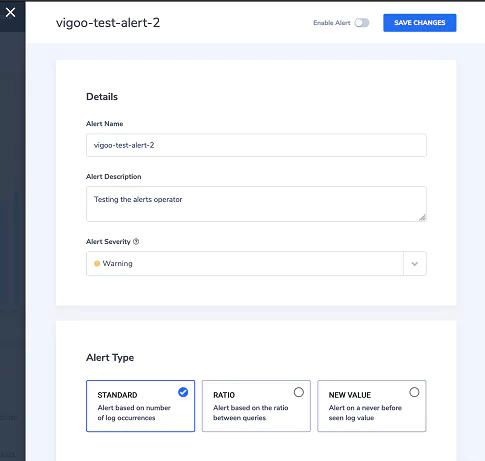
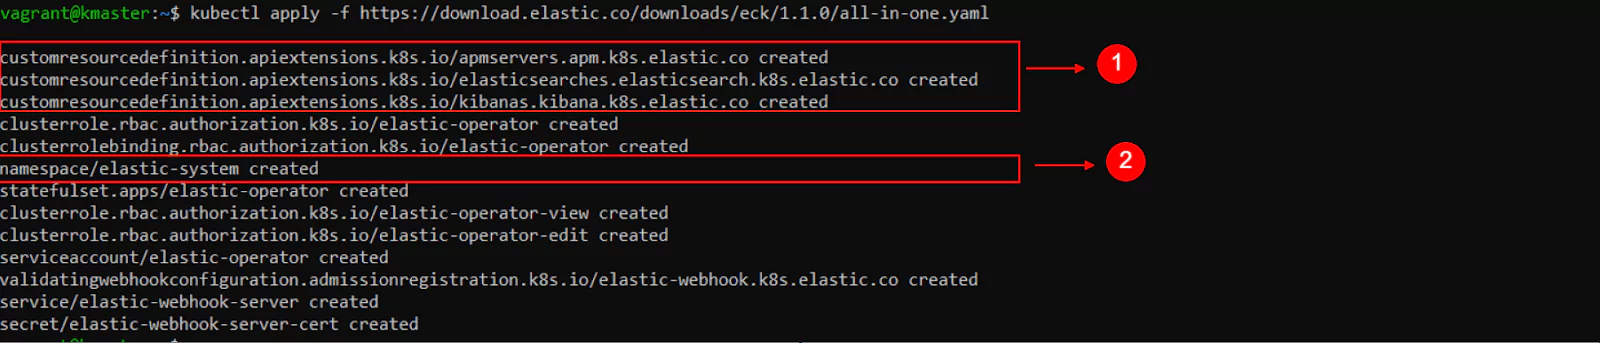
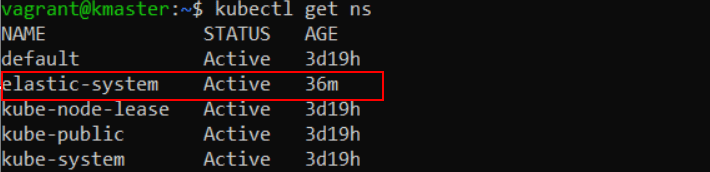
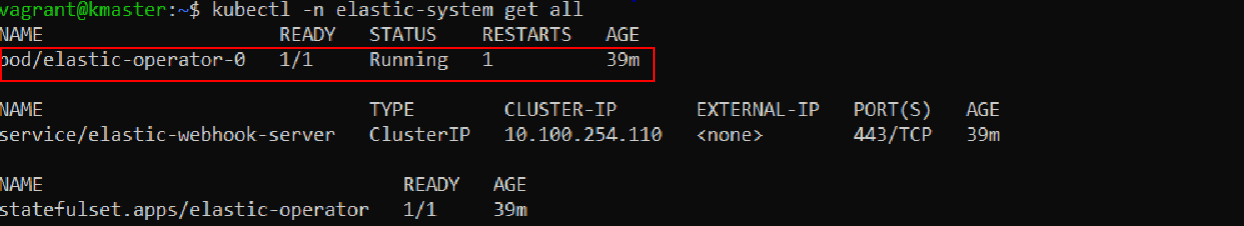
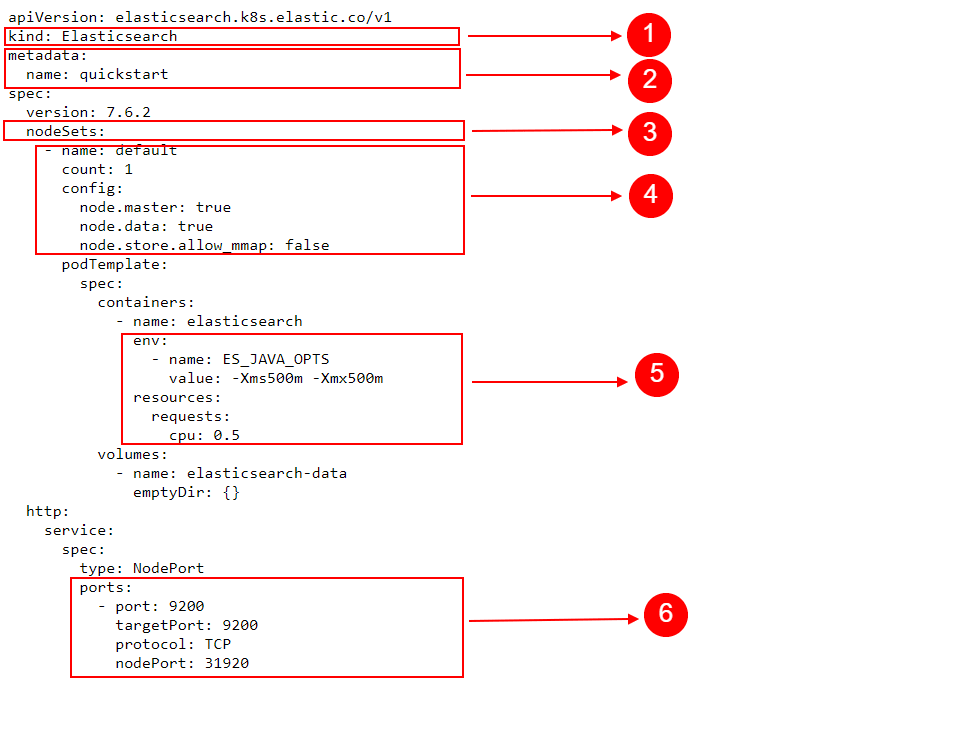
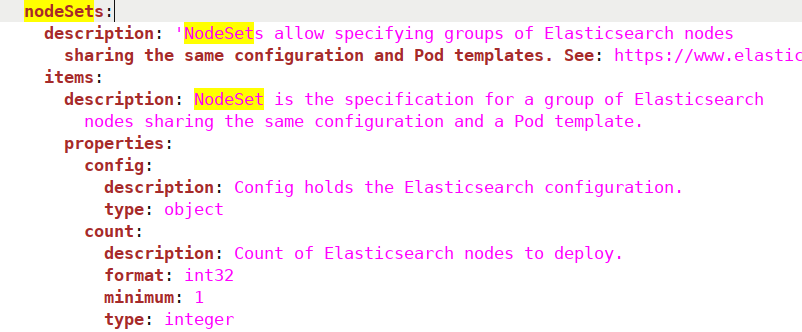
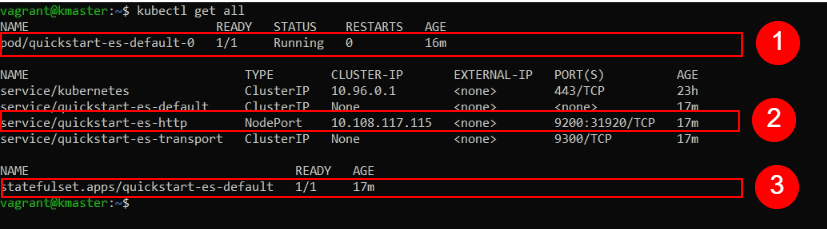
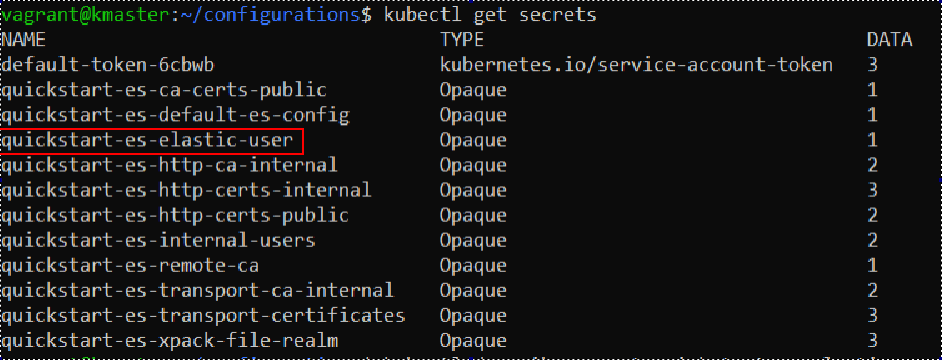
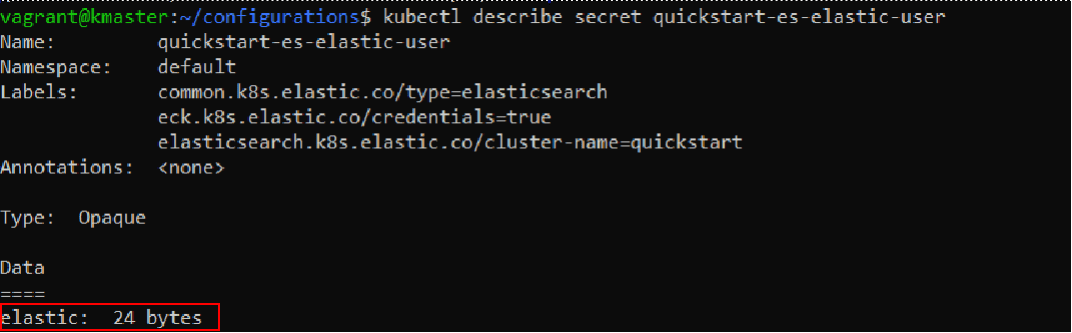
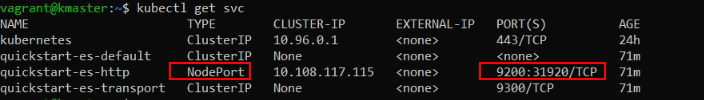
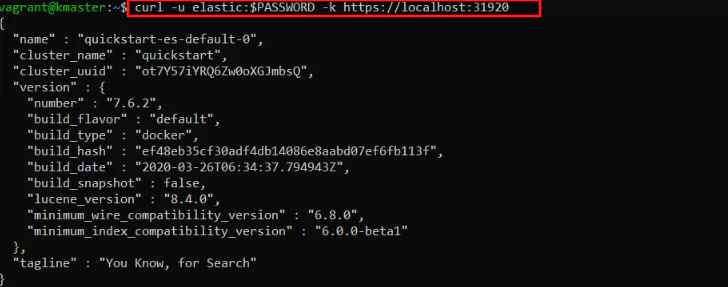
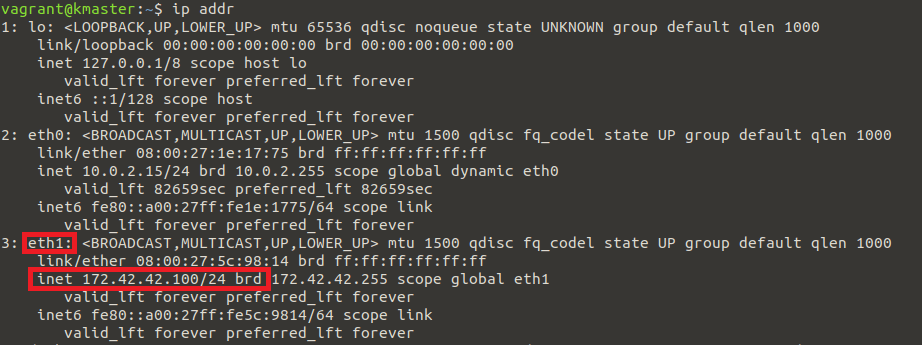
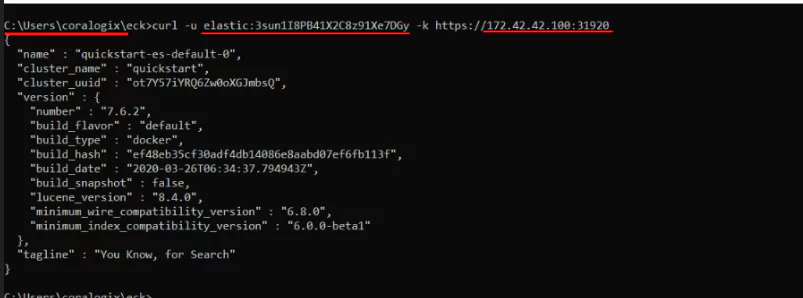
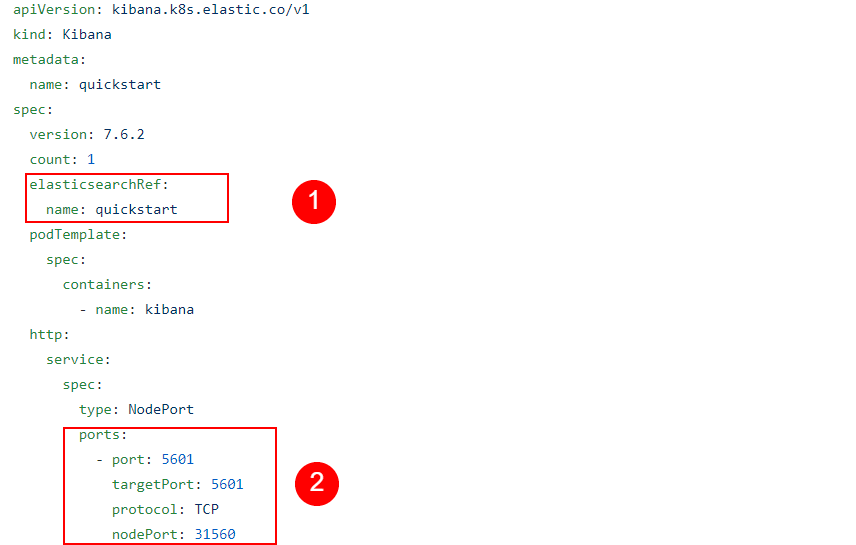
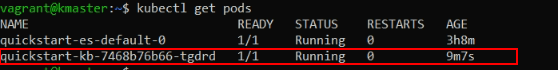
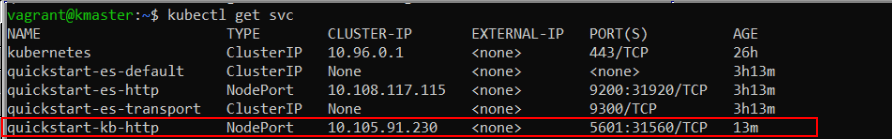
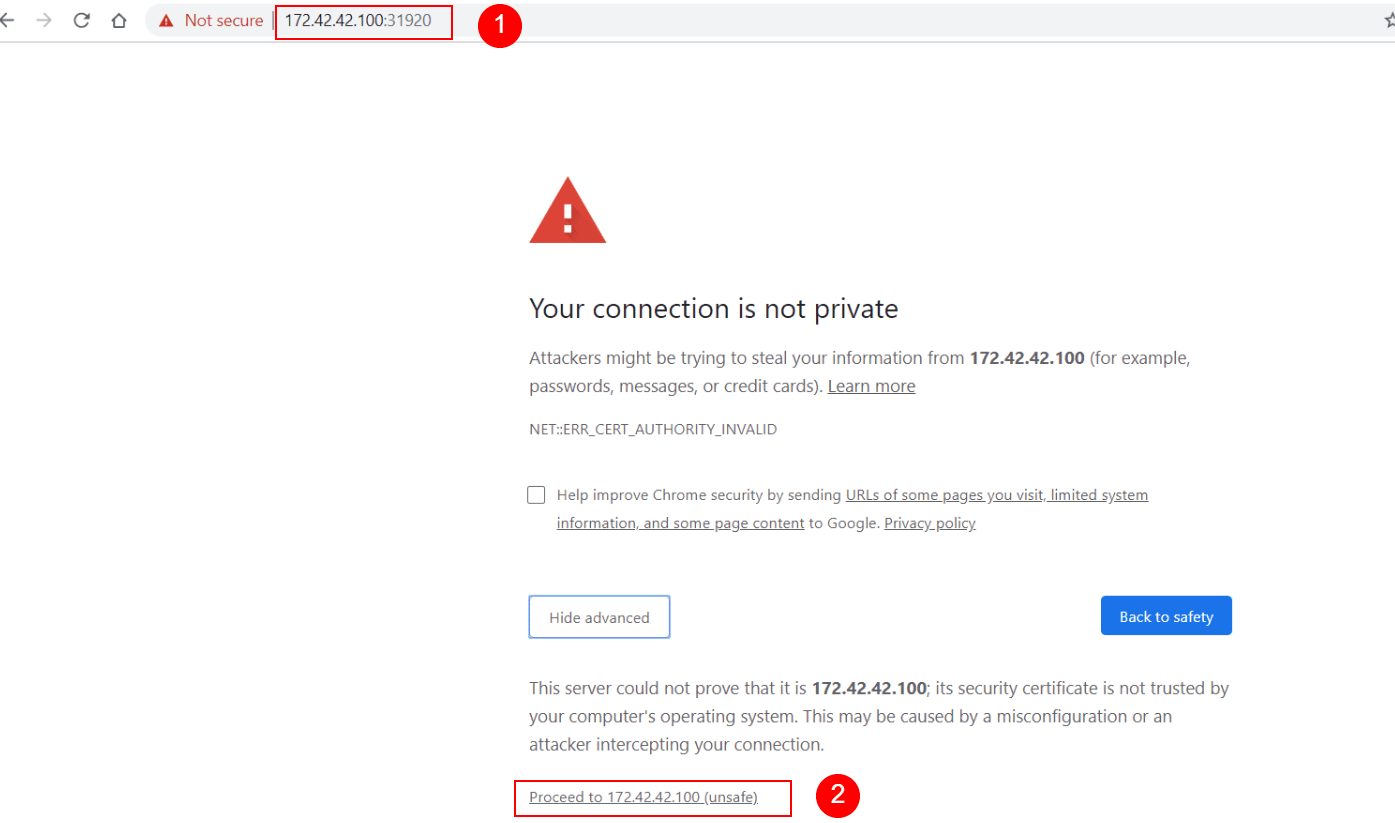
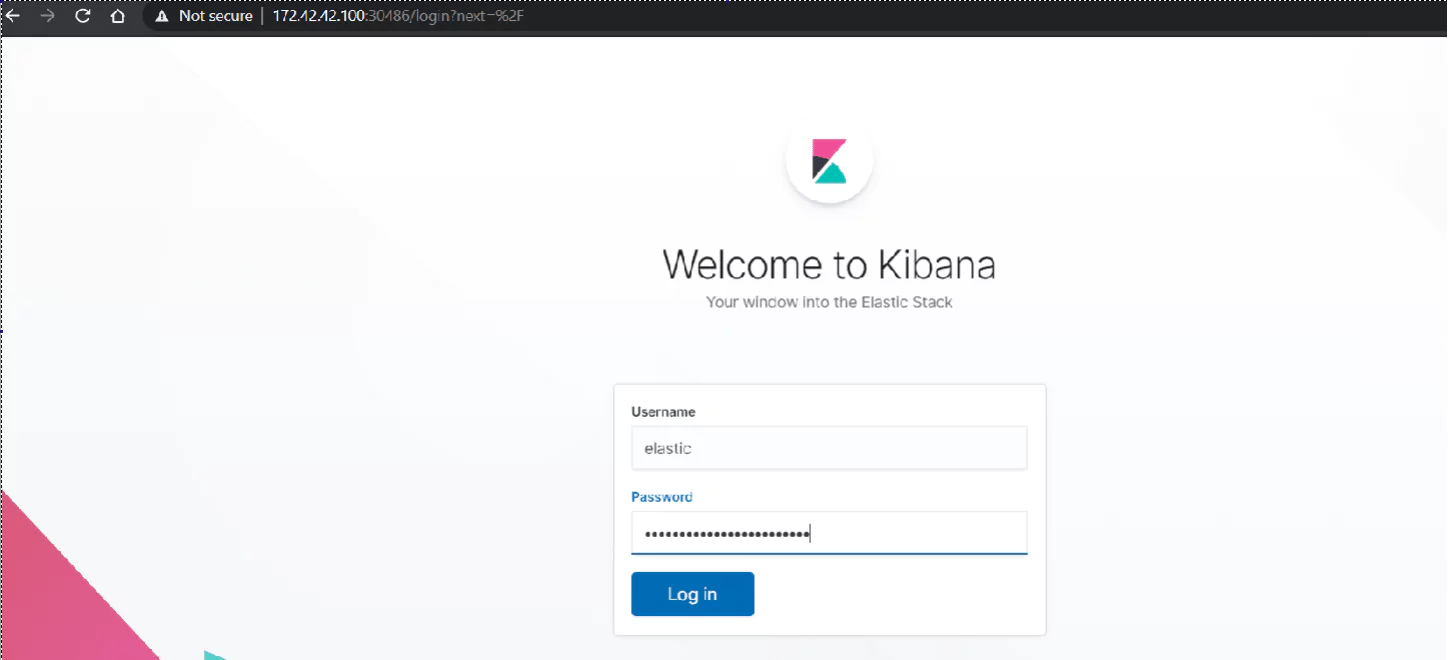
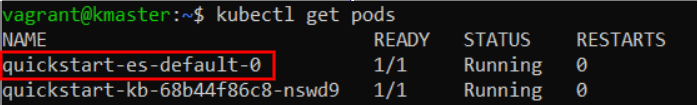
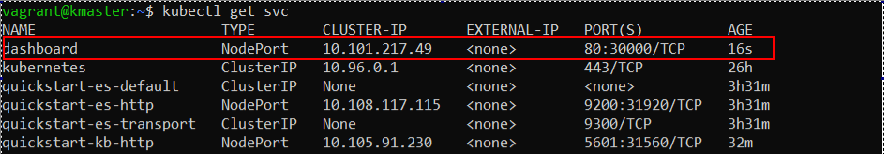
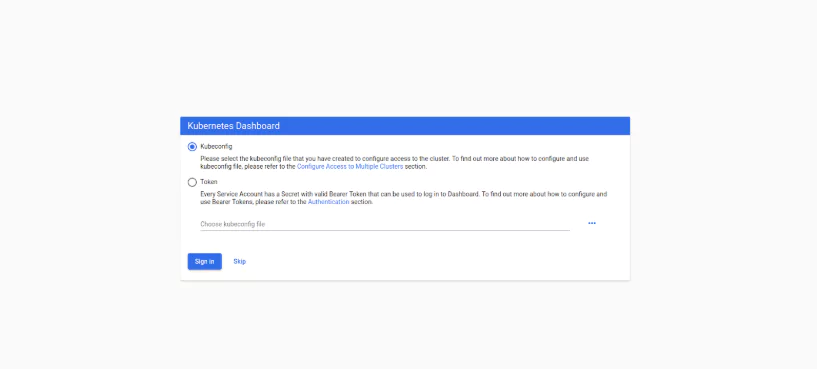
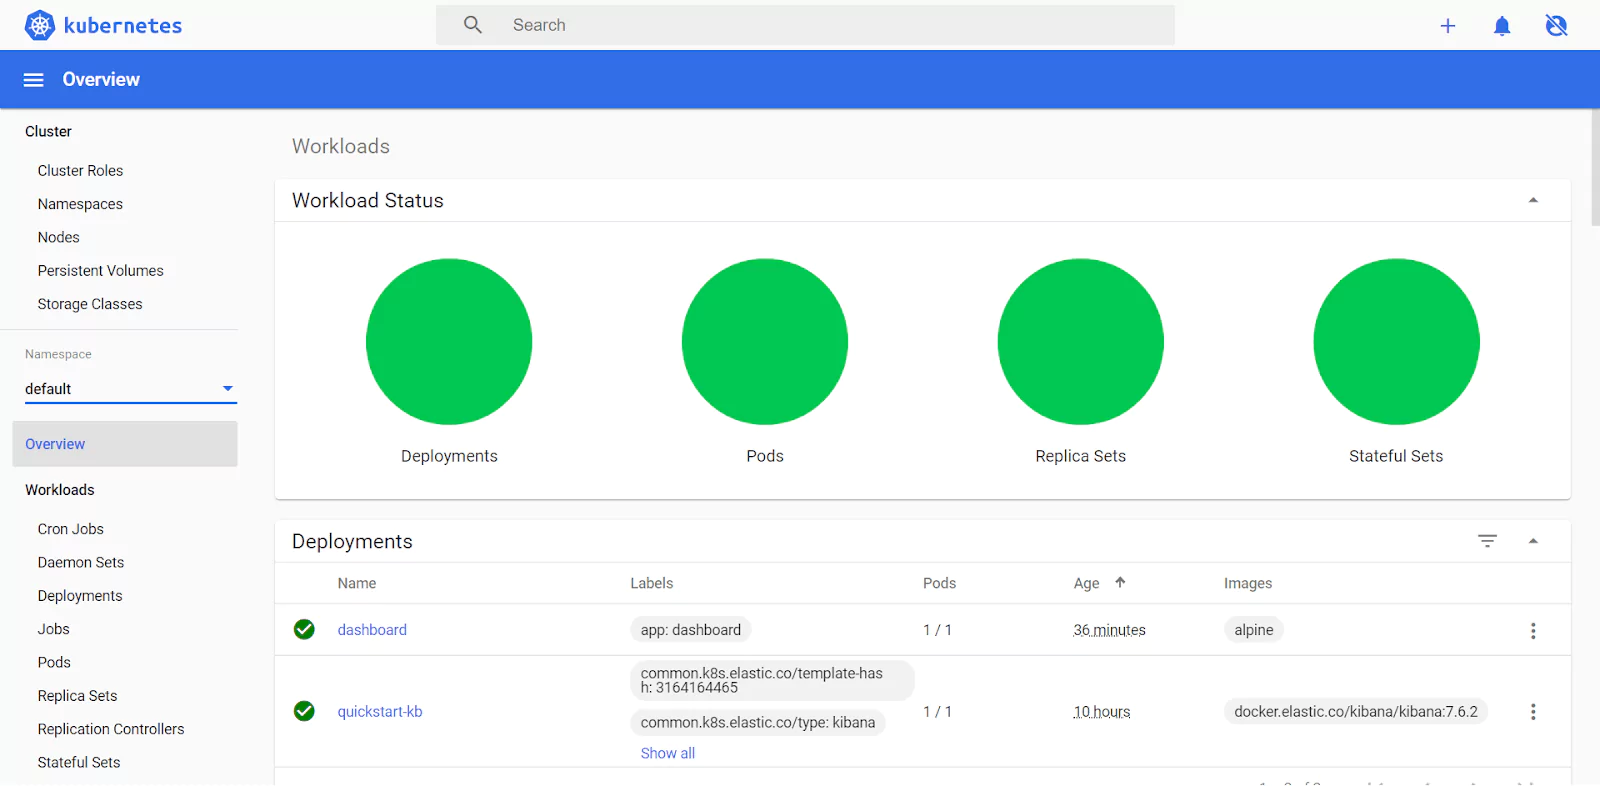
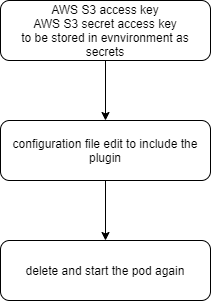

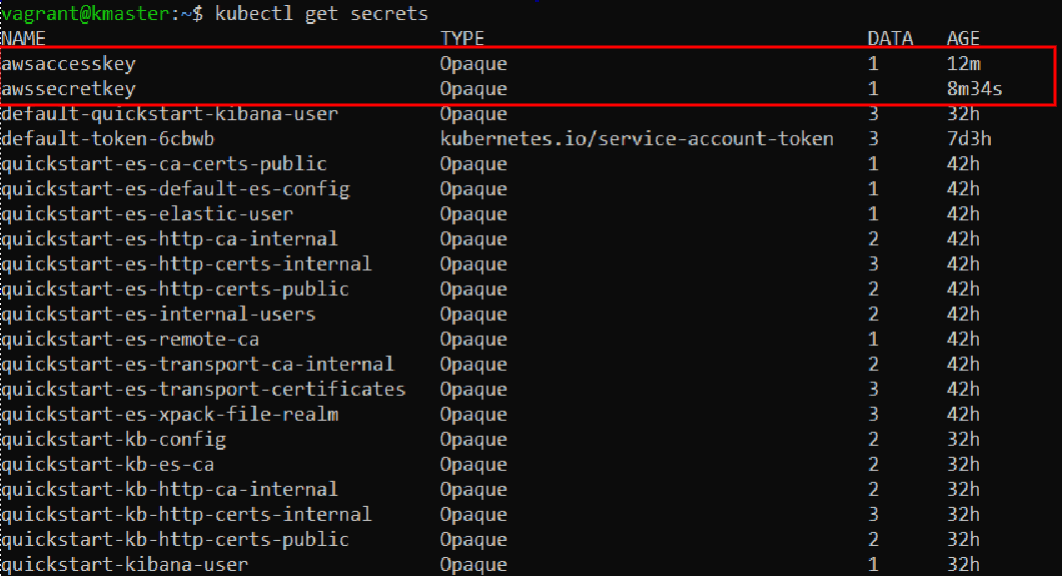
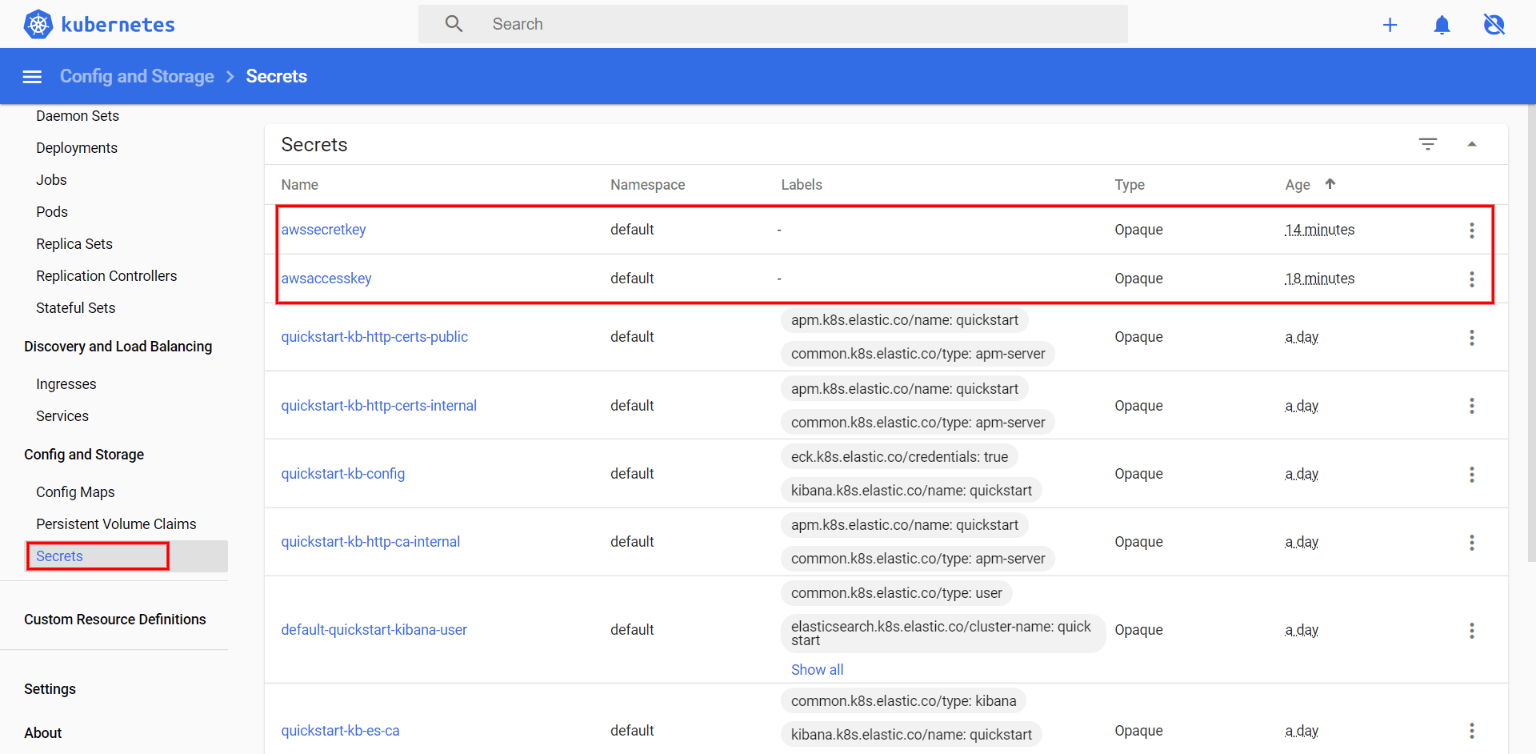
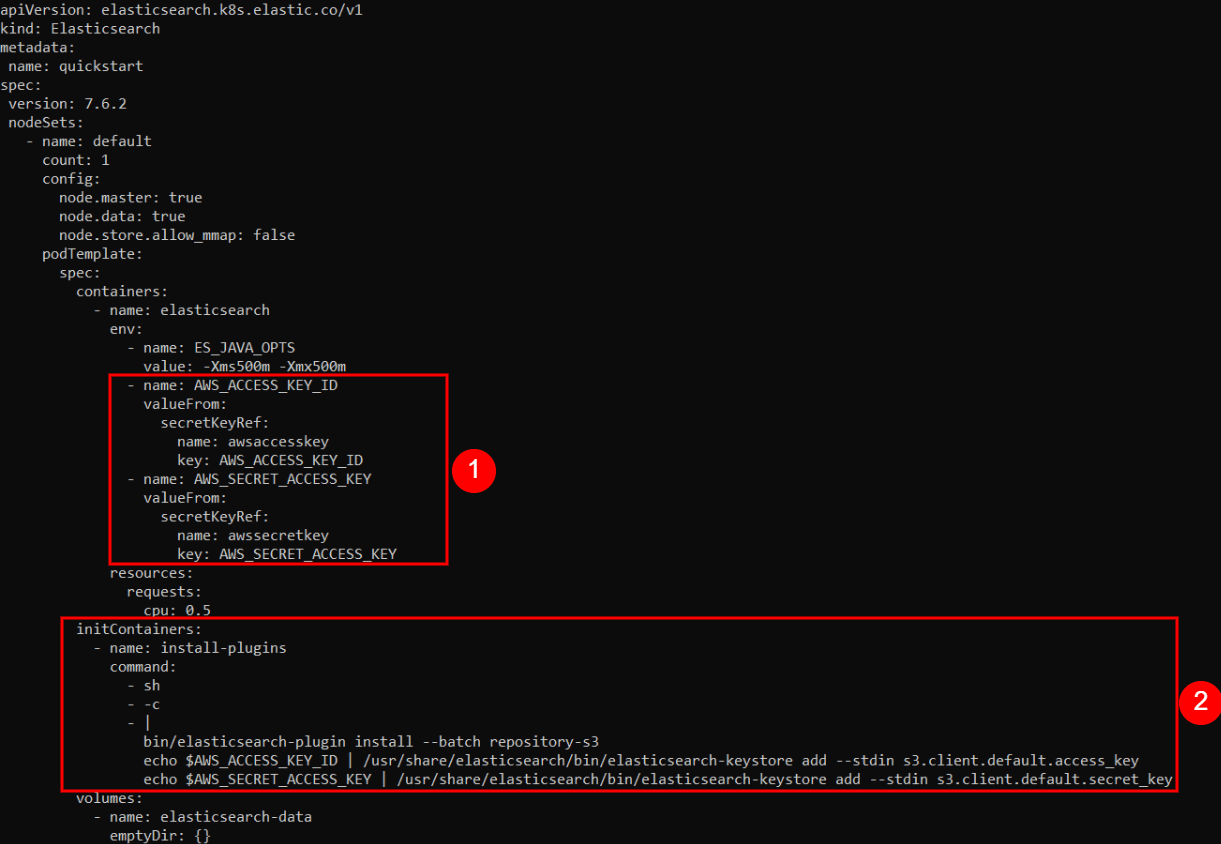
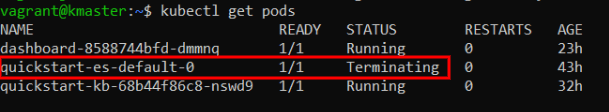
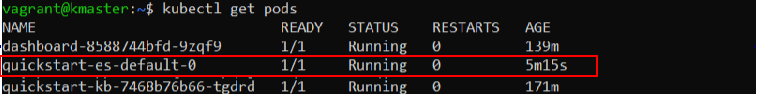
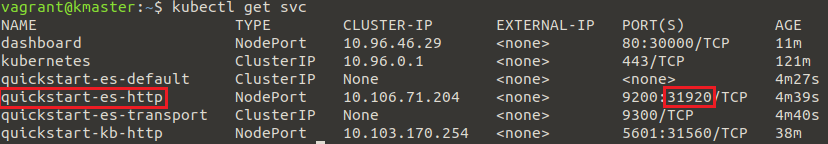
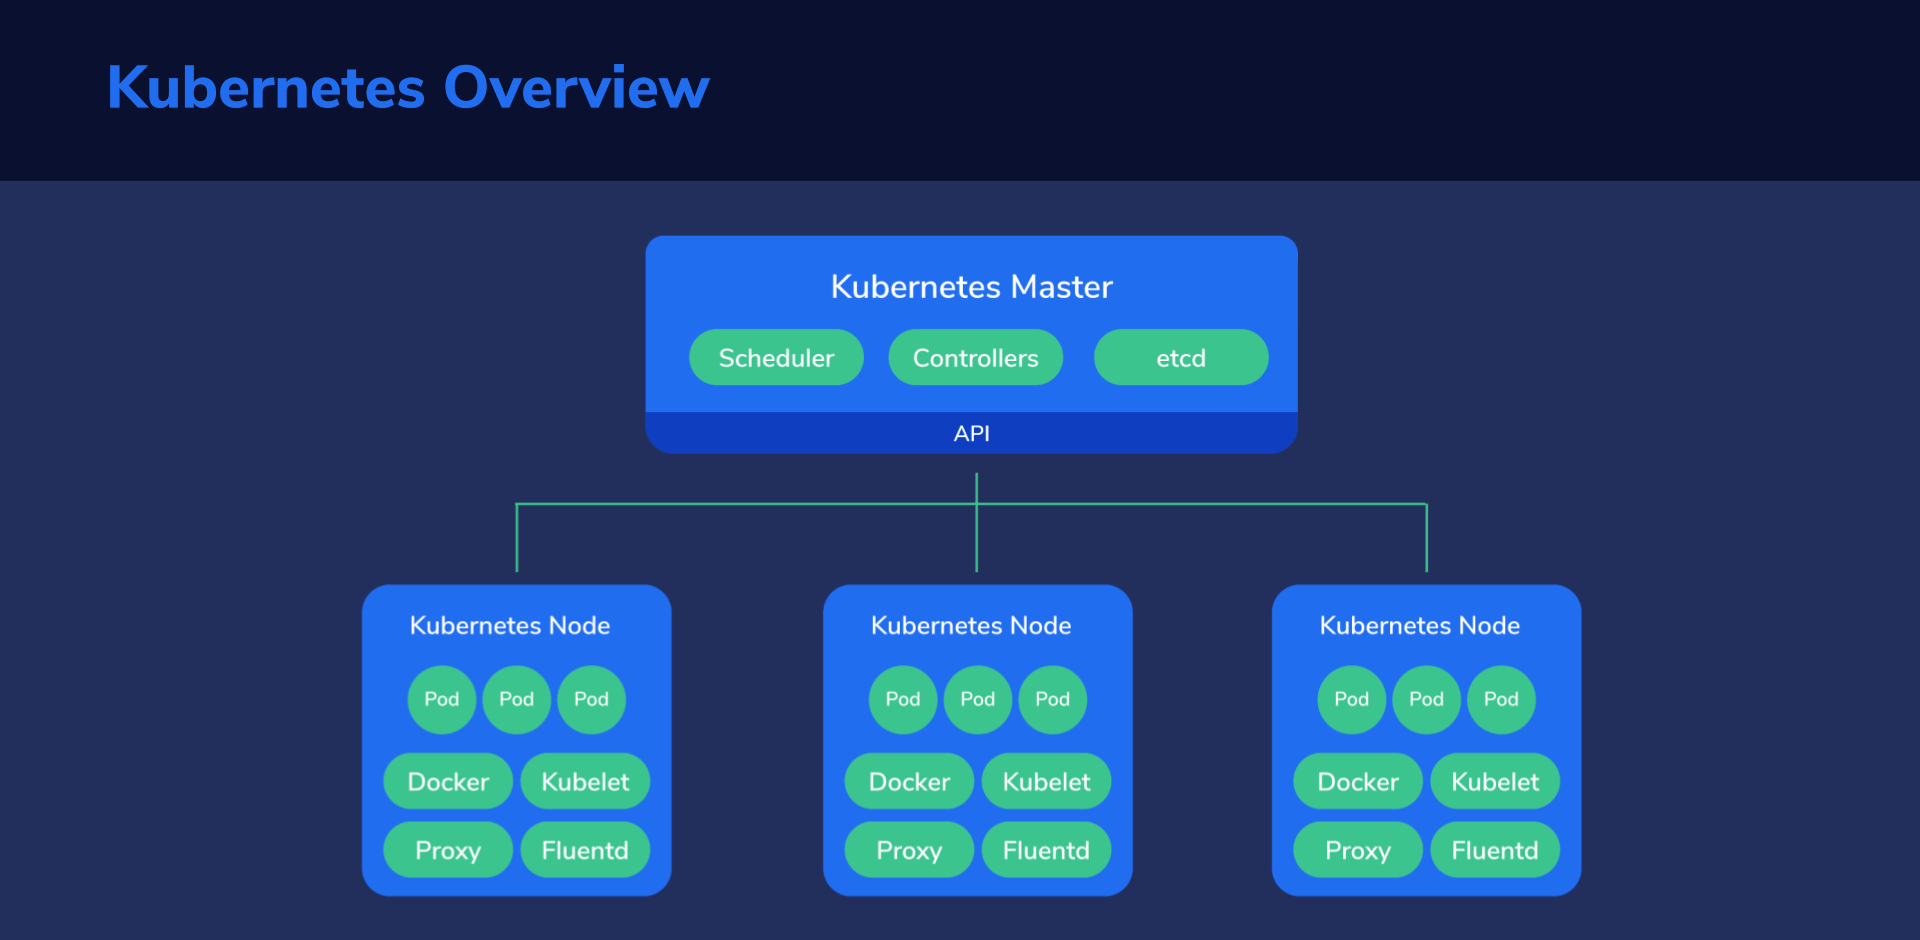
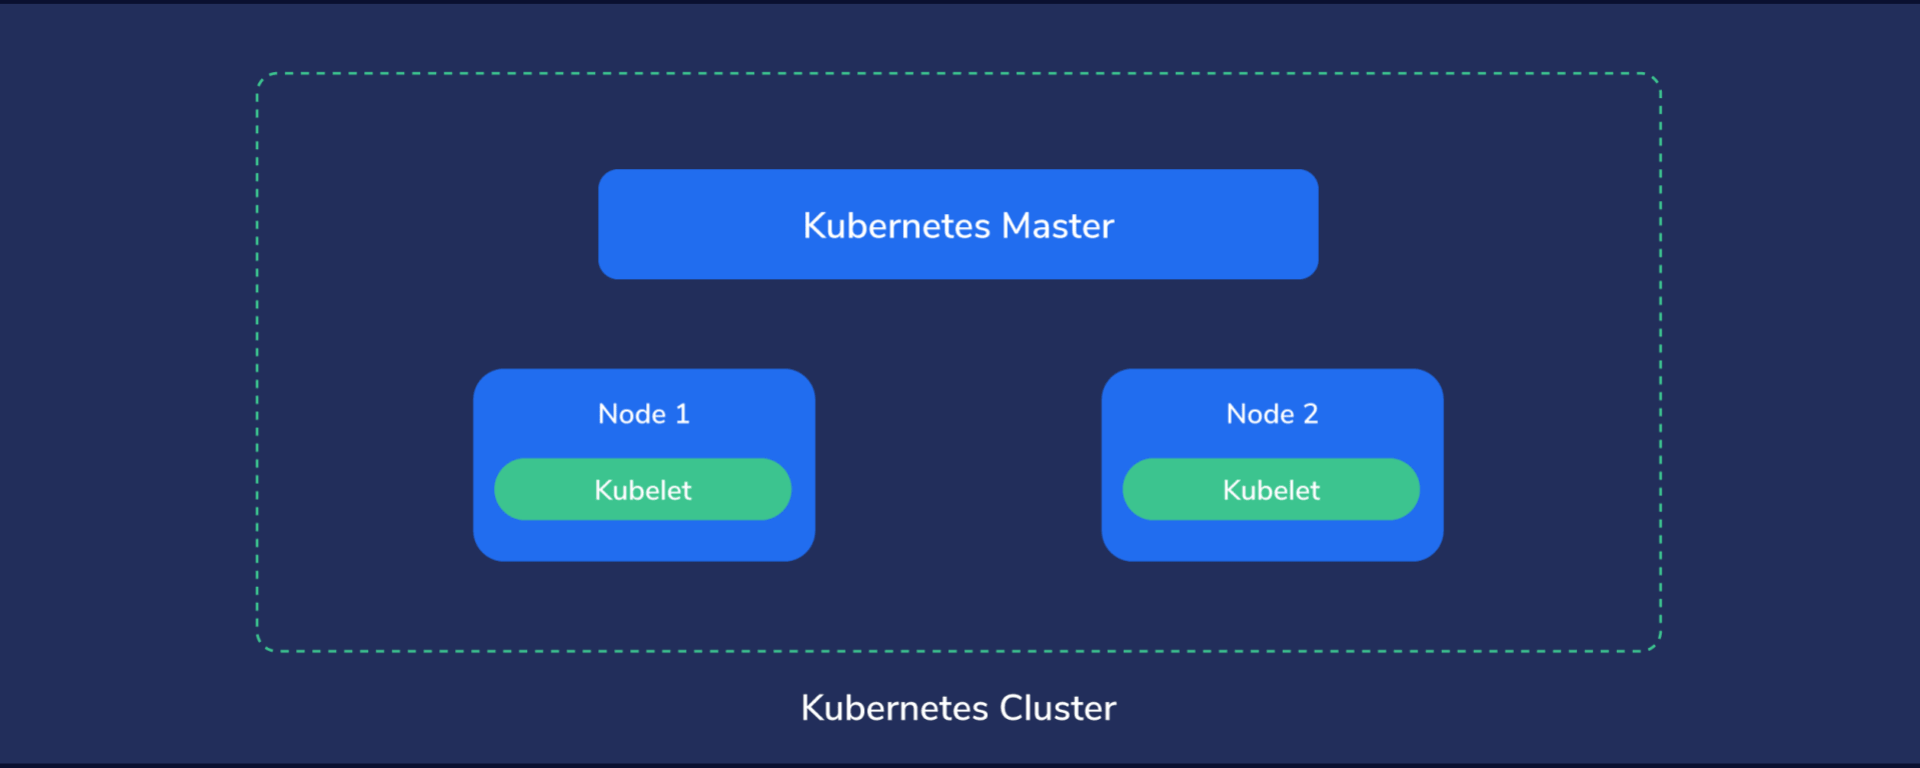
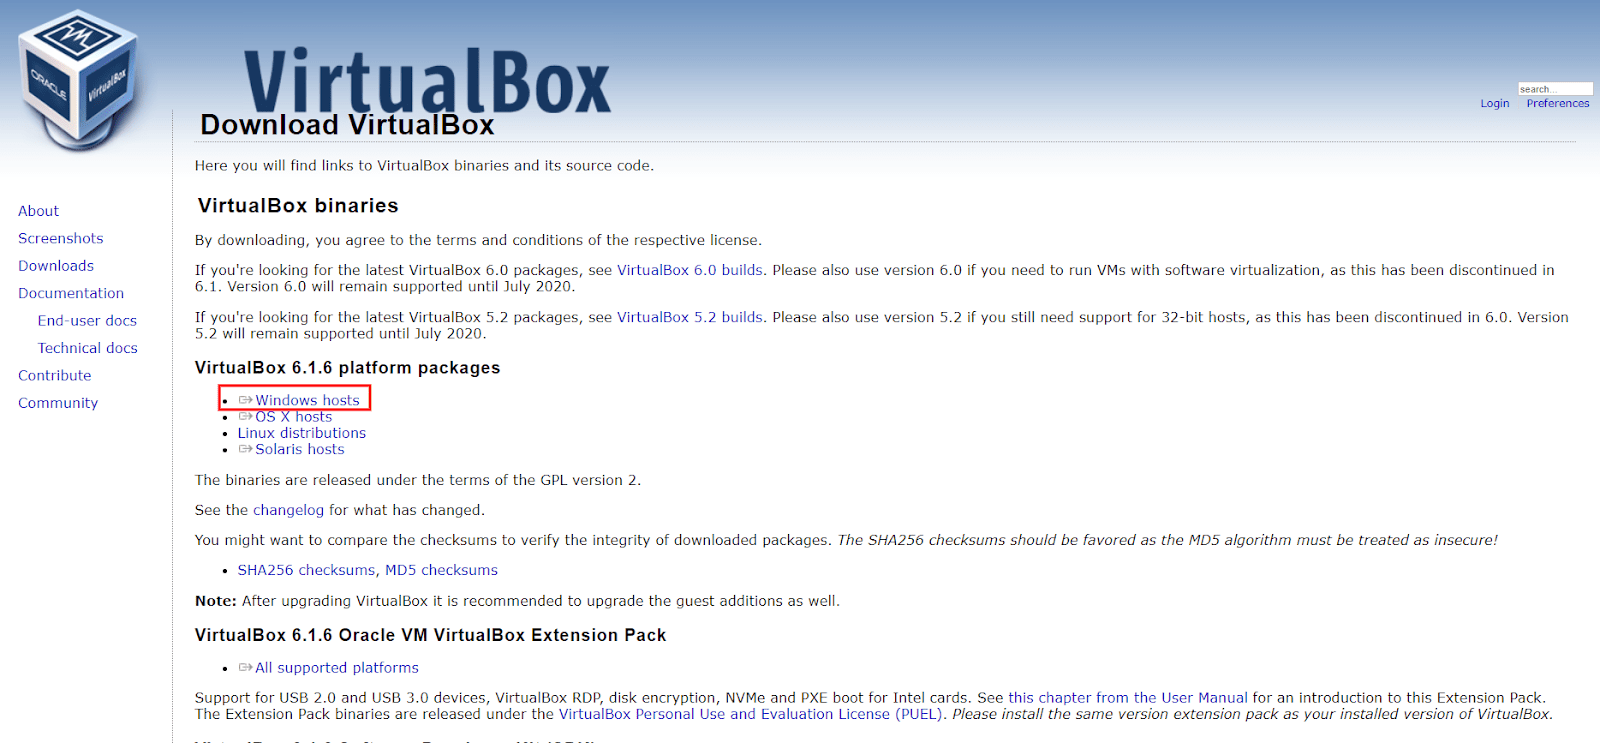
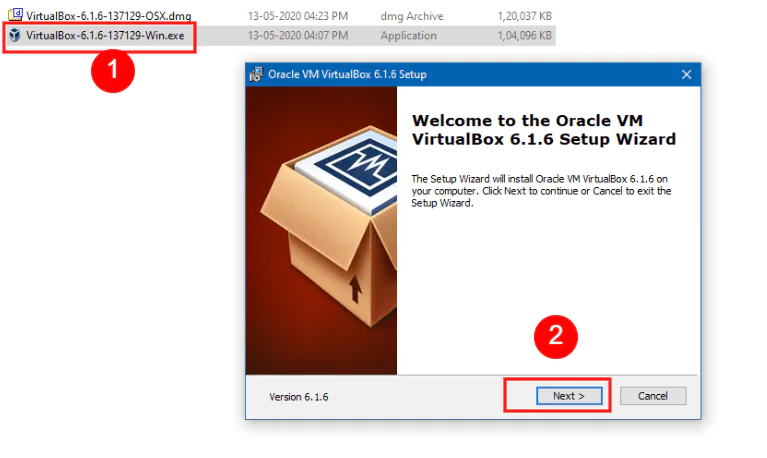
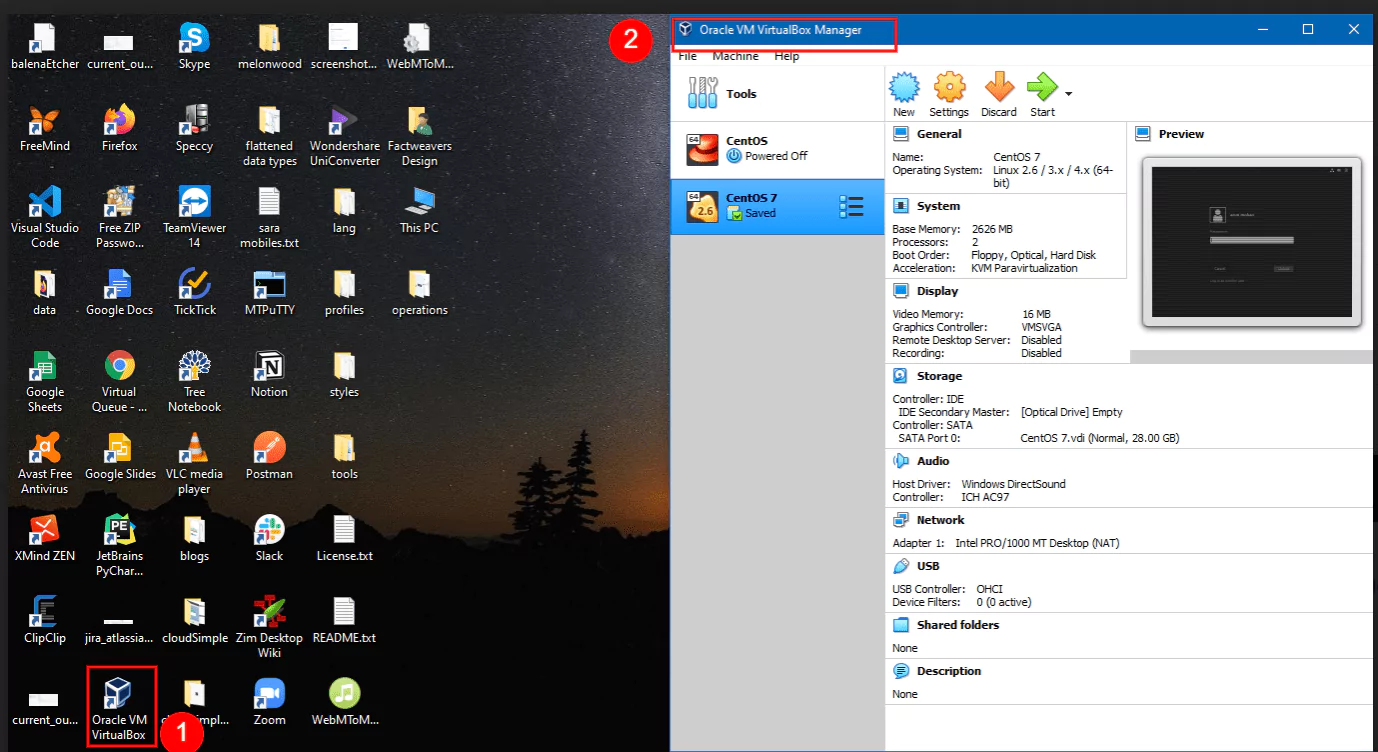
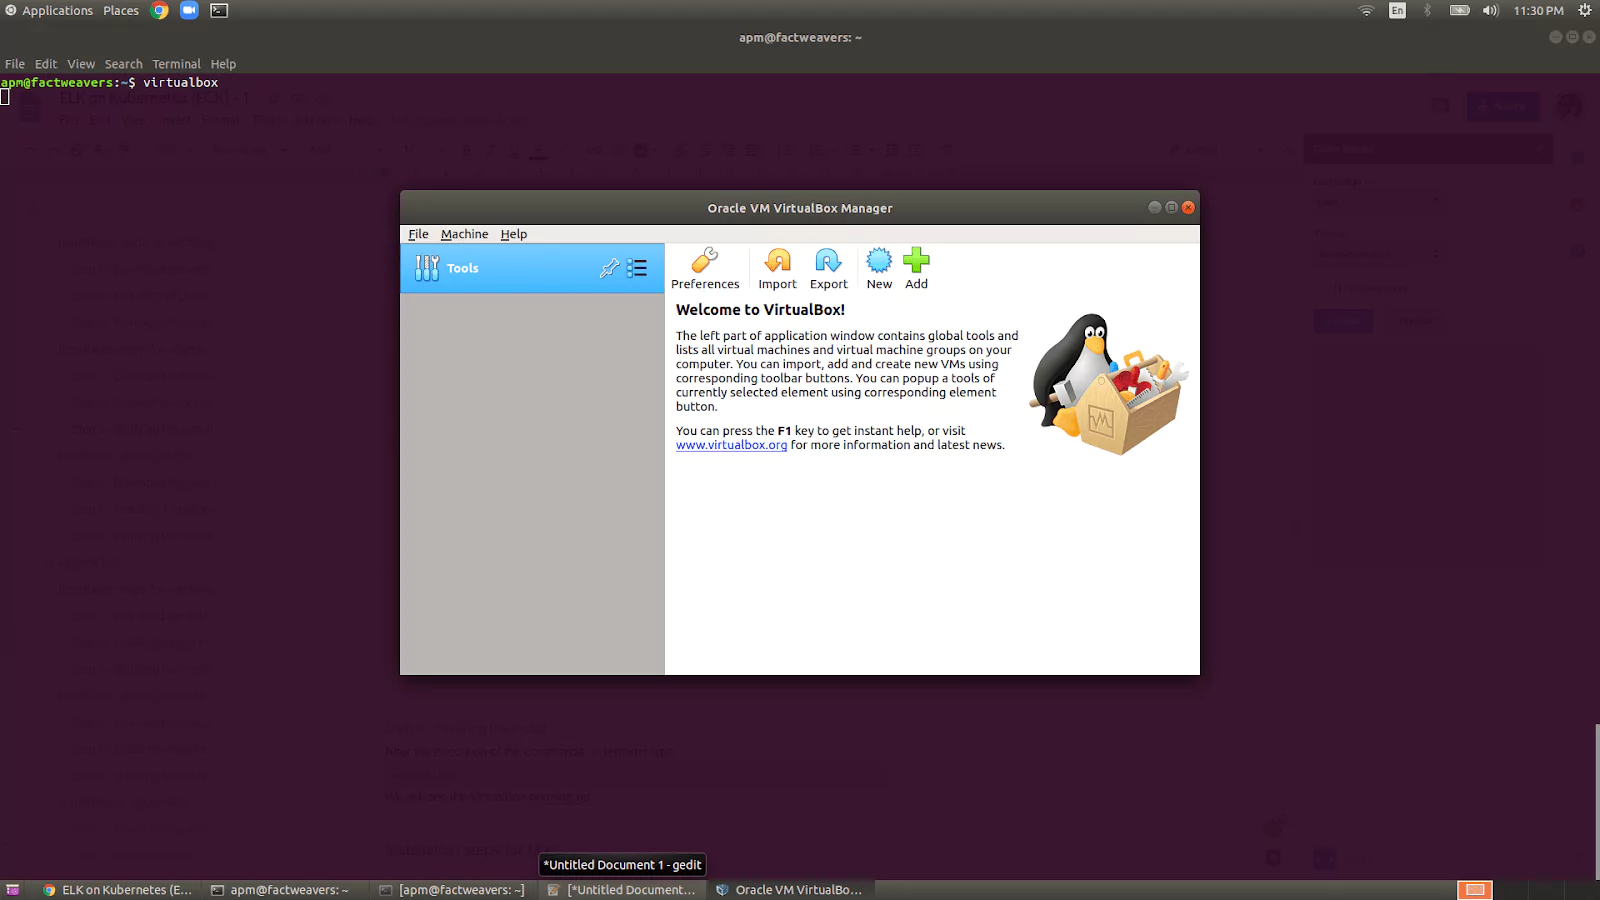
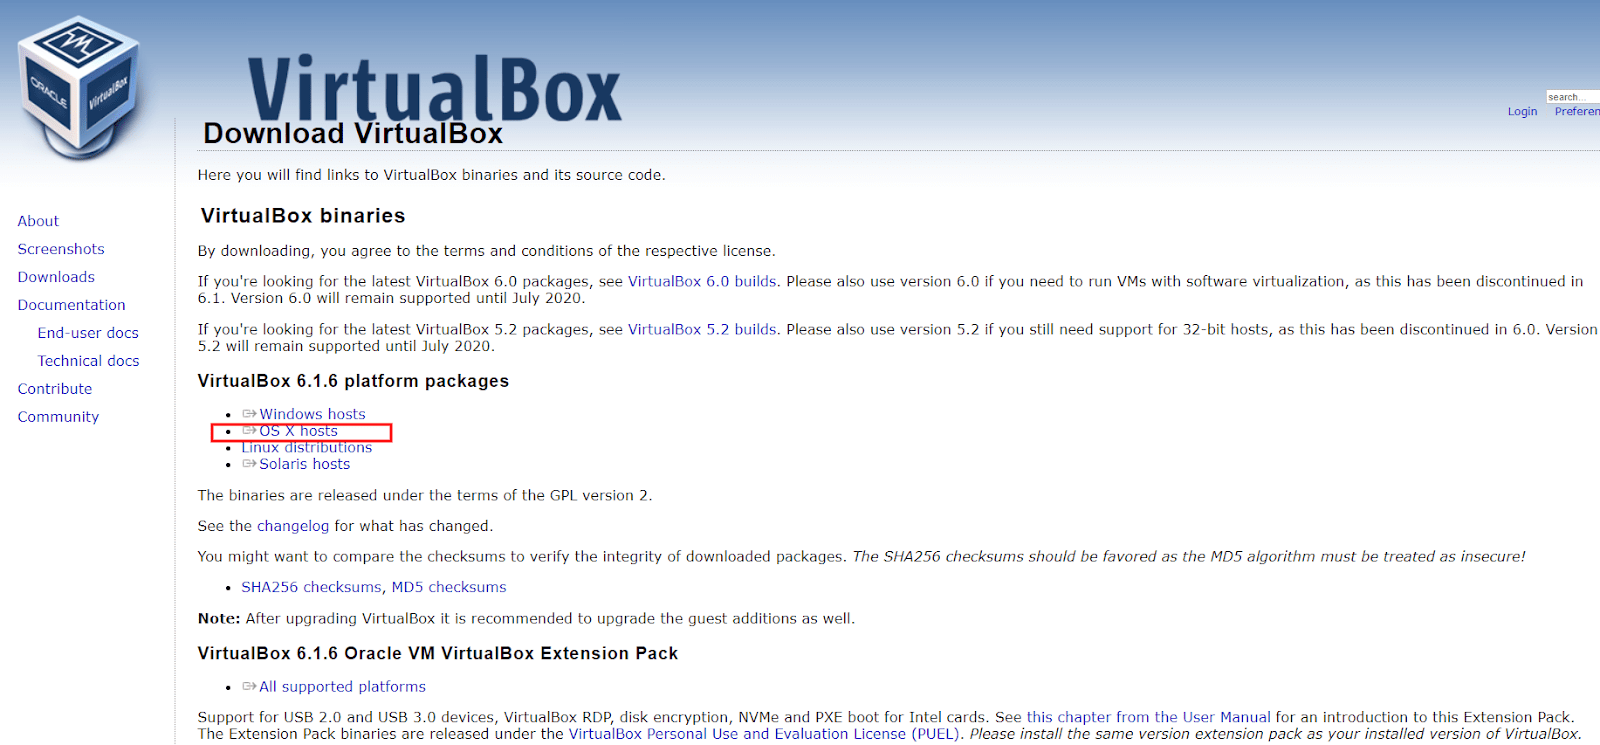
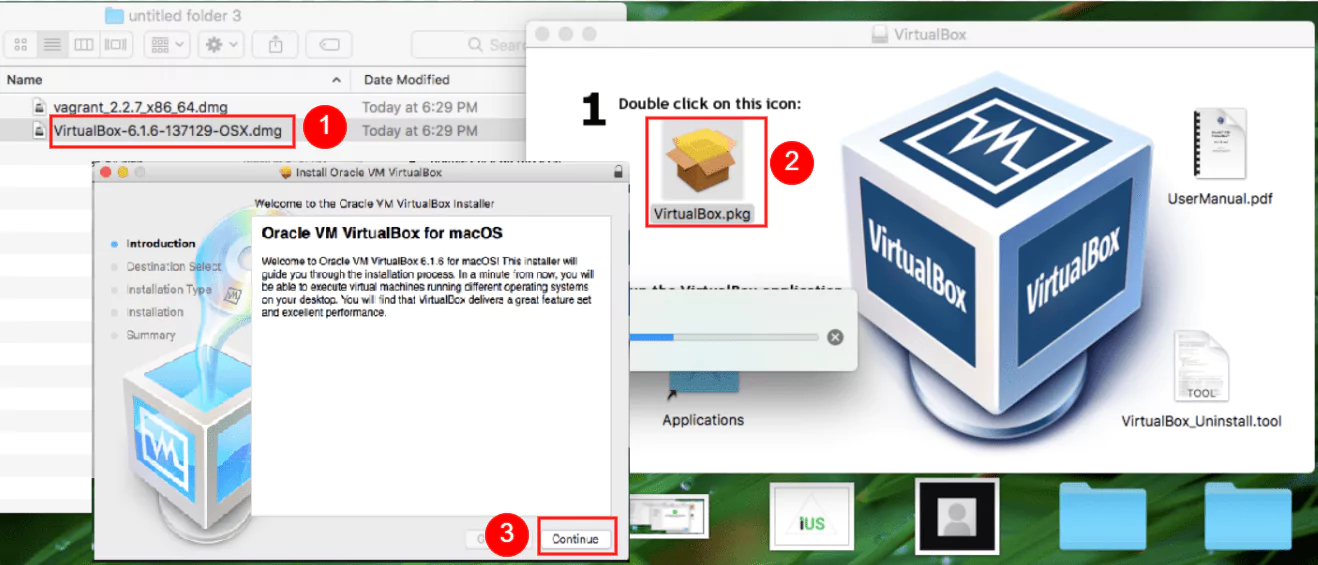
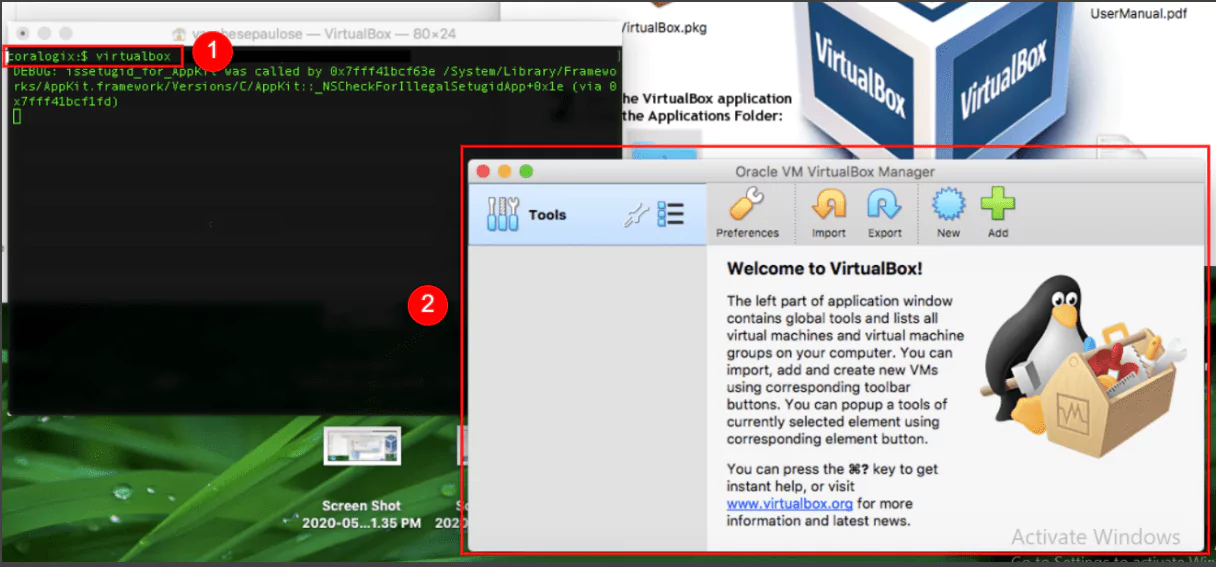
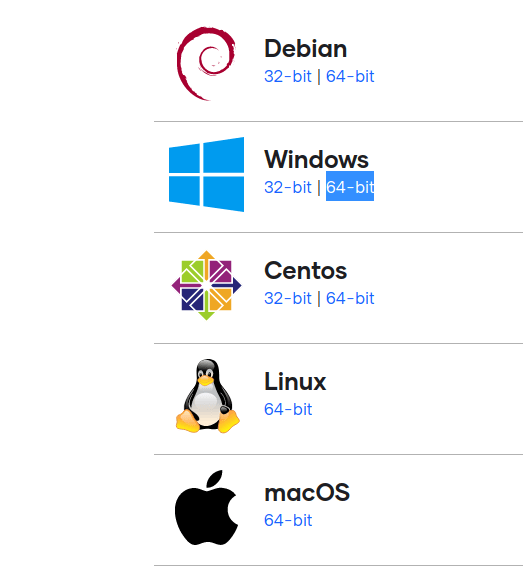
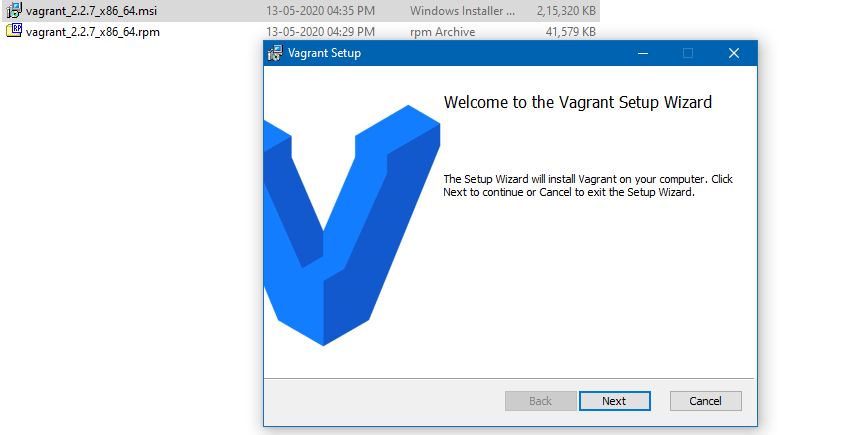
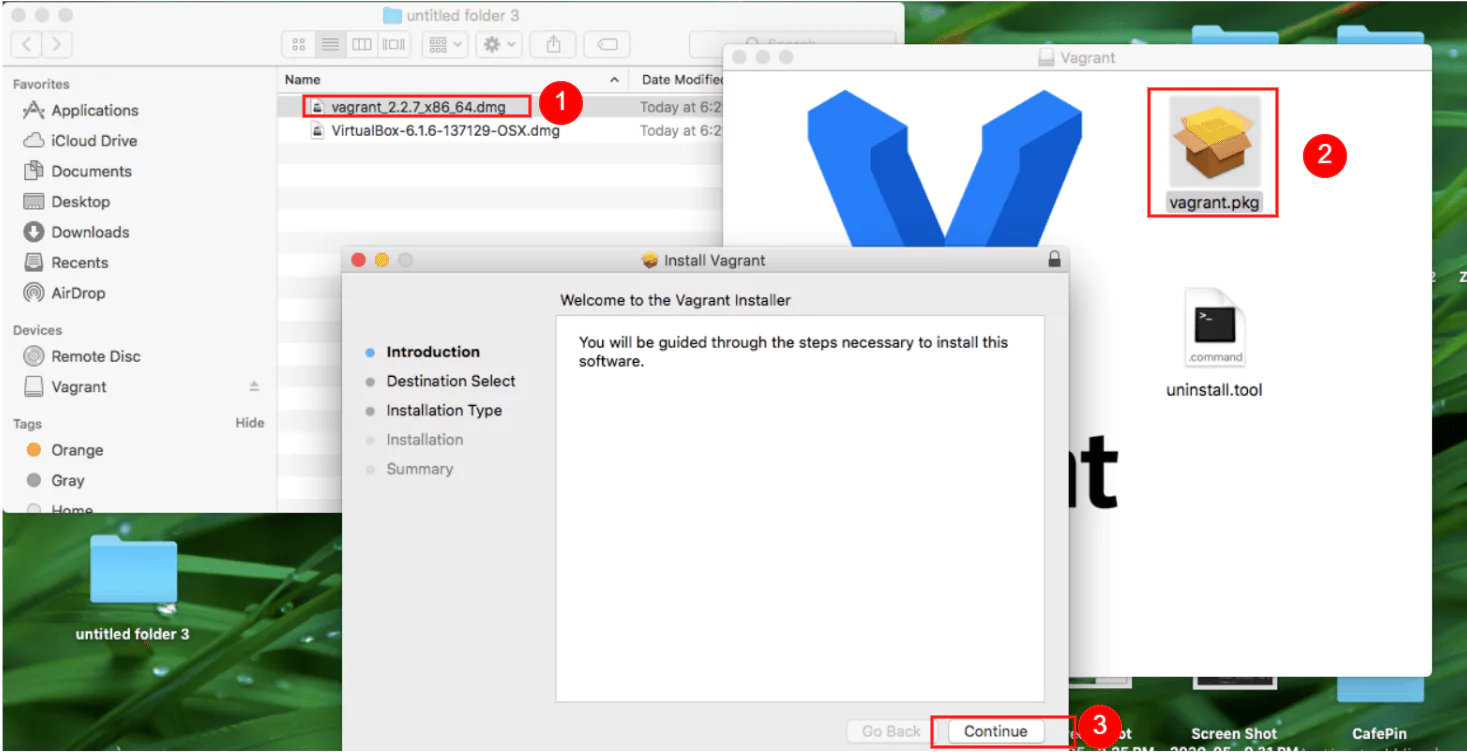
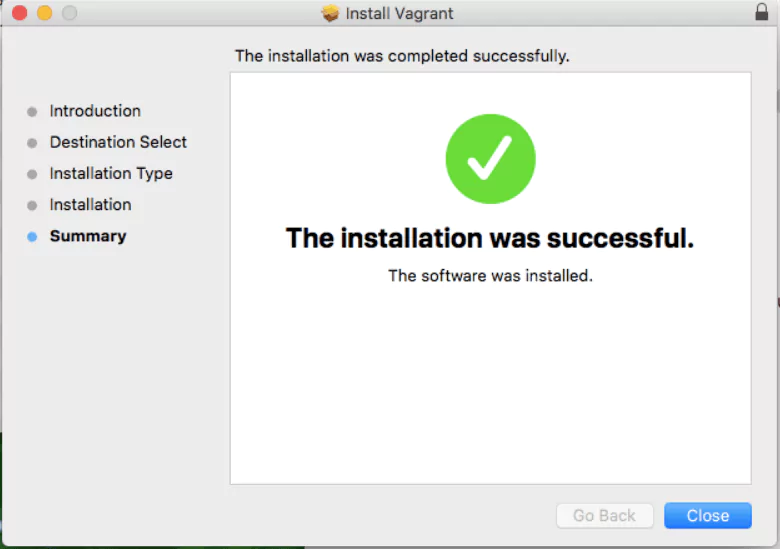
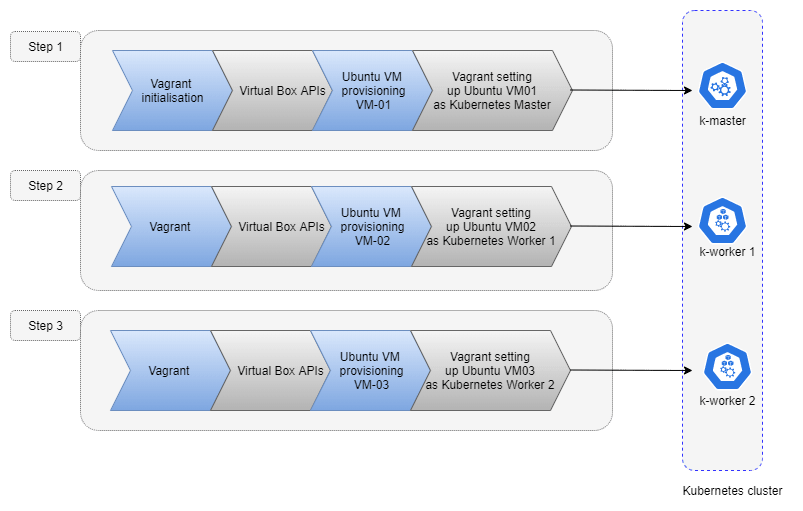
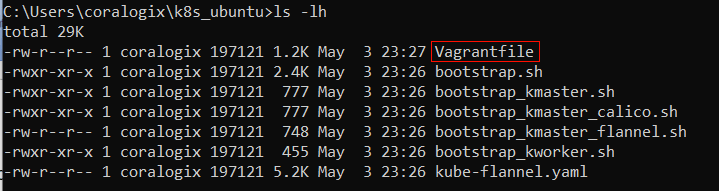
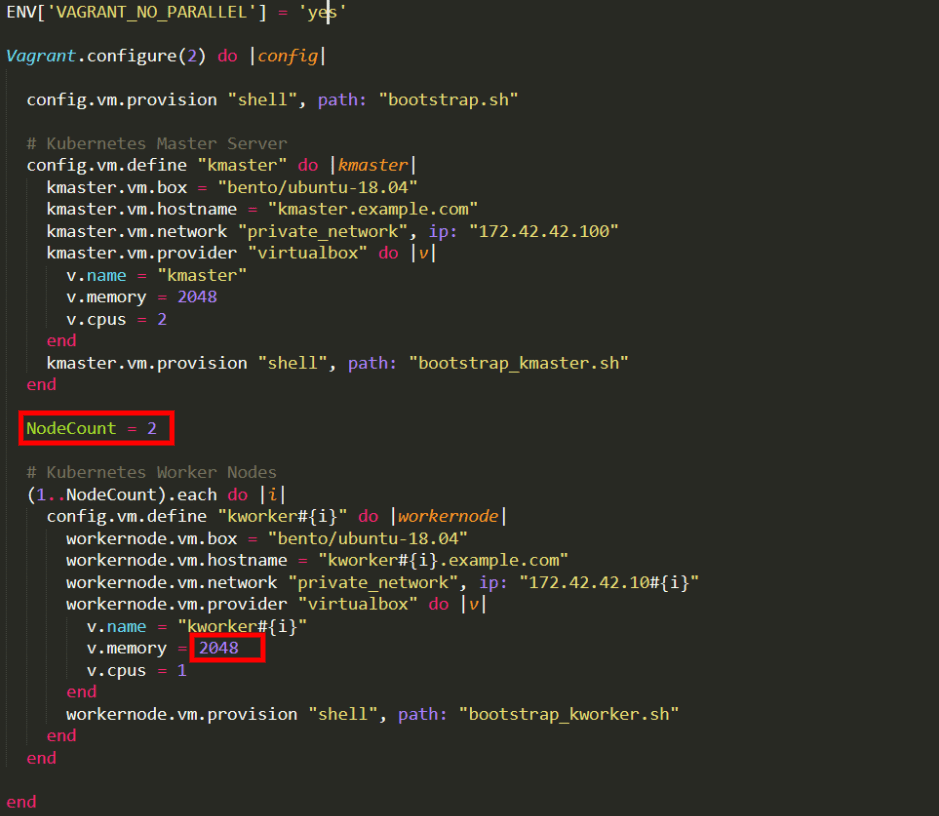
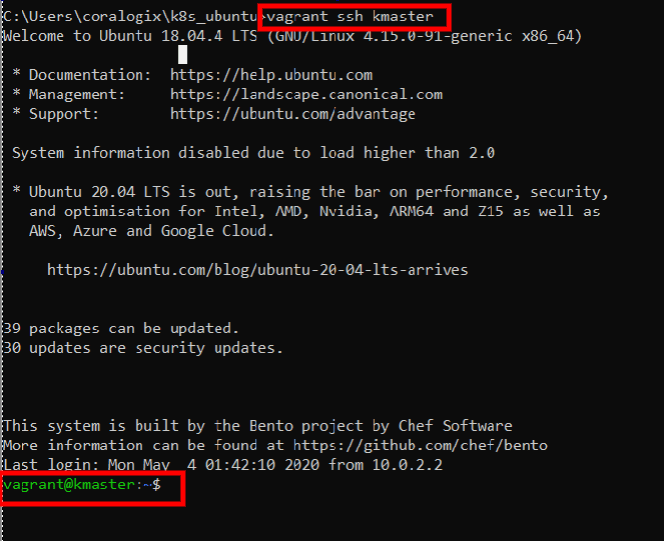
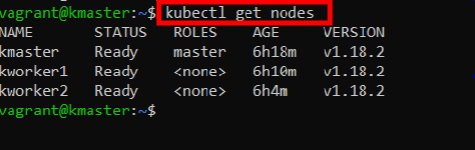