Observability and Its Influence on Scrum Metrics

Scrum metrics and data observability are an essential indicator of your team’s progress. In an agile team, they help you understand the pace and progress of every sprint, ascertain whether you’re on track for timely delivery or not, and more. 

Although scrum metrics are essential, they are only one facet of the delivery process — sure, they ensure you’re on track, but how do you ensure that there are no roadblocks during development? 

That’s precisely where observability helps. Observability gives you a granular overview of your application. It monitors and records performance logs continuously, helping you isolate and fix issues before scrum metrics are affected. Using observability makes your scrum team more efficient — let’s see how.

Scrum Metrics: The Current Issues & How Observability Helps

Problem #1: 

Imagine a scenario where you’ve just pushed new code into production and see an error. If it’s a single application, you only have to see the logs to pinpoint exactly where the issue lies. However, when you add distributed systems and cloud services to the mix, the cause of the defect can range from a possible server outage to cloud services being down.

Cue the brain-racking deep dives into logs and traces on multiple servers, with everyone from the developers to DevOps engineers doing their testing and mock runs to figure out the what and where. 

This is an absolute waste of time because looking at these individually is like hoping to hit the jackpot – you’re lucky if one of you finds it early on, or you might end up clueless for days on end. And not to mention, scrum metrics would be severely impacted the longer this goes on, causing more pressure from clients and product managers.

How observability fixes it:

With observability, you do not need to comb through individual logs and traces — you can track your applications and view real-time data in a centralized dashboard. 

Finding where the problem lies becomes as simple as understanding which request is breaking through a system trace. Since observability tools are configured to your entire system, that just means clicking a few buttons to start the process. Further, application observability metrics can help you understand your system uptime, response time, the number of requests per second, and how much processing power or memory an application uses — thereby helping you find the problem quickly.

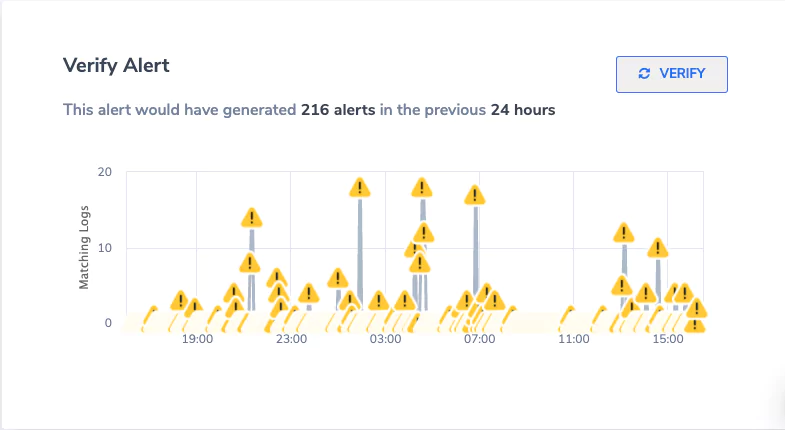
Thus, you mitigate downtime risks and can even solve issues proactively through triggered alerts. 

Problem #2: Hierarchy & Information Sharing

Working in teams is more than distributing tasks and ensuring their timely completion. Information sharing and prompt communication across the ladder are critical to reducing the mean response time to threats. However, if your team prefers individual-level monitoring and problem-solving, they may not readily share or access information as and when required. 

This could create a siloed workplace environment where multiple analytics and monitoring tools are used across the board. This purpose-driven approach inhibits any availability of unified metric data and limits information sharing. 

How observability fixes it:

Observability introduces centralized dashboards that enable teams to work on issues collaboratively. You can access pre-formatted, pre-grouped, and segregated logs and traces that indicate defects. A centralized view of these logs simplifies data sharing and coordination within the team, fostering problem-solving through quick communication and teamwork.

Log management tools such as Coralogix’s full-stack observability platform can generate intelligent reports that help you improve scrum metrics and non-scrum KPIs. Standardizing log formats and traces helps ease the defect and threat-finding process. And your teams can directly access metrics that showcase application health across the organization without compromising on the security of your data.

Let’s look at standard scrum metrics and how observability helps them.

Scrum Metrics & How Observability Improves Them

Sprint Burndown

Sprint burndown is one of the most common scrum metrics. It gives information about the tasks completed and tasks remaining. This helps identify whether the team is on track for each sprint. 

As the sprints go on and the scheduled production dates draw close, the code gets more complicated and harder to maintain. More importantly, it becomes harder to discern for those not involved in developing bits. 

Observability enables fixing the issues early on. With observability, you get a centralized, real-time logging and tracing system that can predictively analyze and group errors, defects, or vulnerabilities. Metrics allow you to monitor your applications in real time and get a holistic view of system performance.

Thus, the effect on your sprint burndown graph is minimal, with significant defects caught beforehand. Observability generates a more balanced sprint burndown graph that shows the exact work done, including fixing defects. 

Team Satisfaction

Observability enables easy collaboration, and information sharing, and gives an overview of how the system performs in real time. A comprehensive centralized observability platform allows developers to analyze logs quickly, fix defects easily, and save the headache of monitoring applications themselves through metrics. And then, they can focus on the job they signed up for — development.

Software Quality

Not all metrics in scrum are easy to measure, and software quality is one of the hardest. The definition is subjective; the closest measurable metric is the escaped defects metric. That’s perhaps why not everyone considers this, but at the end of the day, a software engineering team’s goal is to build high-quality software. 

The quicker you find and squash code bugs and vulnerability threats, the easier it gets to improve overall code quality. You’ll have more time to enhance rather than fix and focus more on writing “good code” instead of “code that works.” 

Escaped Defects

Have you ever deployed code that works flawlessly in pre-production but breaks immediately in production? Don’t worry — we’ve all been there! 

That’s precisely why the escaped defects metric is a core scrum metric. It gives you a good overview of your software’s performance in production.

Implementing observability can directly improve this metric. A good log management and analytics platform like Coralogix can help you identify most bugs proactively through real-time reporting and alerting systems. This reduces the number of defects you may have missed, thus reducing the escaped defects metric.

You benefit from improved system performance and a reduced overall cost and technical debt.

Defect Density

Defect density goes hand-in-hand with escaped defects, especially for larger projects. It measures the number of defects relative to the size of the project.

You could measure this for a class, a package, a set of classes or packages of that deployment, etc. Observability improves the overall performance here. Since you can monitor and generate centralized logs, you can now analyze the defect density and dive deeper into the “why.” Also, using application metrics, you can figure out individual application performance and how efficiently your system works when they are integrated together.

Typically, this metric is used to study irregular defects and answer questions like “are some parts of the code particularly defective?” or “Are some areas out of analysis coverage?” etc. But with observability, you can answer questions like “what’s causing so many defects in these areas?” as defect density and observability complement each other.

Use Observability To Enhance Scrum Metrics

Monitoring scrum KPIs can help developers make better-informed decisions. But these metrics can be hard to track when it comes to developing and deploying modern, distributed systems and microservices. Often, scrum metrics are impacted due to preventable bugs and coordination issues across teams.

Introducing full observability to your stack can revamp the complete development process, significantly improving many crucial scrum metrics. You get a clear understanding of your application health at all times and reduce costs while boosting team morale. If you’re ready to harness the power of observability, contact Coralogix today!

What’s Missing From Almost Every Alerting Solution in 2022?

Alerting has been a fundamental part of operations strategy for the past decade. An entire industry is built around delivering valuable, actionable alerts to engineers and customers as quickly as possible. We will explore what’s missing from your alerts and how Coralogix Flow Alerts solve a fundamental problem in the observability industry. 

What does everyone want from their alerts?

When engineers build their alerts, they focus on making them as useful as possible, but how do we define useful? While this is a complicated question, we can break the utility of an alert into a few easy points:

  • Actionable: The information that the alert gives you is usable, and tells you everything you need to know to respond to the situation, with minimal work on your part to piece together what is going on.
  • Accurate: Your alerts trigger in the correct situation, and they contain correct information.
  • Timely: Your alerts tell you, as soon as possible, the information you need, when you need it.

For many engineers, achieving these three qualities is a never-ending battle. Engineers are constantly chasing after the smallest, valuable set of alerts we can possibly have to minimize noise and maximize uptime. 

However, one key feature is missing from almost every alerting provider, and it goes right to the heart of observability in 2022.

The biggest blocker to the next stage of alerting

If we host our own solution, perhaps with an ELK stack and Prometheus, as is so common in the industry, we are left with some natural alerting options. Alertmanager integrates nicely with Prometheus, and Kibana comes with its own alerting functionality, so you have everything you need, right? Not quite.

Your observability data has been siloed into two specific datastores: Elasticsearch and Prometheus. As soon as you do this, you introduce an architectural complication.

How would you write an alert around your logs AND your metrics?

Despite how simple this sounds, this is something that is not supported by the vast majority of SaaS observability providers or open-source tooling. Metrics, logs, and traces are treated as separate pillars, filtering down into our alerting strategies.

It isn’t clear how this came about, but you only need to look at the troubleshooting practices of any engineer to work out that it’s suboptimal. As soon as a metric alert fires, the engineer looks at the logs to verify. As soon as a log alert fires, the engineer looks at the metrics to better understand. It’s clear that all of this data is used for the same purpose, but we silo it off into separate storage solutions and, in doing so, make our life more difficult.

So what can we do?

The answer is twofold. Firstly, we need to bring all of our observability data into a single place, to build a single pane of glass for our system. Aside from alerting, this makes monitoring and general querying more straightforward. It removes the complex learning curve associated with many open-source tools, which speeds up the time it takes for engineers to become familiar with their chosen approach to observability. However, getting data into one place isn’t enough. Your chosen platform needs to support holistic alerting. And there is only one provider on the market – Coralogix.

Flow alerts cross the barrier between logs, metrics, and traces

There are many SaaS observability providers out there that will consume your logs, metrics, and traces, but none of them can tie all of this data together into a single, cohesive alert that completely describes an outage, making use of your logs, metrics, and traces in the same alert. 

Flow alerts enable you to view your entire system globally without being constrained to a single data type. This brings some key benefits that directly address the great limitations in alerting:

  • Accurate: With flow alerts, you can track activity across all of your observability data, enabling you to outline precisely the conditions for an incident. This reduces noise because your alerts aren’t too sensitive or based on only part of the data. They’re perfectly calibrated to the behavior of your system.
  • Actionable: Flow alerts tell you everything that has happened, leading up to an incident, not just the incident itself. This gives you all of the information you need, in one place, to remedy an outage, without hunting for associated data in your logs or metrics. 
  • Timely: Flow alerts are processed within our Streama technology, meaning your alerts are processed and actioned in-stream, rather than waiting for expensive I/O and database operations to complete. 

Full-Stack Observability Guide

Like cloud-native and DevOps, full-stack observability is one of those software development terms that can sound like an empty buzzword. Look past the jargon, and you’ll find considerable value to be unlocked from building data observability into each layer of your software stack.

Before we get into the details of monitoring observability, let’s take a moment to discuss the context. Over the last two decades, software development and architecture trends have departed from single-stack, monolithic designs toward distributed, containerized deployments that can leverage the benefits of cloud-hosted, serverless infrastructure. 

This provides a range of benefits, but it also creates a more complex landscape to maintain and manage: software breaks down into smaller, independent services that deploy to a mix of virtual machines and containers hosted both on-site and in the cloud, with additional layers of software required to manage automatic scaling and updates to each service, as well as connectivity between services.

At the same time, the industry has seen a shift from the traditional linear build-test-deploy model to a more iterative methodology that blurs the boundaries between software development and operations. This DevOps approach has two main elements. 

First, developers have more visibility and responsibility for their code’s performance once released. Second, operations teams are getting involved in the earlier stages of development — defining infrastructure with code, building in shorter feedback loops, and working with developers to instrument code so that it can output signals about how it’s behaving once released. 

With richer insights into a system’s performance, developers can investigate issues more efficiently, make better coding decisions, and deploy changes faster.

Observability closely ties into the DevOps philosophy: it plays a central role in providing the insights that inform developers’ decisions. It depends on addressing matters traditionally owned by ops teams earlier in the development process.

What is full-stack observability?

Unlike monitoring, observability is not what you do. Instead, it’s a quality or property of a software system. A system is observable if you can ask questions about the data it emits to gain insight into how it behaves. Whereas monitoring focuses on a pre-determined set of questions — such as how many orders are completed or how many login attempts failed — with an observable system, you don’t need to define the question.

Instead, observability means that enough data is collected upfront allowing you to investigate failures and gain insights into how your software behaves in production, rather than adding extra instrumentation to your code and reproducing the issue. 

Once you have built an observable system, you can use the data emitted to monitor the current state and investigate unusual behaviors when they occur. Because the data was already collected, it’s possible to look into what was happening in the lead-up to the issue.

Full-stack observability refers to observability implemented at every layer of the technology stack. – From the containerized infrastructure on which your code is running and the communications between the individual services that make up the system, to the backend database, application logic, and web server that exposes the system to your users.

With full-stack observability, IT teams gain insight into the entire functioning of these complex, distributed systems. Because they can search, analyze, and correlate data from across the entire software stack, they can better understand the relationships and dependencies between the various components. This allows them to maintain systems more effectively, identify and investigate issues quickly, and provide valuable feedback on how the software is used.

So how do you build an observable system? The answer is by instrumenting your code to emit signals and collect telemetry centrally so that you can ask questions about how it’s behaving and why it’s running in production. The types of telemetry can be broken down into what is known as the “four pillars of observability”: metrics, logs, traces, and security data. 

Each pillar provides part of the picture, as we’ll discuss in more detail below. Ensuring these types of data are emitted and collating that information into a single observability platform makes it possible to observe how your software behaves and gain insights into its internal workings.

Deriving value from metrics

The first of our four pillars is metrics. These are time series of numbers derived from the system’s behavior. Examples of metrics include the average, minimum, and maximum time taken to respond to requests in the last hour or day, the available memory, or the number of active sessions at a given point in time.

The value of metrics is in indicating your system’s health. You can observe trends and identify any significant changes by plotting metric values over time. For this reason, metrics play a central role in monitoring tools, including those measuring system health (such as disk space, memory, and CPU availability) and those which track application performance (using values such as completed transactions and active users).

While metrics must be derived from raw data, the metrics you want to observe don’t necessarily have to be determined in advance. Part of the art of building an observable system is ensuring that a broad range of data is captured so that you can derive insights from it later; this can include calculating new metrics from the available data.

Gaining specific insights with logs

The next source of telemetry is logs. Logs are time-stamped messages produced by software that record what happened at a given point. Log entries might record a request made to a service, the response served, an error or warning triggered, or an unexpected failure. Logs can be produced from every level of the software stack, including operating systems, container runtimes, service meshes, databases, and application code.

Most software (including IaaS, PaaS, CaaS, SaaS, firewalls, load balancers, reverse proxies, data stores, and streaming platforms) can be configured to emit logs, and any software developed in-house will typically have logging added during development. What causes a log entry to be emitted and the details it includes depend on how the software has been instrumented. This means that the exact format of the log messages and the information they contain will vary across your software stack.

In most cases, log messages are classified using logging levels, which control the amount of information that is output to logs. Enabling a more detailed logging level such as “debug” or “verbose” will generate far more log entries, whereas limiting logging to “warning” or “error” means you’ll only get logs when something goes wrong. If log messages are in a structured format, they can more easily be searched and queried, whereas unstructured logs must be parsed before you can manipulate them programmatically.

Logs’ low-level contextual information makes them helpful in investigating specific issues and failures. For example, you can use logs to determine which requests were produced before a database query ran out of memory or which user accounts accessed a particular file in the last week. 

Taken in aggregate, logs can also be analyzed to extrapolate trends and detect past and real-time anomalies (assuming they are processed quickly enough). However, checking the logs from each service in a distributed system is rarely practical. To leverage the benefits of logs, you need to collate them from various sources to a central location so they can be parsed and analyzed in bulk.

Using traces to add context

While metrics provide a high-level indication of your system’s health and logs provide specific details about what was happening at a given time, traces supply the context. Distributed tracing records the chain of events involved in servicing a particular request. This is especially relevant in microservices, where a request triggered by a user or external API call can result in dozens of child requests to different services to formulate the response.

A trace identifies all the child calls related to the initiating request, the order in which they occurred, and the time spent on each one. This makes it much easier to understand how different types of requests flow through a system, so that you can work out where you need to focus your attention and drill down into more detail. For example, suppose you’re trying to locate the source of performance degradation. In that case, traces will help you identify where the most time is being spent on a request so that you can investigate the relevant service in more detail.

Implementing distributed tracing requires code to be instrumented so that trace identifiers are propagated to each child request (known as spans), and the details of each span are forwarded to a database for retrieval and analysis.

Adding security data to the picture

The final element of the observability puzzle is security data. Whereas the first three pillars represent specific types of telemetry, security data refers to a range of data, including network traffic, firewall logs, audit logs and security-related metrics, and information about potential threats and attacks from security monitoring platforms. As a result, security data is both broader and narrower than the first three pillars.

Security data merits inclusion as a pillar in its own right because of the crucial importance of defending against cybersecurity attacks for today’s enterprises. In the same way that the importance of building security into software has been highlighted by the term DevSecOps, including security as a pillar in its own right serves to highlight the role that observability plays in improving software security and the value to be had from bringing all available data into a single platform.

As with metrics, logs, and traces, security data comes from multiple sources. One of the side effects of the trend towards more distributed systems is an increase in the potential attack surface. With application logic and data spread across multiple platforms, the network connections between individual containers and servers and across public and private clouds have become another target for cybercriminals. Collating traffic data from various sources makes it possible to analyze that data more effectively to detect potential threats and investigate issues efficiently.

Using an observability platform

While these four types of telemetry provide valuable data, using each in isolation will not deliver the full benefits of observability. To answer questions about how your system is performing efficiently, you need to bring the data together into a single platform that allows you to make connections between data points and understand the complete picture. This is how an observability platform adds value.

Full-stack observability platforms provide a single source of truth for the state of your system. Rather than logging in to each component of a distributed system to retrieve logs and traces, view metrics, or examine network packets, all the information you need is available from a single location. This saves time and provides you with better context when investigating an issue so that you can get to the source of the problem more quickly.

Armed with a comprehensive picture of how your system behaves at all layers of the software stack, operations teams, software developers, and security specialists can benefit from these insights. Full-stack observability makes it easier for these teams to detect and troubleshoot production issues and monitor changes’ impact as they deploy.

Better visibility of the system’s behavior also reduces the risk associated with trialing and adopting new technologies and platforms, enabling enterprises to move fast without compromising performance, reliability, or security. Finally, having a shared perspective helps to break down siloes and encourages the cross-team collaboration that’s essential to a DevSecOps approach. 

Tracing vs. Logging: What You Need To Know

Log tracking, trace log, or logging traces…

Although these three terms are easy to interchange (the wordplay certainly doesn’t help!), compare tracing vs. logging, and you’ll find they are quite distinct. Logs monitoring, traces, and metrics are the three pillars of observability, and they all work together to measure application performance effectively. 

Let’s first understand what logging is.

What is logging?

Logging is the most basic form of application monitoring and is the first line of defense to identify incidents or bugs. It involves recording timestamped data of different applications or services at regular intervals. Since logs can get pretty complex (and massive) in distributed systems with many services, we typically use log levels to filter out important information from these logs. The most common levels are FATAL, ERROR, WARN, DEBUG, INFO, TRACE, and ALL. The amount of data logged on each log level also varies based on how critical it is to store that information for troubleshooting and auditing applications.

Most logs are highly detailed with relative information about a particular microservice, function, or application. You’ll need to collate and analyze multiple log entries to understand how the application functions normally. And since logs are often unstructured, reading them from a text file on your server is not the best idea. 

But we’ve come far with how we handle log data. You can easily link your logs from any source and in any language to Coralogix’s log monitoring platform. With our advanced data visualization tools and clustering capabilities, we can help you proactively identify unusual system behavior and trigger real-time alerts for effective investigation.

Now that you understand what logging is let’s look at what is tracing and why it’s essential for distributed systems.

What is tracing?

In modern distributed software architectures, you have a dozen — if not hundreds of applications calling each other. Although analyzing logs can help you understand how individual applications perform, it does not track how they interact with each other. And often, especially in microservices, that’s where the problem lies. 

For instance, in the case of an authentication service, the trigger is typically a user interaction — such as trying to access data with restricted access levels. The problem can be in the authentication protocol, the backend server that hosts the data, or how the server sends data to the front end.

Thus, seeing how the services connect and how your request flows through the entire architecture is essential. That provides context to the problem. Once the problematic application is identified, the appropriate team can be alerted for a faster resolution.

This is where tracing comes in — an essential subset of observability. A trace follows a request from start to end and how your data moves through the entire system. It can record which services it interacted with and each service’s latency. With this data, you can chain events together to analyze any deviations from normal application behavior. Once the anomaly is pinpointed, you can link log data from events you’ve identified, the duration of the event, and the specific function calls that caused the event — thereby identifying the root cause of the error within a few attempts.

Okay, so now that we understand the basics of what is tracing, let’s look at when you should use tracing vs. logging.

When should you use tracing vs. logging?

Let’s understand this with an example. Imagine you’ve joined the end-to-end testing team of an e-commerce company. Customers complain about intermittent slowness while purchasing shoes. To resolve this, you must identify which application is triggering the issue — is it the payment module? Is it the billing service? Or is it how the billing service interacts with the fulfillment service?

You require both logging and tracing to understand the root cause of the issue. Logs help you identify the issue, while a trace helps you attribute it to specific applications. 

An end-to-end monitoring workflow would look like this: Use a log management platform like Coralogix to get alerts if any of your performance metrics fail. You can then send a trace that emulates your customer behavior from start to end. 

In our e-commerce example, the trace would add a product to the cart, click checkout, add a shipping address, and so on. While doing each step, it would record the time it took for each service to respond to the request. And then, with the trace, you can pinpoint which service is failing and then go back to the logs to find any errors.

Logging is essential for application monitoring and should always be enabled. In contrast, trying to trace continuously means that you’d bogging down the system with unnecessary requests, which can cause performance issues. It’s better to send sample requests if the logs show behavior anomalies. 

So, to sum up, if you have to choose tracing vs. logging for daily monitoring, logging should be your go-to! And conversely, if you need to debug a defect, you can rely on tracing to get to the root cause faster.  

Tracing vs. Logging: Which one to choose?

Although distributed architectures are great for scale, they introduce additional complexity and require heavy monitoring to provide a seamless user experience. Therefore, we wouldn’t recommend you choose tracing vs. logging — instead, your microservice observability strategy should have room for both. While logging is like a toolbox you need daily, tracing is the handy drill that helps you dig down into issues you need to fix. 

How to Perform Log Analysis

Log file monitoring tools plays a central role in enhancing the observability of your IT estate, helping operations teams and SRE engineers to identify issues as they emerge and track down the cause of failures quickly. 

As the number of log entries generated on any given day in a medium-sized business easily numbers in the thousands, viewing and analyzing logs manually to realize these benefits is not a realistic option. This is where automated real-time log analysis comes in.

In this article, we’ll go through the steps involved in conducting log analysis effectively. To find out more about what log analysis can do for your organization, head over to our Introduction to Log Analysis resource guide.

Generating log files

The very first step to implementing log analysis is to enable logging so that log entries are actually generated, and to configure the appropriate logging level.

The logic that determines when a log entry may be generated forms part of the software itself, which means that unless you’re building the application or program in-house you generally can’t add new triggers for writing a log. 

However, you should be able to specify the logging level. This allows you to determine how much information is written to your log files.

While both the number and names of log levels can vary between systems, most will include:

  • ERROR – for problems that prevent the software from functioning. This could be a serious error that causes the system to crash, or a workflow not completing successfully.
  • WARNING (or WARN) – for unexpected behavior that does not prevent the program from functioning, but may do so in the future if the cause of the warning is not addressed. Examples include disk space reaching capacity or a query holding database locks.
  • INFORMATION (or INFO) – for normal behavior, such as recording user logins or access to files.
  • DEBUG – for more detailed information about what is happening in the background, useful when troubleshooting an issue, both in development and in production.

When you enable logging on a system, you can also specify the minimum logging level. For example, if you set the level to WARNING, any warning and error level logs will be output by the system, but information and debug logs will not. You may also come across TRACE, which is lower than DEBUG, and SEVERE, CRITICAL or FATAL, which are all higher than ERROR.

Collecting logs

By using log file monitoring tools like Filebeat, you can centralize your logs into a single, queryable place. These tools will listen to changes to your local log files and push them into a central location. This is commonly an Elasticsearch cluster, but there are many options out there. When your logs are in the same place, you can go to a single site to get the bigger picture. This limits the toil of jumping between servers.

But now you’ve got to look after your logging platform

Elasticsearch is notoriously tricky to maintain. It has many different configuration options, and that’s before you look to optimize the cluster. Node outages can cause the loss of critical operational data, and the engineering effort, combined with the hosting costs, can quickly become expensive. At Coralogix, we aim to make this simple for you. We have experts with the Elasticsearch toolset who can ensure a smooth experience with no operational overhead. 

Normalizing and parsing your logging data

The great challenge with your logs is to make them consistent. Logs are a naturally unstructured format, so parsing them can become a complex task. One strategy that teams employ is to always log in the same format, for example, JSON. Logs in JSON format are simple to parse and consistent. You can also add custom fields into your logs to surface application or business-specific information.

But what about 3rd party log analysis?

Our systems are increasingly made up of homegrown and external services, and our observability platform needs to be able to view everything, in order to enable us to perform log analysis. So what do we do about 3rd party logs? The challenge is that we can’t reliably mutate 3rd party logs, since they may change beyond our control, but what if we can add to them?

Log enrichment is key to full log analysis

It’s difficult to parse, mutate, and normalize all of your 3rd party logs, but enrichment is a great way to create some basic fields to enable log analysis. In addition, if you’re debugging an issue, the addition of tracing data to your logs can help you link together multiple events into the same logical group. This allows you to connect your logs to your business more closely. Now your logs are in great shape, it’s time to really unlock the power of log analysis.

Visualizing log data

Data visualizations are a powerful tool for identifying trends and spotting anomalies. By collating your logs in a central location, you can plot data from multiple sources to run cross-analyses and identify correlations.

Your log analytics platform should provide you with the option to run queries and apply filters to dashboards so that you can interrogate your data. For example, by plotting log data over time, you can understand what normal currently looks like in your system or correlate that data with known events such as downtime or releases. 

Adding tags for these events will also make it easier to interpret the data in the future. Log analytics tools that allow you to drill down from the dashboard to specific data points significantly speed up the process of investigating anything unusual so that you can quickly determine whether it’s a sign of a real problem.

Using graphical representations of your log data can help you spot emerging trends, which is useful for capacity and resource planning. By staying ahead of the curve and anticipating spikes in demand, you can provision additional infrastructure or optimize particular workflows in order to maintain a good user experience and stay within your SLAs.

Actionable insights from your log analysis

This is where things become interesting. Now you’ve got the data and the graphs, you can process data in new and interesting ways. This is where the benefits of a mature, centralized logging platform become key. What can you do with a centralized logging platform?

Machine learning log analysis to detect unknown issues

Machine learning log analysis is very difficult to master, but it can work wonders once you have a working ML platform in place. The problem is the upfront effort and cost. It requires a great deal of analysis and expertise to get an operating ML model in place. A mature logging analysis platform with this functionality in place can help you get straight to the benefit without messing around. 

Setting up alerts when your log analysis reveals something scary

Sometimes, your logs will indicate that there is a severe problem. You don’t want to wait until you glance at the monitoring board. Observability is all about giving your system a voice. By using a central log analysis platform, you can alert on complex occurrences between many applications to provide specific, tangible alerts that teams can act on quickly. 

Conclusion

Log data analysis can provide you with a wealth of insights into the usage, health, and security of your systems, together with powerful and efficient tools for detecting and troubleshooting issues. Key to this endeavor is a log analytics platform that can not only simplify and accelerate the process of collating, normalizing, and parsing your log data to make it available for analysis, but also identify patterns and detect potential anomalies automatically.

By choosing a log analytics tool that leverages machine learning to keep pace with your systems as they evolve, you’ll ensure that you get maximum value from your logs while freeing up your operations and SRE teams to focus on investigating true positives or making targeted improvements to your platform and infrastructure.

Coralogix provides integrations for a wide range of log sources, including Windows Event Viewer, AWS S3, ECS and Lambda, Kubernetes, Akamai, and Heroku, support for popular log shipping agents such as Fluentd, Logstash, and Filebeat, as well as SDKs for Python, Ruby, Java, and others. Parsing rules enable you to normalize and structure your log data automatically on ingest, ready for filtering, sorting, and visualizing.

Coralogix includes multiple dashboards for visualizing, filtering, and querying log data, together with support for Kibana, Tableau, and Grafana. Our Loggregation feature uses machine learning to cluster logs based on patterns automatically, while flow and error volume anomaly alerts notify you of emerging issues while minimizing noise from false positives.

To find out more about how Coralogix can enhance the observability of your systems with log analytics, sign up for a free trial or request a demo.

Coralogix is Live in the Red Hat Marketplace!

Coralogix is excited to announce the launch of our Stateful Streaming Data Platform that is now available on the Red Hat Marketplace.  

Built for modern architectures and workflows, the Coralogix platform produces real-time insights and trend analysis for logs, metrics, and security with no reliance on storage or indexing. Making it a perfect match for the Red Hat Marketplace. 

Built-in collaboration with Red Hat and IBM, the Red Hat Marketplace delivers a hybrid multi-cloud trifecta for organizations moving into the next era of computing: a robust ecosystem of partners, an industry-leading Kubernetes container platform, and award-winning commercial support—all on a highly scalable backend powered by IBM. A private, personalized marketplace is also available through Red Hat Marketplace Select, enabling clients to provide their teams with easier access to curated software their organizations have pre-approved.

After announcing the release of Coralogix’s OpenShift operator last year the move to partnering with the Red Hat Marketplace was a giant win for Coralogix’s customers looking for an open marketplace to buy the platform. 

In order to compete in the modern software market, change is our most important currency. As our rate of change increases, so too must the scope and sophistication of our monitoring system. By combining the declarative flexibility of OpenShift with the powerful analysis of Coralogix, you can create a CI/CD pipeline that enables self-healing to known and unknown issues and exposes metrics about performance. It can be extended in any direction you like, to ensure that your next deployment is a success. 

“This new partnership gives us the ability to expand access to our platform for monitoring, visualizing, and alerting for more users,” said Ariel Assaraf, Chief Executive Officer at Coralogix. “Our goal is to give full observability in real-time without the typical restrictions around cost and coverage.”

With Coralogix’s OpenShift operator, customers are able to use the Kubernetes collection agents to Red Hat’s OpenShift Operator model. This is designed to make it easier to deploy and manage data from customers’ OpenShift Kubernetes clusters, allowing Coralogix to be a native part of the OpenShift platform. 

“We believe Red Hat Marketplace is an essential destination to unlock the value of cloud investments,” said Lars Herrmann, Vice President, Partner Ecosystems, Product and Technologies, Red Hat. “With the marketplace, we are making it as fast and easy as possible for companies to implement the tools and technologies that can help them succeed in this hybrid multi-cloud world. We’ve simplified the steps to find and purchase tools like Coralogix that are tested, certified, and supported on Red Hat OpenShift, and we’ve removed operational barriers to deploying and managing these technologies on Kubernetes-native infrastructure.”
Coralogix provides a full trial product experience via the Redhat marketplace page.

Python JSON Log Limits: What Are They and How Can You Avoid Them?

Python JSON logging has become the standard for generating readable structured data from logs. While monitoring logs in JSON is definitely much better than using the standard logging module, it comes with its own set of challenges. 

As your server or application grows, the number of logs also increases exponentially. It’s difficult to go through JSON log files, even if it’s structured, due to the sheer size of logs generated. These Python JSON log limits will become a real engineering problem for you.

Let’s dive into how log management solutions help with these issues and how they can help streamline and centralize your log management, so you can surpass your Python JSON log limits and tackle the real problems you’re looking to solve.

Python Log File Sizes

Based on the server you’re using, you’ll encounter server-specific log file restrictions due to the database constraints. 

For instance, AWS Cloudwatch skips the log event if the file size is larger than 256 KB. In such cases, especially with longer log files like JSON generates, retaining specific logs on the server is complex. 

The good news is, this is one of the easier Python JSON log limits to overcome. In some cases, you can avoid this by increasing the python log size limit configurations on the server level. However, the ideal log size limit for the server varies depending on the amount of data that your application generates. 

So how do you avoid this Python JSON Log limit on your files?

The solution here is to implement logging analytics via Coralogix. Through this platform, you can integrate and transform your logging data with any webhook and record vital data without needing to manage it actively. Since it is directly integrated with Python, your JSON logs can be easily parsed and converted.

Servers like Elasticsearch also roll logs after 256 MB based on timestamps. However, when you have multiple deployments, filtering them just based on the timestamp or on a file limit size becomes difficult. More log files can also lead to confusion and disk space issues.

To help tackle this issue, Coralogix cuts down on your overall development time by providing version benchmarks on logs and an intuitive visual dashboard.

Python JSON Log Formatting

Currently, programs use Python’s native JSON library or external libraries to implement JSON logging. Filtering these types of outputs needs additional development. For instance, you can only have name-based filtering natively, but if you want to filter logs based on time, severity, and so on, you’ll have to program those filters in. 

By using log management platforms, you can easily track custom attributes in the JSON log and implement specialized filters without having to do additional coding. You can also have alert mechanisms for failures or prioritized attributes. This significantly cuts down the time to troubleshoot via logs in case of critical failures. Correlating these attributes to application performance also helps you understand the bigger picture through the health and compliance metrics of your application.

Wrapping Up

Python JSON logging combined with a log management solution is the best way to streamline your logs and visualize them centrally. Additionally, you should also check out python logging practices to ensure that you format and collect the most relevant data. Your Python JSON logger limits will potentially distract you from adding value, and it’s important to get ahead of them.

If you want to make the most out of your Python JSON logs, our python integration should help!

An Introduction to Log Analysis

If you think log files are only necessary for satisfying audit and compliance requirements, or to help software engineers debug issues during development, you’re certainly not alone. With proactive log monitoring, you configure thresholds for key health metrics and trigger alerts when these are exceeded. 

Although log files may not sound like the most engaging or valuable assets, for many organizations, they are an untapped reservoir of insights that can offer significant benefits to your business.

With the proper analysis tools and techniques, your log data can help you prevent failures in your systems, reduce resolution times, improve security, and deliver a better user experience.

Understanding log files

Before we look at the benefits that log analysis can offer you, let’s take a moment to understand what logs actually are. Logs – or log entries – are messages that are generated automatically while the software is running. 

That software could be an application, operating system, firewall, networking logic, or embedded program running on an IoT device, to name just a few. Logs are generated from every level of the software stack.

Each entry (or log line) provides a record of what was happening or the state of the system at a given moment in time. They can be triggered by a wide range of events, from everyday routine behavior, such as users logging in to workstations or requests made to servers, to error conditions and unexpected failures. 

The precise format and content of a log entry varies, but will typically include a timestamp, log severity level, and message. Each log line is written to a log file and stored – sometimes for a few days or weeks (if the data is not required for regulatory reasons) and sometimes for months or even years.

Benefits of log analysis

Log analysis is the process of collating and normalizing log data to be parsed and processed for easier querying and providing visualizations of that data to identify patterns and anomalies.

Analyzing the data recorded in the log files from across your organization’s systems and applications will help you improve your offer’s services, enhance your security posture, and give you a better understanding of how your systems are used.

Troubleshooting failures

The primary use of log files is to provide visibility into how your software is behaving so that you can track down the cause of a problem. As computing trends towards more distributed systems, with applications made up of multiple services running on separate but connected machines, investigating the source of an issue has become more complex.

Collating and analyzing logs from the various components in a system makes it possible to join the dots and make sense of the events that led up to an error or failure. Automated log analysis speeds up this process by identifying patterns and anomalies to help you fix issues faster. Log data analysis can also be used to identify early warning signs that can alert you to similar problems earlier in the future.

Proactive monitoring and observability

The benefits of automated log analysis go further than troubleshooting issues that have already occurred. By analyzing log data in real-time, you can spot emerging issues before any real damage is done.

Observability solutions take these techniques a step further, using machine learning to maintain a constantly evolving picture of normal operations, with alerts triggered whenever anomalous behavior patterns are detected.

Taking a proactive approach to anomaly detection and troubleshooting can significantly reduce the number of serious and critical failures that occur in your production systems and reduce mean time to resolution (MTTR) for issues that arise. The result is a better experience for your users and fewer interruptions to business activities.

Security forensics

Observability and monitoring play an essential role in detecting early signs of an attack and containing threats. If a malicious actor does breach your defenses, log files often provide clues regarding how the attack was executed and the extent of the damage perpetrated or the data leaked.

Log data analysis expedites this process by drawing connections between activities, such as user account activity taking place out of hours coupled with unusual data access patterns or privilege escalation. 

As well as providing the data required for reporting and audit compliance, this knowledge of how an attack was executed is essential for strengthening your defenses against similar threats in the future.

System design

As users’ expectations of software systems continue to rise, maintaining high-performance levels, stability and uptime are essential. Analyzing log data from across your IT estate can help you build a fuller picture of how your systems are used, providing you with data to inform your decisions to make targeted enhancements.

By tracking resource usage over time, you can be proactive about provisioning additional infrastructure to increase capacity or decommissioning it to save costs. Identifying slow-running database queries so that you can optimize them improves not only page load time but also reduces the risk of locks or resource saturation slowing down the rest of your system.

Using log data to understand how users interact with your application or website can also provide valuable insights into user behavior, including popular features, common requests, referring sites, and conversion rates. This information is invaluable when deciding where to next invest your development efforts.

Wrapping up

Log file analysis enables you to leverage the full benefits of your log data, transforming log files from a business cost required for regulatory reasons to a business asset that helps you streamline your operations and improve your services.

Istio Log Analysis Guide

Istio has quickly become a cornerstone of most Kubernetes clusters. As your container orchestration platform scales, Istio embeds functionality into the fabric of your cluster that makes log monitoring, observability, and flexibility much more straightforward. However, it leaves us with our next question – how do we monitor Istio? This Istio log analysis guide will help you get to the bottom of what your Istio platform is doing.

What is Istio Service Mesh?

Before we understand Istio, we’ll need to understand what a service mesh is. Imagine you have lots of applications running on your platform. Each application does something different, yet they all share a common set of problems. For example, authentication, traffic monitoring, rerouting traffic, performing seamless deployments, and so on. You could solve this problem in each application, but this would take a long time. 

So you solve the problem once, and let the service mesh handle it 

Instead, a service mesh creates a fabric that sits in between every application. You can adjust your mesh centrally, and those changes will be rolled out across the fabric to your various applications. Rather than solving the problem in every application individually, your solutions sit on the service mesh and, each time you configure a change in your mesh, your applications don’t know the difference.

Istio comes with a wide variety of these common features. A few of the popular uses of Istio are:

  • Traffic management using the Istio VirtualService
  • Generation of tracing metrics
  • Intelligent network segmentation
  • Implementing cluster wide policies for security
  • Generating consistent system logs for every application on the cluster
  • Implementing mutual TLS for encrypted traffic within the cluster

As you can imagine, software that is this complex has many moving parts and needs to be monitored closely, to ensure it is functioning properly.

How do you monitor Istio?

The most common mode of installation for Istio in modern clusters is to use the Istio operator. This approach makes upgrading more straightforward and allows you to simply declare which version of Istio you would like, rather than having to wire up all of the underlying components.

Monitoring the Istio Operator with Istio Log Analysis

The Istio operator produces logs and metrics that can give you an incredibly powerful insight into its health. These logs can be broken down into various scopes. These scopes break up the logs into their constituent functionality and enable you to view specific components within the operator pods, so if you wish to understand the functionality of one particular sub-component of the Istio operator, you can use the scopes to separately query your logs.

Istio log analysis needs centralised logs

Istio will produce a lot of logs, and if you’re trying to parse all of them by hand, you’re going to find yourself with more information than you can work with. Centralized log analytics make it easy for you to slice and query your log information, so you can quickly gain insights into your system without drowning in log files. In short, while you’re analyzing your Istio logs, Coralogix can handle your Istio log management.

The Envoy Access Logs are your best friend

One of the greatest benefits of Istio log analysis is the insights that come from the Envoy logs. Istio automatically injects a TCP proxy alongside your applications, that filters and analyses traffic. This proxy can be configured to block or allow traffic, depending on what you’d like to do. Out of the box, it also provides some powerful access logs.

What can you do with logs?

Istio log analysis offers a whole new dimension of observability into your cluster. While the metrics that Istio produces are very diverse and impressive, they only give part of the story. For example, your metrics may tell you that 3% of your traffic is failing for one of your microservices, but it won’t tell you that the same IP address is the source of all of those failures. For that, you need Istio log analysis.

Logging provides the context to your data and gives you real-world insights that you can use to immediately tackle the problems you’re trying to solve. Orchestration platforms typically scale fast. When engineers realize how easy it is to deploy new microservices, the number of services on the cluster grows and, with that growth, comes new operational challenges. Istio log analysis provides the context you need to understand issues as they arise and respond accordingly. 

But what if I prefer to use Metrics?

Metrics have their own power, of course. The ability to perform calculations on your metric values allows you to visualize and draw correlations between disparate measurements. Fortunately, Coralogix offers the Logs2Metrics service to unlock this power. You can input your logs into Coralogix and parse values out of them. These may include error count, request count, or latency.

Dive deeper with tracing

Istio also generates powerful tracing metrics. These metrics enable you to track the full lifecycle of a request, as it moves between your applications. This is a vital component of observability when you’re working with distributed systems in a microservices architecture. When this is enabled, you’ll be able to see traffic flowing through your systems and spot problem areas. You will be able to see that a whole request, through several microservices, took 10 seconds, but 5 seconds of that was caused by latency in a single service.

Sounds great! Why don’t we enable this for everything?

The simple answer is this – tracing can impact your performance. If you have a system that needs to process millions of requests every minute, the tiny latency overhead of your tracing metrics becomes expensive. For this reason, you should seek to enable tracing for those systems that really need it and can afford the extra overhead.

Summary

Istio provides a great deal of power to the user, but also comes with its own operational challenges. Istio log analysis is an essential part of your observability stack and will provide you with the context you need to get the job done. By focusing on logs and metrics, deploying your Istio instance using the Istio operator, centralizing your log analytics, and taking advantage of tracing and proxying, you’ll be able to make full use of your service mesh and focus on the problems that really matter.

CDN Logs – The 101 Guide

A Content Delivery Network (CDN) is a distributed set of servers that are designed to get your web-based content into the hands of your users as fast as possible. CDN monitoring produces CDN logs that can be analyzed, and this information is invaluable. Why? CDNs host servers all over the world and are designed to help you scale your traffic without maxing out your load balancers. A CDN also gives you added protection against many of the most common cyber attacks. This activity needs to be closely monitored.

A CDN, such as Akamai or Fastly, does all of this brilliant work, but we so often ignore the need to monitor it. CDN log analysis is the missing piece in your observability goal and it is a mistake to ignore it. A CDN is a fundamental part of your infrastructure and, as such, needs to be a first-class citizen in your alerting and monitoring conversations. 

Working with CDN Logs

Accessing the logs for your CDN will differ, depending on which provider you decide to go with. For example: 

Whichever the mechanism, you’ll need to create some method of extracting the logs directly from your provider. Once you have the logs, you need to understand what you’re looking at.  

A Typical Web Access Log

The following is a very common format of a web access log. Be mindful that on modern CDN monitoring solutions, you can change the format of your logs to use something more suited to CDN log analysis, like JSON, but this example will let you see the type of information that is typically available in your CDN logs and explain how to analyze your CDN logs:

127.0.0.1 username [10/Oct/2021:13:55:36 +0000] “GET /my_image.gif HTTP/2.0” 200 150 1289

Let’s break this line down into its constituent parts.

IP Address (127.0.0.1)

This is the source IP address from which the user has requested their data. This is useful because you’ll be able to see a high number of requests coming from the same IP address, which may give you an indication that someone is misusing your site.

Username (username)

Some providers will decode the Authorization header in the incoming request and attempt to find out the username. For example, a Basic authentication request contains the username and password encoded. If you detect any malicious activity, you may be able to trace it back to an account that you can close down.

Timestamp (10/Oct/2021:13:55:36 +0000)

As the name suggests, this portion of the log indicates when the request was sent. This is usually one of the key values when you’re looking to render this data out on a graph. For example, detecting sudden spikes in traffic.

Request Line (“GET /my_image.gif HTTP/2.0”)

The request line indicates the type of request and what was requested. For example, we can see that an HTTP GET request was issued. This means that the user was most likely requesting something from the server. Another example might be POST where the user is sending something to the server. You can also see which resource was requested and which version of the HTTP protocol was used.

HTTP Status (200)

The HTTP status lets you know whether your server was able to fulfill the request. As a general rule of thumb, if your HTTP status code begins with 2, it was most likely successful. Anything else indicates a different state. For example, 4XX status codes indicate that the request could not be fulfilled for some reason. For example, lack of authentication or a missing resource, as in the common error 404.

Latency (150)

Latency is a killer metric to track. Spikes in latency mean slow down for your users and can be the first indication that something is going wrong. Latency is the time taken between the request arriving at your CDN and the response being sent back to the user.

Response size (1289)

The response body size is an often ignored value, but it is incredibly important. If an endpoint that delivers a large response body is being used excessively, this can translate into much more work for the server. Understanding the response size gives you an idea of the true load that your application is under.

Monitoring Performance with CDN Log Analysis

So now you know what you can expect from your CDN logs, what kind of things should you be looking for? 

Slowdowns in response times (timestamp + latency)

If you monitor how much traffic you’re getting, you can immediately detect when something has gone wrong. If you include the latency property in this, you can quickly track when a slow-down is occurring.

Be careful of average latency

Averages are useful but they hide important information, such as variance. For example, if 9 of your requests respond in 100 ms but 1 of your requests take 10 seconds, your average latency will be about 1 second. From this, we can see that averages can hide information, so you need something different – percentiles.

It is best to take the median, 95th, and 99th percentile of your data. Using the same example again, the median from our data set would be 100ms (which reflects our most common data), the 95th would be 5545ms, and our 99th would be 9109ms. This shows us that while our data is around the 100ms mark, we’ve got a variance to investigate.

Managing live events

If you’re hosting a live event on your site, or perhaps hosting a webinar or live talk and you’re directing people to your site, that sudden influx of users is going to add a strain to your system and the CDN you’re using. You can check how much traffic you’re getting (by grouping requests into 1-second buckets and counting), or you can monitor latency to check for slowdowns. You could also look for errors in your logs to see if the users have uncovered a bug.

Understanding your site traffic with CDN Logs

It’s tempting to view your CDN logs as an operational measurement and nothing else, however, CDN logs are much more valuable. 

The marketing potential of CDN Logs

By monitoring the specific resources that users are requesting, you can identify your high-traffic pages. These high-traffic pages will make great locations for advertisements or product promotions. In addition, you can find where users drop off from your site and work to fix those pages.

Information Security

CDN logs help you to detect suspicious traffic. For example, web scraping software will work through your web pages. If you notice someone rapidly moving through every page in your site from the same IP address, you can be sure this is a scraper and you may wish to block this IP. 

But what do you do with these logs?

Coralogix offers a centralized, mature, scalable platform that can store and analyze your logs, using some of the most advanced observability techniques in the world. Correlating your logs across a centralized platform like Coralogix will enable you to combine your CDN insights with your application logs, your security scans, and much more, giving you complete observability and total insight into the state of your system. With integrations to Akamai, Fastly, Cloudflare, and AWS, you’re probably already in a position to get the best possible value out of Coralogix.

So is it worth it?

Whenever you use a CDN, these logs are a goldmine of useful information that will enable you to better understand the behavior of your users, the performance of your service, and the frequency of malicious requests that arrive at your website. These insights are fundamental for learning and growing your service, so you can safely scale and achieve your goals. While you grow, consider a full-stack observability platform like Coralogix, so you can skip the engineering headaches and get straight to the value.

Elasticsearch Audit Logs and Analysis

Security is a top-of-mind topic for software companies, especially those that have experienced security breaches. This article will discuss how to set up Elasticsearch audit logging and explain what continuous auditing logs track.

Alternatively, platforms can use other tools like the cloud security platform offered by Coralogix instead of internal audit logging to detect the same events with much less effort. 

Companies must secure data to avoid nefarious attacks and meet standards such as HIPAA and GDPR. Audit logs record the actions of all agents against your Elasticsearch resources. Companies can use audit logs to track activity throughout their platform to ensure usage is valid and log when events are blocked. 

Elasticsearch can log security-related events for accounts with paid subscriptions. Elasticsearch audit provides logging of events like authentications and data-access events, which are critical to understanding who is accessing your clusters, and at what times. You can use machine learning tools such as the log analytics tool from Coralogix to analyze audit logs and detect attacks.

Turning on Audit Logging in Elasticsearch

Audit General Settings

Audit logs are off by default in your Elasticsearch node. They are turned on by configuring the static security flag in your elasticsearch.yml (or equivalent .yml file). Elasticsearch requires this setting for every node in your cluster. 

xpack.security.audit.enabled=true

Enabling audit logs is currently the only static setting needed. Static settings are only applied, or re-applied, to unstarted or shut down nodes. To turn on Elasticsearch audit logs, you will need to restart any existing nodes.

Audit Event Settings

You can decide what events are logged on each Elasticsearch node in your cluster. Using the events.include or events.exclude settings, you can decide which security events Elasticsearch logs into its’ audit file. Using _all as your include setting will track everything. The exclude setting can be convenient when you want to log all audit event types except one or two.

xpack.security.audit.logfile.events.include=[_all]
xpack.security.audit.logfile.events.exclude=[run_as_granted]

You can also decide if the request body that triggered the audit log is included in the audit event log. By default, this data is not available in audit logs. If you need to audit search queries, use this setting, so the queries are available for analysis.

xpack.security.audit.logfile.events.emit_request_body=true

Audit Event Ignore Policies

Ignore policies allow you to search for audit events that you do not want to print. Use the policy_name value to link configurations together and form a policy with multiple settings. Elasticsearch does not print events that match all conditions in a policy.

Each of the ignore filters uses a list of values or wildcards. Values are known data for the given type.

xpack.security.audit.logfile.events.ignore_filters.<policy_name>.users=[*]
xpack.security.audit.logfile.events.ignore_filters.<policy_name>.realms=[*]
xpack.security.audit.logfile.events.ignore_filters.<policy_name>.actions=[*]
xpack.security.audit.logfile.events.ignore_filters.<policy_name>.roles=[*]
xpack.security.audit.logfile.events.ignore_filters.<policy_name>.indices=[*]

Node Information Inclusion in Audit Logs

Information about the node can be included in each audit log event. Each of the following settings is used to turn on one of the pieces of information that are available. By default, all are excluded except the node id value. Optional node data includes the node name, the node IP address, the node’s host name, and the node id.

xpack.security.logfile.emit_node_name=true
xpack.security.logfile.emit_node_host_address=true
xpack.security.logfile.emit_node_host_name=true
xpack.security.logfile.emit_node_id=true

Information Available in Elasticsearch Audit

Elasticsearch audit events are logged into a single JSON file. Each audit event is printed on a single line with no end-of-line delimiter. The format of the file is similar to a CSV in that it was meant to have columns. There are fields within it that follow JSON formatting with an ordered dot notation syntax containing any non-null string. The purpose was to make the file more easily readable by people as opposed to machines. 

An example of an Elasticsearch audit log is below. In it, there are several fields that are needed for analysis. For a complete list of the audit logs available, see the Elasticsearch documentation.

{"type":"audit", "timestamp":"2021-06-23T07:51:31,526+0700", "node.id":
"1TAMuhilWUVv_hBf2H7yXW", "event.type":"ip_filter", "event.action":
"connection_granted", "origin.type":"rest", "origin.address":"::3",
"transport.profile":".http", "rule":"allow ::1,127.0.0.1"}

The event.type attribute shows the internal layer that generated the audit event. This may be rest, transport, ip_filter, or security_config_change. The event.action attribute shows what kind of event occurred. The actions available depend on the event.type value, with security_config_change types having a different list of available actions than the others. 

The origin.address attribute shows the IP address at the source of the request. This IP address may be of the remote client, the address of another cluster, or the local node. In cases where the remote client connects to the cluster directly, you will see the remote IP address here. Otherwise, the address is listed with the first OSI layer 3 proxy in front of the cluster. The origin.type attribute shows the type of request made originally. This could be rest, transport, or local_node.

Where Elasticsearch Stores Audit Logs

A single log file is created for each node in your Elasticsearch cluster. Audit log files are written only to a local filesystem to keep the file secure and ensure durability. The default filename is <clustername>_audit.json

You can configure Filebeat in the ELK stack to collect events from the JSON file and forward them to other locations, such as back to an Elasticsearch index or into Logstash. Filebeat replaced the older model of Elasticsearch, where audit logs were sent directly to an index without queuing. This model caused logs to be dropped if the index rate of the audit log index was lower than the rate of incoming logs. 

This index ideally will be on a different node and cluster than where the logs were generated. Once the data is in Elasticsearch, it can be viewed on a Kibana audit logs dashboard or sent to another source such as the Coralogix full-stack observability tool, which can ingest data from Logstash. 

Configuring Filebeat to Write Audit Logs to Elasticsearch

After the Elasticsearch audit log settings are configured, you can configure the Filebeat settings to read those logs.

Here’s what you can do:

  1. Install Filebeat
  2. Enable the Elasticsearch module, which will ingest and parse the audit events
  3. Optionally customize the audit log paths in the elasticseach.yml file within the modules.d folder. This is necessary if you have customized the name or path of the audit log file and will allow Filebeat to find the logs.
  4. Specify the Elasticsearch cluster to index your audit logs. Add the configuration to the output.elasticsearch section of the filebeat.yml file
  5. Start Filebeat

Analysis of Elasticsearch Audit Logs

Elasticsearch audit logs hold information about who or what is accessing your Elasticsearch resources. This information is required for compliance through many government information standards such as HIPAA. In order for the data to be useful in a scalable way, analysis and visualization are also needed.

The audit logs include events such as authorization successes and failures, connection requests, and data access events. They can also include search query analysis when the emit_request_body setting is turned on. Using this data, professionals can monitor the Elasticsearch cluster for nefarious activity and prevent data breaches or reconstruct events. The completeness of the event type list means that with the analysis you can follow any given entity’s usage on your cluster.

If automatic streaming is available from Logstash or Elasticsearch, audit logs can be sent to other tools for analysis. Automatic detection of suspicious activity could allow companies to stop data breaches. Tools such as Coralogix’s log analysis can provide notifications for these events.

How does Coralogix fit in?

With Coralogix, you can send logs with our log analytics tool. This tool uses machine learning to find where security breaches are occurring in your system. You can also set up the tool to send notifications when suspicious activity is detected. 

In addition, the Coralogix security platform allows users to bypass the manual setup of Elasticsearch audit logging by detecting the same access events. This platform is a Security as Code tool that can be linked directly to your Elasticsearch cluster and will automatically monitor and analyze traffic for threats.

Summary

Elasticsearch audit logs require a paid Elasticsearch subscription and manual setup. The logs will track all requests made against your Elasticsearch node and log them into a single, locally stored JSON file. Your configuration determines what is and is not logged into the audit file. 

Your locally-stored audit file was formatted with the intention of being human-readable. However, reading this file is not a scalable or recommended security measure. You can stream audit logs to other tools by setting up Filebeat.

Using Coralogix to Gain Insights From Your FortiGate Logs

FortiGate, a next-generation firewall from IT Cyber Security leaders Fortinet, provides the ultimate threat protection for businesses of all sizes. FortiGate helps you understand what is happening on your network, and informs you about certain network activities, such as the detection of a virus, a visit to an invalid website, an intrusion, a failed login attempt, and myriad others.

This post will show you how Coralogix can provide analytics and insights for your FortiGate logs.

FortiGate Logs

FortiGate log events types are various and are divided into types (Traffic Logs, Event Logs, Security Logs, etc…) and subtypes per each type, you can view full documentation here. You may notice that the FortiGate logs are structured in a Syslog format, with multiple key/value pairs forming textual logs.

First, you will need to parse the data into a JSON log format to enjoy the full extent of the Coralogix capabilities and features and eventually, using Coralogix alerts and dashboards, instantly diagnose problems, spot potential security threats, and get a real-time notification on any event that you might want to observe. Ultimately, this offers a better monitoring experience and more capabilities from your data with minimum effort.

There are two ways to parse the FortiGate logs, either it is done on the integration side or at the 3rd party logging solution you are using if it allows a parsing engine. If you are using Coralogix as your logging solution you can use our advanced parsing engine to create series of rules within the same parsing group to eventually form a JSON object from the key/value pairs text logs. Let us review both options.

Via Logstash

In your logstash.conf add the following KV filter:

    filter {
      kv {
        trim_value => """
        value_split => "="
        allow_duplicate_values => false
      }
    }

Note that the arguments “value_split” and  “allow_duplicate_values” are not mandatory and by default, they are set with the values I am presenting here, I only added them for reference.

Sample log
date=2019-05-10 time=11:37:47 logid="0000000013" type="traffic" subtype="forward" level="notice" vd="vdom1" eventtime=1557513467369913239 srcip=10.1.100.11 srcport=58012 srcintf="port12" srcintfrole="undefined" dstip=23.59.154.35 dstport=80 dstintf="port11" dstintfrole="undefined" srcuuid="ae28f494-5735-51e9-f247-d1d2ce663f4b" dstuuid="ae28f494-5735-51e9-f247-d1d2ce663f4b" poluuid="ccb269e0-5735-51e9-a218-a397dd08b7eb" sessionid=105048 proto=6 action="close" policyid=1 policytype="policy" service="HTTP" dstcountry="Canada" srccountry="Reserved" trandisp="snat" transip=172.16.200.2 transport=58012 appid=34050 app="HTTP.BROWSER_Firefox" appcat="Web.Client" apprisk="elevated" applist="g-default" duration=116 sentbyte=1188 rcvdbyte=1224 sentpkt=17 rcvdpkt=16 utmaction="allow" countapp=1 osname="Ubuntu" mastersrcmac="a2:e9:00:ec:40:01" srcmac="a2:e9:00:ec:40:01" srcserver=0 utmref=65500-742
Output
{
	"date": "2019-05-10",
	"time": "11:37:47",
	"logid": "0000000013",
	"type": "traffic",
	"subtype": "forward",
	"level": "notice",
	"vd": "vdom1",
	"eventtime": "1557513467369913239",
	"srcip": "10.1.100.11",
	"srcport": "58012",
	"srcintf": "port12",
	"srcintfrole": "undefined",
	"dstip": "23.59.154.35",
	"dstport": "80",
	"dstintf": "port11",
	"dstintfrole": "undefined",
	"srcuuid": "ae28f494-5735-51e9-f247-d1d2ce663f4b",
	"dstuuid": "ae28f494-5735-51e9-f247-d1d2ce663f4b",
	"poluuid": "ccb269e0-5735-51e9-a218-a397dd08b7eb",
	"sessionid": "105048",
	"proto": "6",
	"action": "close",
	"policyid": "1",
	"policytype": "policy",
	"service": "HTTP",
	"dstcountry": "Canada",
	"srccountry": "Reserved",
	"trandisp": "snat",
	"transip": "172.16.200.2",
	"transport": "58012",
	"appid": "34050",
	"app": "HTTP.BROWSER_Firefox",
	"appcat": "Web.Client",
	"apprisk": "elevated",
	"applist": "g-default",
	"duration": "116",
	"sentbyte": "1188",
	"rcvdbyte": "1224",
	"sentpkt": "17",
	"rcvdpkt": "16",
	"utmaction": "allow",
	"countapp": "1",
	"osname": "Ubuntu",
	"mastersrcmac": "a2:e9:00:ec:40:01",
	"srcmac": "a2:e9:00:ec:40:01",
	"srcserver": "0",
	"utmref": "65500-742"
}

Via Coralogix

In settings –> Rules (available only for account admins) create a new group of rules with the following 3 REGEX-based replace rules. These rules should be applied consecutively (with an AND between them) on the FortiGate logs in order to format. Don’t forget to add a rule matcher to enable the parsing to take place only on your FortiGate data. Here are the rules:

  1. Regex pattern
    ([a-z0-9_-]+)=(?:")([^"]+)(?:")

    Replace pattern

    "$1":"$2",
  2. Regex pattern
    ([a-z0-9_-]+)=([0-9.-:]+|N/A)(?: |$)

    Replace pattern

    "$1":"$2",
  3. Regex pattern
    (.*),

    Replace pattern

    {$1}

For the same sample log above the result will be similar and the log entry you will have in Coralogix will be parsed as JSON.

FortiGate Dashboards

Here is an example FortiGate firewall Overview dashboard we created using FortiGate data. The options are practically limitless and you may create any visualization you can think of as long as your logs contain that data you want to visualize. For more information on using Kibana, please visit our tutorial.

FortiGate firewall Overview

FortiGate Alerts

Coralogix User-defined alerts enable you to easily create any alert you have in mind, using complex queries and various conditions heuristics, thus being more proactive with your FortiGate firewall data and be notified in real-time with potential system threats, issues, etc… Here are some examples of alerts we created using traditional FortiGate data.

The alert Condition can be customized to your pleasing and how it fits or satisfies your needs.

Alert name Description Alert Type Query Alert condition
FortiGate – new country deny action New denied source ip New Value action:deny Notify on new value in the last 12H
FortiGate – more than usual deny action More than usual access attempts with action denied Standard action:deny More than usual
FortiGate – elevated risk ratio more than 30% High apprisk ratio Ratio Q1 – apprisk:(elevated OR critical OR high)
Q2 – _exists_:apprisk
Q1/Q2>0.3 in 30 min
FortiGate – unscanned transactions 2x compared to the previous hour double of unscanned transactions comparing to previous hour Time relative appcat:unscanned current/an hour ago ration greater than 2x
FortiGate – critical risk from multiple countries alert if more than 3 unique destination countries with high/critical risk Unique count apprisk:(high OR critical) Over 3 unique dst countries in last 10 min

To avoid noise from these Alerts, Coralogix added a utility to allow you to simulate how the alert would behave. At the end of the alert, click verify Alert.

Need More Help with FortiGate or any other log data? Click on the chat icon on the bottom right corner for quick advice from our logging experts.