Beating the Security Talent Problem: The SRC Solution

In an era where digital threats are evolving rapidly, the need for skilled security professionals is at an all-time high. Companies are grappling with a unique dilemma: the acute shortage of top-tier talent in the cybersecurity realm.

But hiring an entire team poses its own set of risks. From the complexities of team dynamics to the cost of hiring, the constant upskilling and the ongoing retention efforts, these risks and costs stack up quickly.

On the flip side, not hiring enough or not having adequately skilled personnel can have dire consequences. Consider the aftermath of an exploited vulnerability—a breach can lead to significant financial losses, tarnished reputation and a myriad of other operational challenges.

So, what’s the solution? How does one navigate the treacherous waters of hiring while ensuring optimal security?

Meet Coralogix’s Snowbit SRC (Security Research Center)—your “best of both worlds” solution.

Harnessing the power of the SRC

The SRC presents an elegant middle ground, eliminating the need to make a tough choice between the two extremes. Instead of embarking on a lengthy hiring process and establishing processes from scratch, SRC offers instant access to a pool of talented, experienced Security Analysts, Engineers, and Researchers who are specifically trained in the details of your organization, with an enormous wealth of experience to draw from. 

Imagine having a dedicated team, already in sync, ready to be deployed for your organization. And the best part? The ramp-up time is just days, not the agonizing months typically associated with in-house team setups.

24x7x365 coverage

Cyberthreats never sleep, so the Coralogix SRC offers round the clock support, monitoring and investigating your environment and piecing together a true picture of your security posture, and using this insight to provide remediation recommendations grounded in data and decades of experience. 

Bespoke onboarding and customized insights 

Cookie-cutter approaches only give surface level insights. The Coralogix SRC will take a completely tailored approach to investigation and remediation within your environment, to ensure that even the most complex issues are understood and clear, effective remediations are recommended. Enjoy direct points of contact with dedicated members of the SRC team, who are committed to the success of your security goals and the maintenance of your security posture. 

Trusted globally across industries

The Coralogix SRC is already leveraged by companies in SaaS, eCommerce, highly regulated financial services and more, so you’re in good company when you enlist our services.

Expertise in every cloud

Our Coralogix SRC team have deep knowledge of AWS, Azure & GCP, so regardless of your cloud infrastructure setup, the SRC team will rapidly turn investigations into insights and recommendations. 

Much more than monitoring

The Coralogix SRC is able to offer security resource such as automated penetration testing, as well as threat hunting drills, security reviews and more. Book a demo with us to find out about these services, and more. 

90% cost reduction

On average, the SRC costs a mere 10% of the cost of going it alone in an organization. Rather than spending 10x more, for a longer ramp up time and delayed ROI, tap into the Coralogix SRC and see instant value. 

Instantly Create a Security Capability Today

In the face of rising digital threats and a scarce talent pool, businesses no longer need to compromise. Snowbit by Coralogix’s SRC offers a streamlined, efficient, and effective solution, ensuring that businesses get top-tier security expertise without the hassles and risks associated with traditional hiring. In the quest for digital security, the SRC is the ace up your sleeve.

Threat Intelligence Feeds: A Complete Overview

Cybersecurity is all about staying one step ahead of potential threats. With 1802 data compromises impacting over 422 million individuals in the United States in 2022, threat intelligence feeds are a key aspect of cybersecurity today.

These data streams offer real-time insights into possible security risks, allowing organizations to react quickly and precisely against cyber threats. However, leveraging threat intelligence feeds can be complicated. 

This article will explain threat intelligence feeds, why they’re important, describe different types of threat intelligence feeds and how organizations use them to protect against cyber attacks.

Coralogix security offers a seamless and robust way to enrich your log data and more easily protect against a wide array of cyber threats.

What is a threat intelligence feed?

A threat intelligence feed is a comprehensive flow of data that sheds light on potential and existing cyber threats. It encompasses information about various hostile activities, including malware, zero-day attacks and botnets.

Security researchers curate these feeds, gathering data from diverse private and public sources, scrutinizing the information, and compiling lists of potential malicious actions. These feeds are not just a critical tool for organizations, but an essential part of modern security infrastructure.

Threat intelligence feeds assist organizations in identifying patterns related to threats and in modifying their security policies to match. They minimize the time spent gathering security data, provide ongoing insights into cyber threats, and supply prompt and accurate information to security teams.

By seamlessly integrating threat intelligence feeds into their existing security structure, organizations can preemptively tackle security threats before they evolve into significant issues.

Why are threat intelligence feeds important?

Threat intelligence feeds are pivotal in contemporary cybersecurity efforts. Let’s break down their significance:

  1. Real-time awareness: Threat intelligence feeds provide instantaneous updates on emerging threats. This timely intel equips security teams to act fast, curbing the potential fallout of an attack.
  2. Bolstered security measures: Gaining insights into the characteristics and behaviors of threats lets organizations adjust their security protocols. Threat intelligence feeds are the key to optimizing these measures for specific threats.
  3. Informed strategic choices: Offering essential insights and threat intelligence feeds to aid in crafting informed decisions about security investments, policies, and strategies. They guide organizations to focus on the most pressing vulnerabilities and threats, ensuring the optimal allocation of resources.
  4. Synergy with existing tools: Threat intelligence feeds can mesh with existing security technologies, prolonging their effectiveness and enhancing their ROI. This synergy is part of a broader strategy where observability and security work together to provide comprehensive protection.
  5. Anticipatory response: Supplying real-time threat data, these feeds allow security teams to nip threats in the bud before they balloon into significant issues. This foresight can translate into substantial cost savings by preventing major data breaches and reducing recovery costs.
  6. Industry-specific insights: Threat intelligence feeds can cater to specific industries, delivering unique insights pertinent to certain business domains. This specialized information can be invaluable in guarding against threats that loom larger in specific sectors.

Threat intelligence feeds are more than a mere information repository; they are a tactical asset that amplifies an organization’s prowess in threat detection, analysis, and response. By capitalizing on threat intelligence feeds, organizations can fortify their security stance, consistently staying a stride ahead of potential cyber dangers.

Types of threat intelligence

Organizations must understand the various kinds of threat intelligence, allowing them to opt for the feeds that suit their unique needs and objectives. Here’s a look at seven key types of threat intelligence:

  1. Tactical threat intelligence: Focusing on imminent threats, this type delivers detailed insights about specific indicators of compromise (IoCs). Common among security analysts and frontline defenders, tactical intelligence speeds up incident response. It includes IP addresses, domain names and malware hashes.
  1. Operational threat intelligence: This type is concerned with understanding attackers’ tactics, techniques, and procedures (TTPs). By offering insights into how attackers function, their incentives, and the tools they employ, operational intelligence lets security teams foresee possible attack approaches and shape their defenses accordingly.
  2. Strategic threat intelligence: Providing a wide-angle view of the threat environment, strategic intelligence concentrates on extended trends and burgeoning risks. It guides executives and decision-makers in comprehending the overarching cybersecurity scenario, aiding in informed strategic choices. This analysis often includes geopolitical factors, industry dynamics and regulatory shifts.
  1. Technical threat intelligence: Technical intelligence focuses on the minute details of threats, such as malware signatures, vulnerabilities, and attack paths. IT professionals utilize this intelligence to grasp the technical facets of threats and formulate particular counteractions, employing various cybersecurity tools to safeguard their businesses.
  1. Industry-specific threat intelligence: Some threat intelligence feeds are tailored to particular sectors such as finance, healthcare, or vital infrastructure. They yield insights into threats especially relevant to a defined sector, enabling organizations to concentrate on risks most applicable to their industry. This customized intelligence can be priceless in safeguarding against targeted onslaughts.
  1. Local threat intelligence: This type involves gathering and scrutinizing data from an organization’s individual environment. Organizations can carve out a tailored perspective of the threats peculiar to their setup by analyzing local logs, security happenings, and warnings. It assists in pinpointing and thwarting threats that bear direct relevance to the organization.
  1. Open source threat intelligence: Open source intelligence (OSINT) collects data from publicly accessible sources like websites, social media platforms, and online forums. Though potentially rich in information, it can lead to redundancy or cluttered data, demanding careful handling to maintain relevance and precision.

Organizations can cherry-pick the feeds that harmonize with their security requirements, industrial niche, and objective.

How do threat intelligence feeds work?

Threat intelligence feeds are more than just lists of threats; they are dynamic and complex systems that require careful management and integration. Here’s how they work:

  1. Collection and normalization: Threat intelligence feeds gather data from a diverse array of sources, including public repositories, commercial suppliers, and in-house data pools. The raw data, once gathered, undergoes normalization to a uniform format, priming it for subsequent analysis.
  2. Enrichment and analysis: Enrichment adds context to the data, like linking IP addresses with identified malicious undertakings. The enhanced data is then scrutinized to detect patterns, trends, and interconnections, thereby exposing novel threats and laying bare the strategies of the attackers.
  3. Integration and dissemination: Post-analysis, the intelligence must be woven into the organization’s standing security framework, granting various security instruments access. It is then disseminated to relevant stakeholders, ensuring timely response to emerging threats.
  4. Feedback and customization: A feedback loop allows continuous improvement, while customization enables organizations to focus on specific threats or industries. These processes ensure that the intelligence remains relevant, accurate, and valuable to the organization’s unique needs, aligning with a unified threat intelligence approach.
  5. Compliance and reporting: Threat intelligence feeds also play a role in adherence to regulations by furnishing comprehensive reports on threats and the overarching security stance, abiding by the regulatory mandates concerning cybersecurity.

Threat intelligence with Coralogix

Threat intelligence feeds are a cornerstone in cybersecurity, offering real-time insights and actionable data to combat evolving cyber threats. They enable organizations to proactively enhance security measures, ensuring robust protection against potential risks.

Coralogix’s Unified Threat Intelligence elevates this process by offering seamless integration with top threat intelligence feeds, curated by Coralogix security experts. Without any need for complex configurations or API integrations, Coralogix can automatically enrich log data with malicious indicators in real-time, facilitating efficient threat detection and alerting.

The enriched logs are stored to your own remote storage, allowing you to query directly from Coralogix with infinite retention and even research the data with external tools. Explore Coralogix security and discover how the platform can enhance your organization’s security posture and keep you one step ahead of potential threats.

Centralized Log Management: Why It’s Essential for System Security in a Hybrid Workforce

Remote work increased due to Covid-19. Now heading into 2023, remote or hybrid workplaces are here to stay. Surveys show 62% of US workers report working from home at least occasionally, and 16% of companies worldwide are entirely remote. With a hybrid workforce, security breaches from sources were less typical with in-office work. 

While working remotely, employees must consider many things they would not be concerned about within an office. This includes using personal devices for business purposes, using an unsecured network for work, and even leaving a device unattended or worrying about who is behind you at the coffee shop. There are many new avenues for cybercriminals to attack, showing why cybercrimes have increased by 238% since the pandemic’s start. Security threats from human error, misconfigured cloud infrastructure, and trojans rose in 2021 while work-from-home was in full swing. The rise in security breaches proves system security is essential for businesses, large and small, to avoid big payouts to recover from breaches.

There is an increased prevalence of cybercriminals taking advantage of the transition to remote work. Companies must implement new and improved security measures, such as log monitoring, to reduce the chances of successful infiltration. 

Use IAM to Secure Access

To prevent cybercrimes, companies need to secure their employees’ work-from-home networks. Identity access management (IAM) can be used to secure home networks while enabling easy access to data required for their role. Ideally, the IAM solution is implemented with least-privilege access, so the employee only has access to what they need and nothing more. 

When employees need access to critical data, ensure it is not simply downloaded to their company device. Instead, either store the data in the cloud where it can be accessed without download. Monitoring logs and the data is accessed is necessary to ensure bad actors are not gaining access. Authentication events can be logged and monitored for this purpose. If data does require a download, companies should provide employees with additional tools like virtual private networks (VPN), so they can access the company network remotely. 

Log Access and Authentication Events

With remote work, employees use individual networks rather than a company network to access their required work. Corporate networks can set up a perimeter at an office, allowing only trusted devices. With remote work, this perimeter is easier to breach, and cyber criminals are taking advantage. Once they enter the network, they can take nefarious actions like ransomware attacks. 

Using a VPN is a secure way for employees to connect to a corporate network. But, they are only secure if appropriately implemented with multi-factor authentication and up-to-date security protocols. So, even when using a VPN, bad actors may gain access to your network.

To reduce the risk of a security breach, logs and log analysis can be used to detect a bad actor in your network. Logging authentication and authorization events allow for data analysis. Machine-learning analytics can detect bad actors in your system so you can take action to prevent downtime and ransomware attacks.

Centralize Log Storage to Enable Fast Analysis

Extra logging needs to be enabled to better secure networks that allow remote access. The logs also need to be monitored for the logging to be useful in preventing security breaches. This is extremely difficult when logs are stored separately, forcing IT teams to monitor logs in multiple locations. Centralized log storage and management make getting the insights you need to detect security breaches easier. 

Once logs are combined, IT teams can adequately monitor events. They can also use the logs to assess security risks, respond to incidents, investigate past events, and run a secure software development lifecycle. Centralized logs also lend well to custom dashboard setups that allow IT professionals to monitor logs more efficiently. 

Centralize logs from different parts of your system to ensure they can be analyzed appropriately. This includes logs from IAM tools, network devices, and VPNs. Once logs are combined, they can be analyzed by machine learning tools to detect specific security breaches. These analyses can detect issues as they happen to hasten responses and mitigate risk to your stored data and product. 

Example: Detecting Ransomware Through Log Management

When clicking on a malicious link, ransomware can be downloaded to an employee’s computer. The goal of the download is to install without the employee’s knowledge. Ransomware sends information to another server controlled by cybercriminals. The cybercriminals can then use the server to direct the infected employee device or encrypt data. 

Since the employee’s computer needs to connect to this external server for the ransomware to run, an attack can be detected by monitoring network traffic on the employee’s computer. Depending on the ransomware, different logs may be relevant to detect the security breach including web proxy logs, email logs, and VPN logs. Since different log formats can be used to detect the breach, combining them into a single location can assist IT teams in detecting the security risk. 

Summary

The increase in remote workers has changed how cybercriminals can attack company servers. Ransomware, malware, data theft, and trojans have all significantly increased since the start of the Covid-19 pandemic. Companies must find new ways to mitigate these security risks for remote workers. 

Implementing safeguards is critical to a company’s security. Use IAM to authenticate users and limit their access to only what they need to work. Using VPN is essential for remote workers who need access to sensitive data. 

Since there is always risk of security breaches, centralized log management can mitigate risks even when stringent methods are used. By collecting logs in a single location, analytics can be employed to quickly detect security breaches so IT teams can take corrective action sooner. SaaS offerings like Coralogix can provide centralized log management and analytics to detect security breaches.

DevOps Security: Challenges and Best Practices

With the shift from traditional monolithic applications to the distributed microservices of DevOps, there is a need for a similar change in operational security policies. For example, how do you secure a disparate number of micro-systems operating with multiple access credentials across a multi-level organization? DevSecOps (Devops security) answers this question by integrating application security considerations at every level of your development process.

While DevOps methodologies generally prioritize the speed of deployment over all other stages of the SDLC, the increased volume of operation nodes (automation tools, APIs, cloud containers) makes security crucial to the process. DevOps security is the marriage (often an uneasy one) between the DevOps landscape and information security policies. 

Traditionally, developers built, then tried to secure. With DevOps security, you secure as you build. However, with this comes a new challenge — you must monitor your systems regularly to identify any potential loose ends as you balance security and development. In other words, ensure your system is always observable, and your security journey will become much easier.

In this article, we’ll delve further into some of the main challenges of implementing DevOps security and some best practices you can adopt to ensure minimal friction between your DevOps and security teams.

Challenges of Implementing Effective DevOps Security Measures

Access Management and Data Flow:

One of the first challenges you’ll come across when implementing a DevOps security strategy is how to distribute access and data. You need to give your teams the access they need to do their jobs — while ensuring there are no unsecured credentials that hackers can target. 

You also need to ensure that your data-sharing policies are structured to eliminate silos while preventing unauthorized access to sensitive information. Silos cause slow response times, and that can have a direct impact on your application’s health, and overall revenue.

Further, access control is not just a safety precaution; it’s also a compliance measure. This brings us to the next challenge…

Industry Compliance:

Every company has a list of industry security standards to comply with to remain functional. Traditionally, security teams handle compliance by manually processing data from spreadsheets, workflows, and design documentation.

But since DevOps prioritizes speed, you’d often find that design documentation is usually minimal, even if the application is vast. Developers might even import third-party codes and tools are imported to get the work done, which isn’t always compliant with industry standards.

Also, many security teams usually adopt an audit-based compliance strategy, which means they wait until a scheduled quarterly or annual review to perform their compliance reviews. This approach works fine in a traditional deployment system where changes only come once or twice a year from aggregated feedback. 

However, in a DevOps environment, where companies release multiple micro-updates in a day (Amazon deployed over 50 million changes in 2014), security teams need to constantly monitor and evaluate updates as they are deployed, which presents a serious challenge. 

Integrating Security Into the Continuous Development and Deployment Process:

As a developer or a development team lead focuses on speedy deployment and response times in your development process, security considerations can often come as an afterthought. 

Importing third-party codes without proper scrutiny, leaving vital credentials in your configuration files, and even implementing new tools without proper security testing. All these are security issues that can result from the speed-oriented approach of DevOps.

More than that, integrating security frameworks into an already working process is definitely a challenging task — both in terms of tools and re-training your existing staff.

All these constitute a set of unique challenges that make the implementation of DevOps security not quite as easy as every developer would like it to be. Here are some DevOps security best practices that you can use to address these challenges effectively.

Best Practices for Addressing DevOps Security Challenges

A Robust Identity and Access Management System

A robust identity and access management system will help you solve many of the problems with data and access management in DevOps security. 

For instance, using a centralized full-stack observability platform like Coralogix allows your security teams to access application logs without logging into every application. Its log management dashboard gives you a central view of your application data, making it easy to see which credentials are used and identify unauthorized access. 

Security Assessments and Vulnerability Testing

You need a similarly agile security strategy in an agile development landscape like DevOps. You need to be able to perform on-the-spot security assessments and vulnerability testing to determine the security of deployed applications. You can’t afford to wait for a quarterly review when the apps you are testing can change multiple times in a day.

Coralogix can provide you with real-time threat detection capabilities that can identify potential threats and security issues before they disrupt your system. By logging all internal and external traffic interacting with your applications, Coralogix provides you with deeper visibility into your systems for quicker identification and response. Coralogix’s advanced AI system can also create DevOps security alerts and reports in case of any suspicious activity, which your Dev team can use to monitor their newly deployed applications for security threats.

Security Testing Tools

To make it easier for your DevOps team to adopt security practices in their workflows, you need to implement security testing tools they can deploy alongside their other workflows. This makes it easier for them to carry out security testing as they work rather than deferring it until they finish building.

A quick tip: You can apply the Infrastructure-as-Code policy to your security strategy. This DevOps policy creates packets of code that can be deployed as infrastructure instead of a traditional model of manual configuration of servers and software. By deploying this in your security stack, your DevOps team has much less to do to apply security measures to their code.

DevOps Security: Redefining Your Approach to Application Security

With DevOps security, you can transform workflows and integrate security-first policies in your app development and deployment process. DevSecOps requires a complete shift in your tooling and your development team’s culture and work approach. Of course, this major shift comes with its challenges.

That is why observability i.e., knowing your system’s health, is critical at all times. With Coralogix, you can gain deeper visibility into your application health as you integrate security into your DevOps processes.

One Click Visibility: Coralogix expands APM Capabilities to Kubernetes

There is a common painful workflow with many observability solutions. Each data type is separated into its own user interface, creating a disjointed workflow that increases cognitive load and slows down Mean Time to Diagnose (MTTD).

At Coralogix, we aim to give our customers the maximum possible insights for the minimum possible effort. We’ve expanded our APM features (see documentation) to provide deep, contextual insights into applications – but we’ve done something different.

Why is APM so important?

Application Performance Monitoring (APM) is one of the most sophisticated capabilities in the observability industry. It allows engineers and operators to inspect detailed application and infrastructure performance metrics. This can include everything from correlated host and application metrics to the time taken for a specific subsystem call. 

APM has become essential due to two major factors:

  • Engineers are reusing more and more code. Open-source libraries provide vast portions of our applications. Engineers don’t always have visibility of most of our application(s).
  • As the application stack grows more extensive, with more and more components performing increasingly sophisticated calculations, the internal behavior of our applications contains more and more useful information.

What is missing in other providers?

Typically, most providers fall victim to the data silo. A siloed mentality encourages engineers to separate their interface and features from the data, not the user journey. This means that in most observability providers, APM data is held in its own place, hidden away from logs, metrics, traces, and security data.

This makes sense from a data perspective. They are entirely different datasets typically used, with varying data demands. This is the basis for the argument to separate this data. We saw this across our competitors and realized that this was slowing down engineers, prolonging outages, and making it more difficult for users to convert their data into actionable insights.

How is Coralogix approaching APM differently?

Coralogix is a full-stack observability platform, and the features across our application exemplify this. For example, our home dashboard covers logs, metrics, traces, and security data:

The expansion of our APM capability (see documentation) is no different. Rather than segregating our data, we want our customers to journey through the stack naturally rather than leaping between different data types to try and piece together the whole picture. With this in mind, It all begins with traces.

Enter the tracing UI and view traces. The filter UI allows users to slice data in several ways, for example, filtering by the 95th Percentile of latency.

Select a span within a trace. This opens up a wealth of incredibly detailed metrics related to the source application. Users can view the logs that were written during the course of this span. This workflow is typically achieved by noting the time of a span and querying them in the logging UI. At Coralogix, this is simply one click.

Track Application Pod Metrics

However, the UI now has the Pod and Host metric for a more detailed insight into application health at the time that the span was generated. These metrics will provide detailed insights into the health of the application pod itself within the Kubernetes cluster. It shows metrics from a few minutes before and after the span so that users can clearly see the sequence of events leading to their span. This level of detail allows users to diagnose even the most complex application issues immediately.

Track Infrastructure Host Metrics

In addition to tracking the application’s behavior, users can also take a wider view of the host machine. Now, it’s possible to detect when the root cause isn’t driven by the application but by a “noisy neighbor.” All this information is available, alongside the tracing information, with only one click between these detailed insights.

Tackle Novel Problems Instantly

If a span took longer than expected, inspect the memory and CPU to understand if the application was experiencing a high load. If an application throws an error, inspect the logs and metrics automatically attached to the trace to better understand why. This connection, between application level data and infrastructure data, is the essence of cutting-edge APM. 

Combined with a user-focused journey, with Coralogix, a 30-minute investigation becomes a 30-second discovery. 

Full-Stack Observability Guide

Like cloud-native and DevOps, full-stack observability is one of those software development terms that can sound like an empty buzzword. Look past the jargon, and you’ll find considerable value to be unlocked from building data observability into each layer of your software stack.

Before we get into the details of monitoring observability, let’s take a moment to discuss the context. Over the last two decades, software development and architecture trends have departed from single-stack, monolithic designs toward distributed, containerized deployments that can leverage the benefits of cloud-hosted, serverless infrastructure. 

This provides a range of benefits, but it also creates a more complex landscape to maintain and manage: software breaks down into smaller, independent services that deploy to a mix of virtual machines and containers hosted both on-site and in the cloud, with additional layers of software required to manage automatic scaling and updates to each service, as well as connectivity between services.

At the same time, the industry has seen a shift from the traditional linear build-test-deploy model to a more iterative methodology that blurs the boundaries between software development and operations. This DevOps approach has two main elements. 

First, developers have more visibility and responsibility for their code’s performance once released. Second, operations teams are getting involved in the earlier stages of development — defining infrastructure with code, building in shorter feedback loops, and working with developers to instrument code so that it can output signals about how it’s behaving once released. 

With richer insights into a system’s performance, developers can investigate issues more efficiently, make better coding decisions, and deploy changes faster.

Observability closely ties into the DevOps philosophy: it plays a central role in providing the insights that inform developers’ decisions. It depends on addressing matters traditionally owned by ops teams earlier in the development process.

What is full-stack observability?

Unlike monitoring, observability is not what you do. Instead, it’s a quality or property of a software system. A system is observable if you can ask questions about the data it emits to gain insight into how it behaves. Whereas monitoring focuses on a pre-determined set of questions — such as how many orders are completed or how many login attempts failed — with an observable system, you don’t need to define the question.

Instead, observability means that enough data is collected upfront allowing you to investigate failures and gain insights into how your software behaves in production, rather than adding extra instrumentation to your code and reproducing the issue. 

Once you have built an observable system, you can use the data emitted to monitor the current state and investigate unusual behaviors when they occur. Because the data was already collected, it’s possible to look into what was happening in the lead-up to the issue.

Full-stack observability refers to observability implemented at every layer of the technology stack. – From the containerized infrastructure on which your code is running and the communications between the individual services that make up the system, to the backend database, application logic, and web server that exposes the system to your users.

With full-stack observability, IT teams gain insight into the entire functioning of these complex, distributed systems. Because they can search, analyze, and correlate data from across the entire software stack, they can better understand the relationships and dependencies between the various components. This allows them to maintain systems more effectively, identify and investigate issues quickly, and provide valuable feedback on how the software is used.

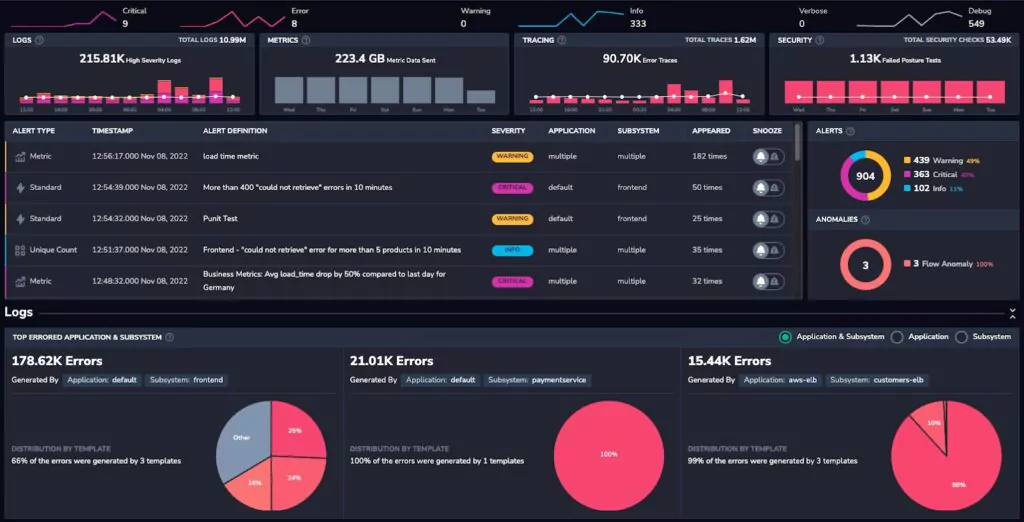
So how do you build an observable system? The answer is by instrumenting your code to emit signals and collect telemetry centrally so that you can ask questions about how it’s behaving and why it’s running in production. The types of telemetry can be broken down into what is known as the “four pillars of observability”: metrics, logs, traces, and security data. 

Each pillar provides part of the picture, as we’ll discuss in more detail below. Ensuring these types of data are emitted and collating that information into a single observability platform makes it possible to observe how your software behaves and gain insights into its internal workings.

Deriving value from metrics

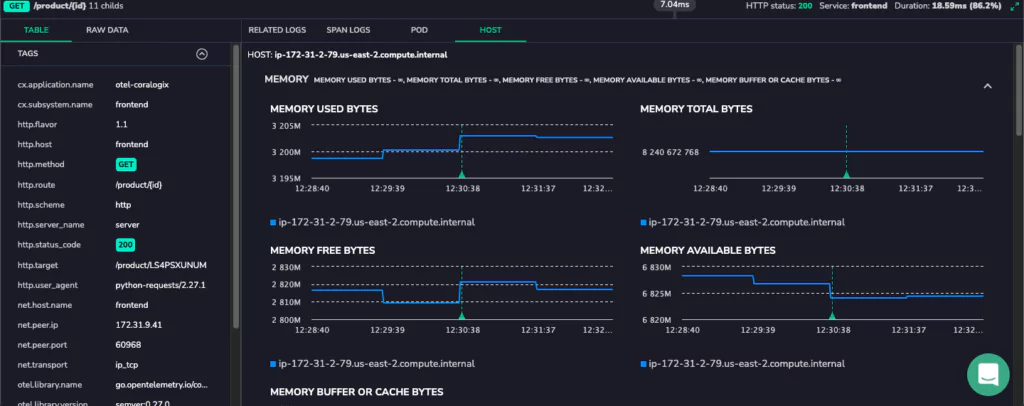
The first of our four pillars is metrics. These are time series of numbers derived from the system’s behavior. Examples of metrics include the average, minimum, and maximum time taken to respond to requests in the last hour or day, the available memory, or the number of active sessions at a given point in time.

The value of metrics is in indicating your system’s health. You can observe trends and identify any significant changes by plotting metric values over time. For this reason, metrics play a central role in monitoring tools, including those measuring system health (such as disk space, memory, and CPU availability) and those which track application performance (using values such as completed transactions and active users).

While metrics must be derived from raw data, the metrics you want to observe don’t necessarily have to be determined in advance. Part of the art of building an observable system is ensuring that a broad range of data is captured so that you can derive insights from it later; this can include calculating new metrics from the available data.

Gaining specific insights with logs

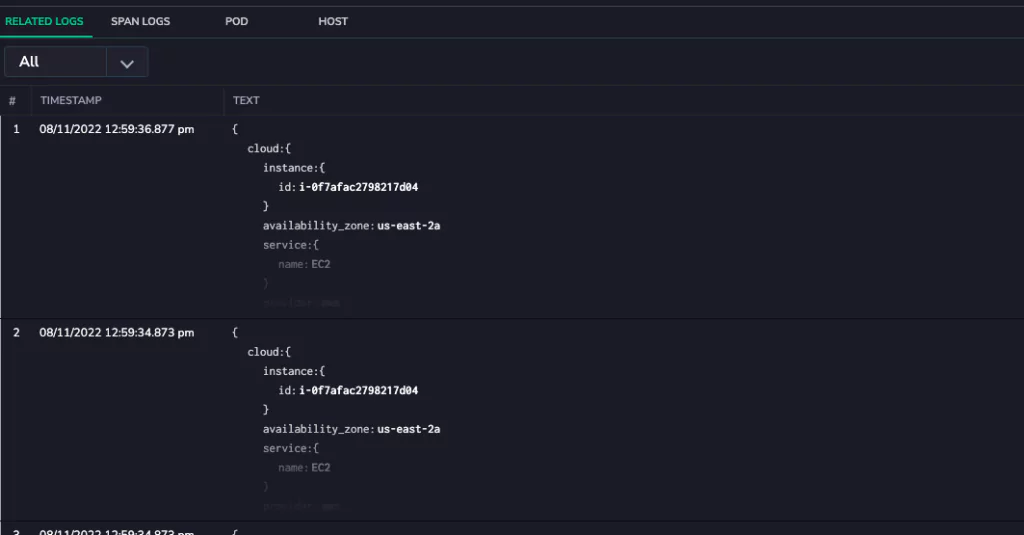
The next source of telemetry is logs. Logs are time-stamped messages produced by software that record what happened at a given point. Log entries might record a request made to a service, the response served, an error or warning triggered, or an unexpected failure. Logs can be produced from every level of the software stack, including operating systems, container runtimes, service meshes, databases, and application code.

Most software (including IaaS, PaaS, CaaS, SaaS, firewalls, load balancers, reverse proxies, data stores, and streaming platforms) can be configured to emit logs, and any software developed in-house will typically have logging added during development. What causes a log entry to be emitted and the details it includes depend on how the software has been instrumented. This means that the exact format of the log messages and the information they contain will vary across your software stack.

In most cases, log messages are classified using logging levels, which control the amount of information that is output to logs. Enabling a more detailed logging level such as “debug” or “verbose” will generate far more log entries, whereas limiting logging to “warning” or “error” means you’ll only get logs when something goes wrong. If log messages are in a structured format, they can more easily be searched and queried, whereas unstructured logs must be parsed before you can manipulate them programmatically.

Logs’ low-level contextual information makes them helpful in investigating specific issues and failures. For example, you can use logs to determine which requests were produced before a database query ran out of memory or which user accounts accessed a particular file in the last week. 

Taken in aggregate, logs can also be analyzed to extrapolate trends and detect past and real-time anomalies (assuming they are processed quickly enough). However, checking the logs from each service in a distributed system is rarely practical. To leverage the benefits of logs, you need to collate them from various sources to a central location so they can be parsed and analyzed in bulk.

Using traces to add context

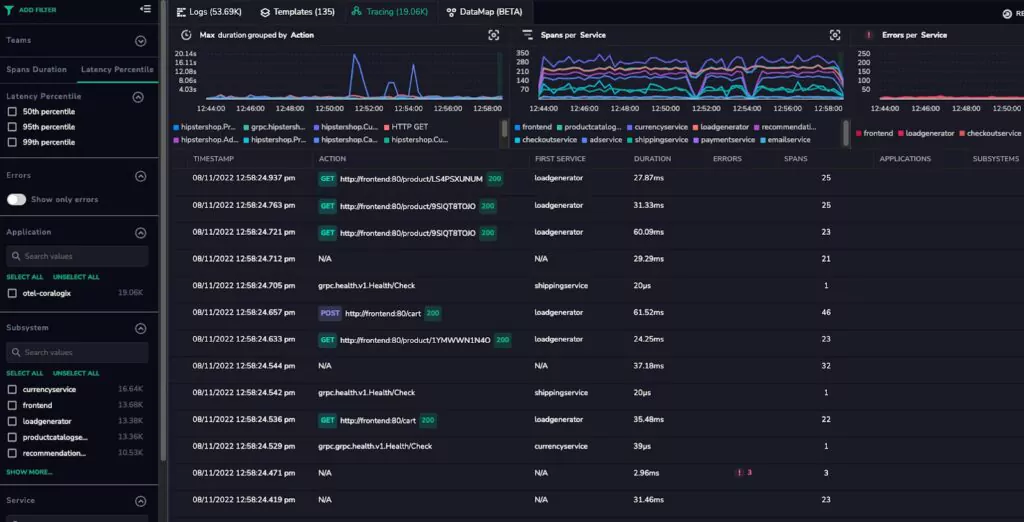
While metrics provide a high-level indication of your system’s health and logs provide specific details about what was happening at a given time, traces supply the context. Distributed tracing records the chain of events involved in servicing a particular request. This is especially relevant in microservices, where a request triggered by a user or external API call can result in dozens of child requests to different services to formulate the response.

A trace identifies all the child calls related to the initiating request, the order in which they occurred, and the time spent on each one. This makes it much easier to understand how different types of requests flow through a system, so that you can work out where you need to focus your attention and drill down into more detail. For example, suppose you’re trying to locate the source of performance degradation. In that case, traces will help you identify where the most time is being spent on a request so that you can investigate the relevant service in more detail.

Implementing distributed tracing requires code to be instrumented so that trace identifiers are propagated to each child request (known as spans), and the details of each span are forwarded to a database for retrieval and analysis.

Adding security data to the picture

The final element of the observability puzzle is security data. Whereas the first three pillars represent specific types of telemetry, security data refers to a range of data, including network traffic, firewall logs, audit logs and security-related metrics, and information about potential threats and attacks from security monitoring platforms. As a result, security data is both broader and narrower than the first three pillars.

Security data merits inclusion as a pillar in its own right because of the crucial importance of defending against cybersecurity attacks for today’s enterprises. In the same way that the importance of building security into software has been highlighted by the term DevSecOps, including security as a pillar in its own right serves to highlight the role that observability plays in improving software security and the value to be had from bringing all available data into a single platform.

As with metrics, logs, and traces, security data comes from multiple sources. One of the side effects of the trend towards more distributed systems is an increase in the potential attack surface. With application logic and data spread across multiple platforms, the network connections between individual containers and servers and across public and private clouds have become another target for cybercriminals. Collating traffic data from various sources makes it possible to analyze that data more effectively to detect potential threats and investigate issues efficiently.

Using an observability platform

While these four types of telemetry provide valuable data, using each in isolation will not deliver the full benefits of observability. To answer questions about how your system is performing efficiently, you need to bring the data together into a single platform that allows you to make connections between data points and understand the complete picture. This is how an observability platform adds value.

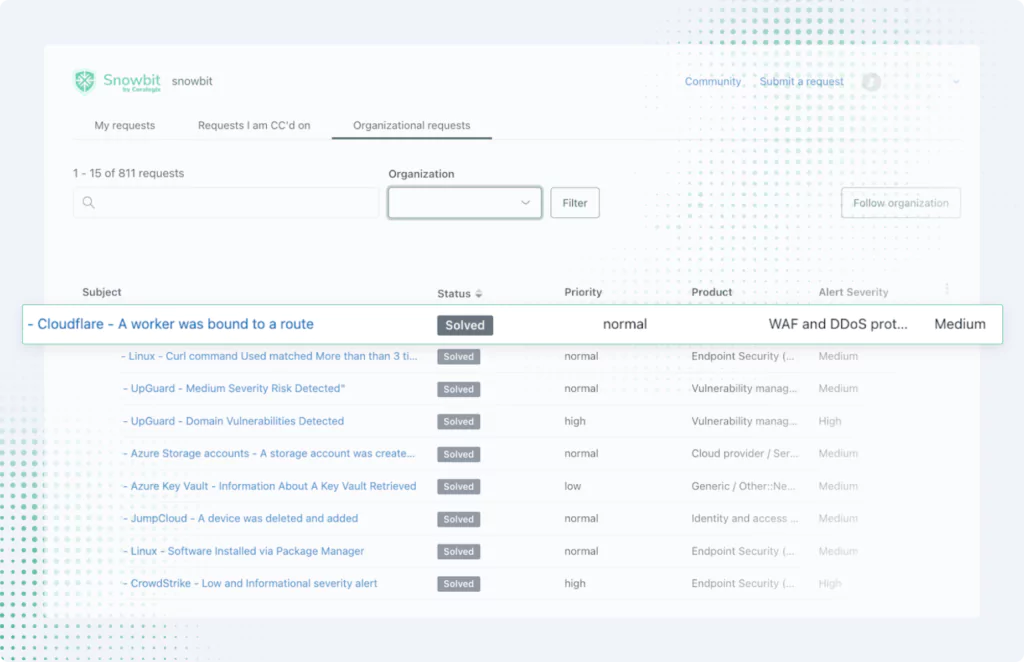
Full-stack observability platforms provide a single source of truth for the state of your system. Rather than logging in to each component of a distributed system to retrieve logs and traces, view metrics, or examine network packets, all the information you need is available from a single location. This saves time and provides you with better context when investigating an issue so that you can get to the source of the problem more quickly.

Armed with a comprehensive picture of how your system behaves at all layers of the software stack, operations teams, software developers, and security specialists can benefit from these insights. Full-stack observability makes it easier for these teams to detect and troubleshoot production issues and monitor changes’ impact as they deploy.

Better visibility of the system’s behavior also reduces the risk associated with trialing and adopting new technologies and platforms, enabling enterprises to move fast without compromising performance, reliability, or security. Finally, having a shared perspective helps to break down siloes and encourages the cross-team collaboration that’s essential to a DevSecOps approach. 

Cloud Configuration Drift: What Is It and How to Mitigate it

More organizations than ever run on Infrastructure-as-Code cloud environments. While migration brings unparalleled scale and flexibility advantages, there are also unique security and ops issues many don’t foresee.

So what are the major IaC ops and security vulnerabilities? Configuration drift.

Cloud config drift isn’t a niche concern. Both global blue-chips and local SMEs have harnessed Coded Infrastructure. However, many approach their system security and performance monitoring the same way they would for a traditional, hardware-based system.

Knowing how to keep the deployed state of your cloud environment in line with the planned configuration management tools is vital. Without tools and best practices to mitigate drift, the planned infrastructure vs. as-is code inevitably becomes very different. This creates performance issues and security vulnerabilities.

Luckily, IaC integrity doesn’t have to be an uphill struggle. Keep reading if you want to keep config drift at a glacial pace.  

What is config drift?

In simple terms, configuration drift is when the current state of your infrastructure doesn’t match the IaC configuration as determined by the code.

Even the most carefully coded infrastructure changes after a day of real-world use. Every action creates a change to the code. This is manageable at a small scale, but it becomes a constant battle when you have 100+ engineers, as many enterprise-level teams do. Every engineer is making console-based changes, and every change causes drift. While many of these changes are small, they quickly add up at the operational scale of most businesses. The same flexibility that prompted the great enterprise migration to the cloud can also cause vulnerability.

Config changes in your environment will be consistent, both deliberate and accidental, especially in large organizations where multiple teams (of varying levels of expertise) are working on/in the same IaC environment. Over time these changes mount up and lead to drift.

Why does cloud-config drift happen?

Cloud infrastructure allows engineers to do more with fewer human hours and pairs of hands. Environments and assets can be created and deployed daily (in the thousands of scale demands). Many automatically update, bringing new config files and code from external sources. Cloud environments are constantly growing and adapting, with or without human input.

However, this semi-automated state of flux creates a new problem. Think of it as time travel in cinema; a small action in the past makes an entirely different version of the present. With IaC, a slight change in the code can lead to a deployed as-is system that’s radically unmatched by the planned configuration your engineers are working from.

Here’s the problem; small changes in IaC code always happen. Cloud environments are flexible and create business agility because the coded infrastructure is so malleable. Drift is inevitable, or at least it can feel that way if you don’t have a solution that adequately mitigates it.

What makes config drift a performance and security risk

Traditional monitoring approaches don’t work for cloud environments. Monitoring stacks could be mapped to config designs with minimal issues in a monolithic system. It would be difficult for a new machine or database to appear without engineers noticing when they’d require both physical hardware and human presence to install. The same can’t be said for coded infrastructure.

If your system visibility reflects plans and designs, instead of the actual deployed state, the gap between what your engineers see and what’s actually happening widens every hour. Unchecked config drift doesn’t create blind spots; it creates deep invisible chasms.

For performance, this causes problems. Cloud systems aren’t nearly as disrupted by high-activity peaks as physical systems of decades ago, but they’re not entirely immune. The buildup of unoptimized assets and processes leads to noticeable performance issues no matter how airtight your initial config designs.

Security that doesn’t have full system visibility is a risk that shouldn’t need explaining but is exactly what config drift leads to. Config drift doesn’t just open a back door for cybercriminals; it gives them keys to your digital property.

Common key causes of IaC config drift

Configuration drift in IaC can feel unavoidable. However, key areas are known to create drift if best practices and appropriate tooling aren’t in place.

Here are some of the most common sources of config drift in cloud environments. If your goal is to maintain a good security posture and a drift disruption-free IaC system, addressing the following is an excellent place to start.

Automated pipelines need automated discovery

Automation goes hand-in-hand with IaC. While automated pipelines bring the flexibility and scale necessary for a 21st-century business, they’re a vulnerability in a cloud environment if you rely on manual discovery and system mapping.

Once established, a successful automated pipeline will generate and deploy new assets with little-to-no human oversight. Great for productivity, potentially a nightmare if those assets are misconfigured, or there are no free engineering hours to confirm new infrastructure is visible to your monitoring and security stacks.

IaC monitoring stacks need to incorporate AI-driven automated discovery. It reduces the need for manual system mapping. Manual discovery is tedious on a small scale. It becomes a full-time commitment in a large cloud environment that changes daily. 

More importantly, automated discovery ensures new assets are visible from the moment they’re deployed. There’s no vulnerable period wherein a recently deployed asset is active but still undiscovered by your monitoring/security stacks. Automated discovery doesn’t just save time, it delivers better results and a more secure environment.

An automated pipeline is only one poorly written line of code away from being a conveyor belt of misconfigured assets. Automated discovery ensures pipelines aren’t left to drag your deployed systems further and further from the configured state your security and monitoring stacks operate by.

Resource tagging isn’t to make sysadmin’s lives easier

The nature of automated deployment means untagged assets are an ever-present risk. Vigilance should be taken, especially when operating at scale. This is where real-time environment monitoring becomes a security essential.

Every incorrect or absent tag drifts your deployed state further from the planned config. Due to the scale of automated deployment, it’s rarely a single asset too. Over time the volume of these unaccounted-for “ghost” resources in your system multiplies.

This creates both visibility and governance issues. Ghost resources are almost impossible to monitor and pose significant challenges for optimization and policy updates. Unchecked, these clusters of invisible, unoptimized resources create large security blind spots and environment-wide config drift.

A real-time monitoring function that scans for untagged assets is crucial. Platforms like Coralogix alert your engineers to untagged resources as they’re deployed. From here, they can be de-ghosted with AI/ML automated tagging or removed entirely. Either way, they’re no longer left to build up and become a source of drift or security posture slack.

Undocumented changes invite configuration drift, no exception

Change is constant in coded infrastructure. Documenting them all, no matter how small/trivial, is critical.

One undocumented change probably won’t bring your systems to a halt (although this can and has happened). However, a culture of lax adherence to good practice rarely means just one undocumented alteration. Over time all these unregistered manual changes mount up.

Effective system governance is predicated on updates finding assets in a certain state. If the state is different, these updates won’t be correctly applied (if at all). As you can imagine, an environment containing code that doesn’t match what systems expect to find means the deployed state moves further from the predefined configuration with every update.

A simple but effective solution? AI/ML-powered alerting. Engineers can easily find and rectify undocumented changes without issue if your stack includes functionality to bring it to their attention. Best practice and due diligence are key, but they rely on people. For the days when human error rears its head, real-time monitoring and automated alerts stop undocumented manual changes from building up to drift-making levels.

That being said, allow your IaC to become living documentation

While AI/ML-powered alerting should still be part of your stack, a culture shift away from overreliance on documentation also goes a long way toward mitigating IaC drift. With coded infrastructure, you can always ask yourself, “do I need this documented outside the code itself?”

Manually documenting changes was essential in traditional systems. Since IaC cloud infrastructure is codified, you can drive any changes directly through the code. Your IaC assets contain their own history; their code can record every change and alteration made since deployment. What’s more, these records are always accurate and up to date.

Driving changes through the IaC allows you to harness code as a living documentation of your cloud infrastructure, one that’s more accurate and up-to-date than a manual record. Not only does this save time, but it also reduces the drift risk that comes with manual documentation. There’s no chance of human error, meaning a change is documented incorrectly (or not at all). 

Does config drift make IaC cloud environments more hassle than they’re worth?

No, not even remotely. Despite config drift and other IaC concerns (such as secret exposure through code), cloud systems are still vastly superior to the setups they replaced.

IaC is essential to multiple technologies that make digital transformations and cloud adoption possible. Beyond deployment, infrastructures built and managed with code bring increased flexibility, scalability, and lower costs. By 2022 these aren’t just competitive advantages; entire economies are reliant on businesses operating at a scale only possible with them.

Config drift isn’t a reason to turn our back on IaC. It just means that coded infrastructure requires a contextual approach. The vulnerabilities of an IaC environment can’t be fixed with a simple firewall. You need to understand config drift and adapt your cybersecurity and engineering approaches to tackle the problem head-on.

Observability: the essential concept to stopping IaC config drift

What’s the key takeaway? Config drift leads to security vulnerabilities and performance problems because it creates blind spots. If your monitoring stacks can’t keep up with the speed and scale of an IaC cloud environment, they’ll soon be overwhelmed.

IaC environments are guaranteed to become larger and more complex over time. Drift is an inevitable by-product of use. Every action generates new code, and changes code that already exists. Any robust security or monitoring for an IaC setting needs to be able to move and adapt simultaneously. An AI/ML-powered observability and visibility platform, like Coralogix, is a vital component of any meaningful IaC solution, whether for security, performance, or both.

In almost every successful cyberattack, vulnerabilities were exploited outside of engineer visibility. Slowing drift and keeping the gap between your planned config and your deployed systems keep these vulnerabilities to a manageable, mitigated minimum. Prioritizing automated AI-driven observability of your IaC that grows and changes as your systems do is the first step towards keeping them drift-free, secure, and operating smoothly.

Kubernetes Security Best Practices

As the container orchestration platform of choice for many enterprises, Kubernetes (or K8s, as it’s often written) is an obvious target for cybercriminals. In its early days, the sheer complexity of managing your own Kubernetes deployment meant it was easy to miss security flaws and introduce loopholes.

Now that the platform has evolved and been managed, Kubernetes monitoring services are available from all major cloud vendors, and Kubernetes security best practices have been developed and defined. While no security measure will provide absolute protection from attack, applying these techniques consistently and correctly will certainly decrease the likelihood of your containerized deployment being hacked.

Applying defense in depth

The recommended approach to securing a Kubernetes deployment uses a layered strategy, modeled on the defense in depth paradigm (DiD). In the context of information technology, defense in depth is a security pattern that uses multiple layers of redundancy to protect a system from attack.

Rather than relying on a single security perimeter to protect against all attacks, a defense in depth approach acknowledges the risk that defenses may be breached and deploys additional protections at intermediate and lower levels of the architecture. That way, if one line of defense is breached, there are additional obstacles in place to impede an attacker’s progress.

So how does this apply to Kubernetes? Kubernetes is deployed to a computing cluster that is made up of multiple worker nodes together with nodes hosting the control plane components (including the API server and database). 

Each worker node is simply a machine hosting one or more pods, together with the K8s agent (kubelet), network proxy (kube-proxy), and container runtime. Each pod hosts a container that runs some of your application code. Finally, as a cloud-native platform, K8s is typically deployed to cloud-hosted infrastructure, which means you can easily increase the number of nodes in the cluster to meet demands.

You can think of a Kubernetes deployment in terms of these four layers – your code, the containers the code runs in, the cluster used to deploy the containers, and the cloud (or on-premise) infrastructure hosting the cluster – the four Cs of cloud-native security. Applying Kubernetes security best practices at each of these levels helps to create defense in depth.

K8s security best practices

Securing your code

Kubernetes makes it easier to deploy application code using containers and enables you to leverage the benefits of cloud infrastructure for hosting those containers. The code you run in your containers is both an obvious attack vector and the layer over which you have the most control.

When securing your code, building security considerations into your software development process early on – also known as “shifting security to the left” – is more efficient than waiting until the functionality has been developed before checking for security flaws. 

One example of doing this to scanning your code changes regularly (either as you write or as an early step in the CI/CD pipeline) with static code analyzers and software composition analysis tools. These help to catch known exploits in your chosen framework and third-party dependencies, which could otherwise leave your application vulnerable to attack.

When developing new features for a containerized application, you also need to consider how your containers will communicate with each other. This includes ensuring communications between containers are encrypted and limiting exposed ports. Taking a zero-trust approach here helps protect your application and your data; if an attacker finds a way in, at least they won’t immediately gain unfettered access to your entire system.

Container protections

When Kubernetes deploys an instance of a new container, it first has to fetch the container image from a container registry. This can be the Docker public registry, another specified public registry, or a private container registry. Unfortunately, public container registries have become a popular attack vector. 

This is because open-source container images provide a convenient way to evade an organization’s security perimeter and deploy malicious code directly onto a cluster, such as crypto-mining operations and bot farms. Scanning container images for known vulnerabilities and establishing a secure chain of trust for the images you deploy to your cluster is essential.

When building containers, applying the principle of least privilege will help to prevent malicious actors that have managed to gain access to your cluster from accessing sensitive data or modifying the configuration to suit their own ends. 

As a minimum, configure the container to use a user with minimal privileges (rather than root access) and disable privilege escalation. If some root permissions are required, grant those specific capabilities rather than all. With Kubernetes, these settings can be configured for containers or pods using the security context. This makes it easier to apply security settings consistently across all pods and containers in your cluster.

You may also want to consider setting resource limits to restrict the number of pods or services that can be created, and the amount of CPU, memory, and disk space that can be consumed, according to your application’s needs. This reduces the scope for misuse of your infrastructure and mitigates the impact of denial-of-service attacks.

Cluster-level security

A Kubernetes cluster is made up of the control plane and data plane elements. The control plane is responsible for coordinating the cluster, whereas the data plane consists of the worker nodes hosting the pods, K8s agent (kubelet), and other elements required for the containers to run.

On the control plane side, both the Kubernetes API and the key-value store (etcd) require specific attention. All communications – from end-users, cluster elements, and external resources – are routed through the K8s API. Ideally, all calls to the API, from inside and outside the cluster, should be encrypted with TLS, authenticated, and authorized before being allowed through.

When you set up the cluster, you should specify the authentication mechanisms to be used for human users and service worker accounts. Once authenticated, requests should be authorized using the built-in role-based access control (RBAC) component.

Kubernetes requires a key-value store for all cluster data. Access to the data store effectively grants access to the whole cluster, as you can view and (if you have write access) modify the configuration details, pod settings, and running workloads. 

It’s therefore essential to restrict access to the database and secure your database backups. Support for encrypting secret data at rest was promoted from beta in late 2020 and should also be enabled where possible.

Within the data plane, it’s good practice to restrict access to the Kubelet API, which is used to control each worker node and the containers it hosts. By default, anonymous access is permitted, so this must be disabled for production deployments at the very least.

For particularly sensitive workloads, you may also want to consider a sandboxed or virtualized container runtime for increased security. These reduce the attack surface, but at the cost of reduced performance compared to mainstream runtimes such as Docker or CRI-O.

You can learn more about securing your cluster from the Kubernetes documentation.

Cloud or on-premise infrastructure

K8s is cloud-native, but it’s possible to run it on-premises too. When using a managed K8s service, such as Amazon EKS or Microsoft AKS, your cloud provider will handle the physical security of your infrastructure and many aspects of the cybersecurity too.

If you’re running your own Kubernetes deployment, either in the cloud or hosted on-premise, you need to ensure you’re applying infrastructure security best practices. For cloud-hosted deployments, follow your cloud provider’s guidance on security and implement user account protocols to avoid unused accounts remaining active, restrict permissions, and require multi-factor authentication. 

For on-premise infrastructure, you’ll also need to keep servers patched and up-to-date, maintain a firewall and implement other network security, potentially use IP allow lists, or block lists to limit access, and ensure physical security.

Wrapping up

As a container orchestration platform, Kubernetes is both powerful and flexible. While this allows organizations to customize it to their needs, it also places the burden of security on IT admins and SecOps staff. A good understanding of Kubernetes security best practices, including how security can be built in at every level of a K8s deployment, and the specific needs of your organization and the application, are essential.

Cybersecurity is not a fire-and-forget exercise. Once you have architected and deployed your cluster with security in mind, the next phase is to ensure your defenses are working as expected. Building observability into your Kubernetes deployment will help you to develop and maintain a good understanding of how your system is operating and monitor running workloads.

New CERT-In Guidelines: What Does That Mean For You

An organization’s security protocols are vital to maintaining transparency, compliance with government regulations, and trust with customers. On April 28, 2022, the Indian Computer Emergency Response Team (CERT-In) released updated directions for compliance requirements for all India-based companies and organizations with Indian clients.

It’s critical to keep in mind that these rules are in place to keep organizations and customers safe from cybersecurity attacks and to see that the correct steps are being taken in a timely manner. 

So what does this mean for you? 

This means you’ll have to retain your log data for 180 days, among a few additional updates, to meet all the Indian Compliance regulation requirements. 

And although this might seem overwhelming and financially burdensome, we’ve got you fully covered on all bases.

Infinite Retention with Coralogix

With growing log volumes and increasingly strict retention regulations, the cost of storing and analyzing them with traditional approaches can be a significant challenge and financial burden. Coralogix uses proprietary Streama© technology to analyze observability data in-stream without relying on indexing or a centralized data store.

This means companies can centralize their observability data and ensure they remain compliant with all local and global security requirements without breaking the bank. 

Directly Query Your Archive

As data enters Coralogix, it is parsed and enriched and then stored in an Amazon S3 archive bucket that you control. This means no matter what level of analysis and monitoring you need, you always maintain full access to your data – for as long as you need it. Configure your bucket to reside in AWS’s Mumbai region with 180-retention for compliance with the updated CERT-In directive.

Query your archive directly from the Coralogix UI or via CLI with no additional compute cost or impact on your daily quota. Data can then be easily exported for an audit or reindexed to the Coralogix platform for investigation.

Extract Insights Without Indexing

Part of what sets the Coralogix platform apart is the ability to extract infinite value from your data without ever needing to index it.

Use the Logs2Metrics feature to generate metrics on the fly from your logs and send the raw log data directly to your archive. The metrics are stored for a full year for visualization and alerting at no additional cost, and the raw data can be accessed directly from your archive at any time. Advanced alerting with dynamic thresholds, log clustering, and anomaly detection can all also be leveraged without indexing.

This means that you can monitor your data with more precision, better performance, and at a much lower cost.

Optimize Your Total Cost of Ownership (TCO)

As data volumes continue to grow, costs typically increase as well. We understand different data is used for different goals. That’s why with our technology, you can designate the data to different analytics pipelines by use case, allowing you to reduce costs while maintaining system visibility.

Use our TCO Optimizer to prioritize your data to 1 of 3 data pipelines according to your analytics and monitoring needs so that you pay based on the value of your data rather than volume.  

Compliance Pipeline: Within this pipeline, you can store data that’s needed for compliance purposes. Data in this pipeline is written to your own archive bucket after passing through the parser, enrichment, and Live Tail. It can still be queried at any time, without counting against the quota, ensuring you meet all the CERT-In guidelines. 

Monitoring Pipeline: Any data that needs to be visualized, tracked, alerted, and monitored in real-time will flow in the log monitoring pipeline. Within the pipeline, you can leverage the Logs2Metrics, Alerting, and Anomaly Detection features without ever needing to index the raw log data.

With these features, you’ll be able to quickly and easily identify security risks before they affect your business or customers. Remember that according to the new directions, you will need to report them to CERT-In within 6 hours. 

Frequent Search Pipeline: Any data queried frequently for investigations or troubleshooting, critical or error level logs, for example, can be sent to the Frequent Search pipeline. In addition to the advanced features in the Monitoring pipeline, this data will be indexed and put in hot storage to enable lightning-fast queries.

Between all three pipelines, you have full control over where to place your data, access to all Coralogix features for all users, and have fully optimized costs with no surprises.

Regardless of which pipeline your data is sent to, all of it will be stored in your archive bucket, so you ALWAYS have full access and control in compliance with government regulations. 

Where Do Things Currently Stand

All in all, no matter which pipelines your data is in, ALL DATA is accessible from the archive regardless of indexing and retention. Rest assured, you can easily retain all your logs for 180 days (or however long you want), maintain full oversight of your system’s health, work with a cost-effective solution, and meet full compliance requirements. 

Learn more about the Coralogix platform or request a demo at any time for a personalized walkthrough! 

On-premise vs. On the Cloud

Since its emergence in the mid-2000s, the cloud computing market has evolved significantly. The benefits of reliability, scalability, and cost reduction using cloud computing have created a demand to fuel an ever-growing range of “as-a-service” offerings, resulting in an option to suit most requirements. But despite the advantages, the question of cloud or on-premise remains valid.

As an organization, you can choose whether it’s best to host and manage your computing infrastructure, data, and services in-house or engage a third party to supply, host, and maintain the hardware and – optionally – provide additional services on top.

While some enterprises have opted for a wholesale migration to the cloud, others have taken a piecemeal approach – maintaining their infrastructure for some systems and using cloud-hosted software and services where it makes sense for them. 

What is clear is that there is no one-size-fits-all approach – what’s right for your business will depend on a range of factors, which we’ll come to shortly. But first, let’s clarify what we mean by on-premise and on the cloud.

What is on-premise?

On-premise refers to computing infrastructure – servers and other hardware – physically located in your company’s offices (or another location to which you have access). You run operating systems and software that you have licensed or developed in-house.

Depending on your organization’s purpose, you may run several different systems on those machines – from end-user software and databases to email servers and firewalls – and make them available to those within your company via a private network.  Because the physical hardware and everything running on it is managed in-house, you have control over (and responsibility for) how it is secured, accessed, and maintained.

What is the cloud? Understanding computing-as-a-service

Cloud computing refers to computer hardware owned and managed by a third-party provider and the services running on that hardware. 

When you opt to use cloud computing, you have little visibility over where the hardware you’re using is located (although, for legal reasons, you will probably know the country or region) – your interaction is with the virtual machines, containers, functions, or software running on those resources.

Cloud computing breaks down into multiple layers of services, allowing you to choose the degree of control you want:

  • Infrastructure-as-a-service (IaaS) – at the lowest or most basic level, we have infrastructure hosted and maintained by a third party. As a customer, you have access to one or more virtual machines (VMs) and can decide how to provision them and what to run on them. At the same time, the cloud service provider supplies the physical hardware and takes care of networking, storage, and processing power. Examples include Amazon EC2, Google Cloud Engine, and Azure Virtual Machine instances.
  • Container-as-a-service (CaaS) – if you’re deploying containerized applications or services and do not need control of the virtual machines hosting those containers, then CaaS may be the ideal level of abstraction. As with IaaS, the cloud service provider supplies, provisions, and maintains the hardware and provides the VMs to host the containers. Examples include Amazon ECS and AWS Fargate, Google Cloud Run, and Azure Container Instances.
  • Platform-as-a-service (PaaS) – with PaaS, you’re provided with a computing environment, complete with the operating system and some relevant software, which you can use to develop and deliver applications. Examples include AWS Elastic Beanstalk, Google App Engine, and Azure App Service.
  • Function-as-a-service (FaaS) – for enterprises that require computing resources to execute programs and scripts in response to events but do not require control of the environment or platform, FaaS offers a highly flexible solution that scales automatically.  Examples include AWS Lambda, Google Cloud Functions, and Azure Functions.
  • Software-as-a-service (SaaS) – as the most hands-off cloud service offering, SaaS allows you to use software without installing or updating it. Examples include Google Workspace and Office 365.

Typically cloud computing refers to a public cloud, where multiple customers may share the same underlying hardware. An alternative is to use a private cloud, where resources are restricted to a single customer or “tenant.” 

Private clouds allow scope for greater customization and increased security, but at a higher cost. Overall, there is a cost reduction using cloud computing but it is dependent on good internet connectivity.

Cloud vs. On-Premise: Key Differences

When choosing between on-premise and cloud computing, there are several factors to consider. Here we’ll look at the main ones.

Deployment and maintenance

On-premise: When your computing infrastructure is hosted on-site, you need a dedicated IT team to manage the procurement, installation, networking, upgrades, and maintenance of servers and other hardware, as well as the operating systems and applications running on those machines.

Cloud: With the cloud, purchase, security, and maintenance of physical hardware is handled by the cloud provider. The management level for the software side will depend on the service you choose. With IaaS, you retain a high degree of control and flexibility, but you need to manage everything from the operating system upwards. With FaaS and SaaS, you have far less control over the environment, but you only need to manage your application or functions.

Scalability

On-premise: Managing your computing infrastructure in-house means planning ahead to ensure you have the capacity as your organization grows. The balance can be challenging to find. Failure to provide sufficient resources and infrastructure will become a limiting factor when demand for a service increases; overestimate your future needs and waste time and money.

Cloud: A key benefit of cloud computing is the ease and speed of bringing more instances online to meet demand, thanks to the vast resources available. While there is always some degree of ramp-up time, it’s measured in seconds rather than hours and days.

Reliability

On-premise: Closely related to the question of scalability is redundancy. Can you fail over other instances in the event of a hardware or system failure, and how quickly can you bring additional resources online to return to normal operations? For on-premise infrastructure, you need to assess the risk regularly and provision resources accordingly, trading off the actual cost versus the potential harm from unscheduled downtime.

Cloud: With cloud hosting, the scale of the resources available means that redundancy is built-in. For high-level services such as FaaS and SaaS, the cloud service provider takes responsibility for uptime, so failover modes are not something you need to worry about. For lower-level services, you typically specify how you want infrastructure to behave in the event of failure as part of the configuration, with the price tag varying accordingly.

Cost

On-premise: Buying and maintaining computer infrastructure involves capital outlay and operational expenditure (including running costs and staff expertise). That includes the cost of additional hardware required to allow capacity for future expansion or failover, even when that infrastructure is not in use.

Cloud: Moving to the cloud shifts costs from capital (CAPEX) to operational expenditure (OPEX) and means that you only pay for what you use. Cloud costs can vary considerably depending on whether you’re using public cloud resources or require the security of a dedicated private cloud, the speed of scale-up, and the amount of CPU, memory, and storage you need. As it’s easy for consumption and storage to escalate quickly, it’s important to monitor usage and optimize your use of cloud services to keep costs under control.

Security

On-premise: Security is one of the enterprises’ main drivers for keeping IT infrastructure onsite. Organizations handling critical systems or very sensitive data require enhanced levels of security. In these cases, the need to retain physical control of crucial infrastructure means cloud computing is often not a viable option.

Cloud: Although security concerns are often raised as a reason not to move to the cloud, in some cases, it can improve an organization’s security posture. Cloud service providers benefit from economies of scale, which applies to their security expertise and defenses (both physical and online). For some businesses, the cloud may offer more security than in-house infrastructure. When moving to the cloud, the key is to remain alert to potential security risks, invest in security training for your staff, and apply security best practices.

Compliance

On-premise: For organizations working in heavily regulated industries such as finance or healthcare, rules regarding the location in which data is stored and the controls in place to prevent misuse can prove a blocker to moving to the cloud.

Cloud: While cloud solutions exist that allow enterprises to comply with regulatory regimes – including storing data in particular jurisdictions and recognizing ownership of that data – the onus is on the organization procuring the service to perform their due diligence and implement adequate measures to ensure compliance. 

Why is Application Performance Monitoring Important?

AI-powered platforms like Coralogix also have built-in technology that determines your enterprise monitoring system‘s “baseline” and reports anomalies that are difficult to identify in real-time. When combined with comprehensive vulnerability scans, these platforms provide you with a robust security system for your company.

Picture this: Your on-call engineer gets an alert at 2 AM about a system outage, which requires the entire team to work hours into the night. 

Even worse, your engineering team has no context of where the issue lies because your systems are too distributed. Solving the problem requires them to have data from resources that live in another timezone and aren’t responsive. 

All the while, your customers cannot access or interact with your application, which, as you can imagine, is damaging.

This hypothetical situation happens way too often in software companies. And that’s precisely the problem that application performance log monitoring solves. It enables your team to quickly get to the root cause of any issues, remediate them quickly, and maintain a high level of service for the end-users. So, let’s first understand how application performance monitoring works.

What is Application Performance Monitoring?

Application performance monitoring refers to collecting data and metrics on your application and the underlying infrastructure to determine overall system health. Typically, APM tools collect metrics such as transaction times, resource consumption, transaction volumes, error rates, and system responses. This data is derived from various sources such as log files, real-time application monitoring, and predictive analysis based on logs.

As a continuous, intelligent process, APM uses this data to detect anomalies in real-time. Then, it sends alerts to the response teams, who can then fix the issue before it becomes a serious outage. 

APM has become a crucial part of many organizations, especially those with customer-facing applications. Let’s dive into how implementing an APM might benefit your organization.

Why is application performance monitoring important?

System Observability

Observability is a critical concept in software development as it helps cross-functional teams analyze and understand complex systems and the state of each component in that system. In addition, it allows engineers to actively monitor how the application behaves in production and find any shortcomings.

Application performance monitoring is a core element of observability. Using an APM like Coralogix, you contextualize data and seamlessly correlate them with system metrics. Thus, the exact systems acting up can be isolated by software. This translates to a lower mean time to detect and resolve incidents and defects.

Furthermore, Coralogix’s centralized dashboard and live real-time reporting help you achieve end-to-end coverage for your applications and develop a proactive approach to managing incidents. Cross-functional teams can effectively collaborate to evolve the application through seamless visualization of log data and enterprise-grade security practices for compliance.

Being cross-functional is especially important as your organization grows, which brings us to the next point.

Scaling Your Business

Scaling your organization brings its set of growing pains. Systems become more complicated, architectures become distributed, and at one point, you can hardly keep track of your data sources. Along with that, there is an increased pressure to keep up release velocity and maintain quality. In cases such as these, it’s easy to miss tracking points of failures manually or even with in-house tracking software. Homegrown solutions don’t always scale well and have rigid limitations.

With Coralogix, you can reduce the overhead of maintaining different systems and visualize data through a single dashboard. In addition, advanced filtering systems and ML-powered analytics systems cut down the noise that inevitably comes with scaling, allowing you to focus on the issue at hand.

Business Continuity

You’re not alone if you’ve ever been woken up in the middle of the night because your application server is down. Time is crucial when a system fails, and application performance monitoring is critical in such cases. 

24/7 monitoring and predictive analysis often help curb the negative impacts of an outage. In many cases, good APM software can prevent outages as well. With time, intelligent APM software iterates and improves system baselines and can predict anomalies more accurately.  This leads to fewer and shorter outages, complete business continuity, and minimal impact on the end users. Speaking of end users…

Team Productivity

We want to fix defects – said no developer ever. With log data and monitoring, engineering teams can pinpoint the problem that caused the defect and fix it quickly. Your software teams would thus have fewer headaches and late nights. This leads to improved team morale, freeing up their time to innovate or create new features for the application instead. Tracking automation software like RPA and custom scripts is also a great use case for APMs that directly increase productivity.

Customer Experience

End users want applications to be fast, responsive, and reliable across all devices, be it their phone, tablet, laptop, etc. Your website doesn’t even have to be down for them to form a negative impression — they will switch over to a competitor if your website doesn’t load within seconds. 

Systems rarely fail without giving some kind of indication first. With APM, you can track these issues in real-time. For instance, you could set up alerts to trigger when a webpage becomes non-responsive. Higher traffic load or router issues can also be monitored. Combined with detailed monitoring data through application and Cloudflare logs, your team can then jump in before the end user’s experience is disrupted.

Along with user experience, application performance monitoring software also plays a crucial role in cybersecurity. No matter the size of your organization, hackers actively look for security loopholes to breach sensitive data. Here’s how APM helps deal with that.

Reduce Cybersecurity Risk 

Hackers are everywhere. Although a good firewall, VPNs, and other cybersecurity measures help block a lot of unwanted traffic, sophisticated attacks can sometimes still breach that level of security. With cybersecurity hacks sometimes resulting in millions of dollars in losses for a business, APM software can be the solution you need to be cyber secure.

By monitoring your applications constantly and looking at usage patterns, you’ll be able to identify these intrusions as they happen. Threshold levels can trigger alerts when the system detects unusual activity through traces. Thus, this can function as an early warning system, especially during DDoS attacks. APMs can also be used to track authentication applications to ensure they are keeping APIs functional while keeping the hackers at bay.

We’re Making Our Debut In Cybersecurity with Snowbit

2021 was a crazy year, to say the least, not only did we welcome our 2,000th customer, we announced our Series B AND Series C funding rounds, and on top of that, we launched Streamaⓒ – our in-stream data analytics pipeline.

But this year, we’re going to top that!

We’re eager to share that we are venturing into cybersecurity with the launch of Snowbit! This new venture will focus on helping cloud-native companies comprehensively manage the security of their environments.

As you know, observability and security are deeply intertwined and critical to the seamless operation of cloud environments. Post becoming a full-stack observability player with the addition of metrics and tracing, it was natural for us to delve deeper into cybersecurity.

So what are we trying to solve?

Today we are witnessing accelerated cybersecurity risks with the online explosion post the onset of the pandemic. The acute global scarcity of cybersecurity talent has aggravated the situation as most organizations are unlikely to have adequately staffed in-house security teams over the medium term. They are just too expensive, difficult to hire and keep updated.

As Navdeep Mantakala, Co-founder of Snowbit says, “Rapidly accelerating cyberthreats are leaving many organizations exposed and unable to effectively deal with security challenges as they arise. Snowbit aims to address fundamental security-related challenges faced today including growing cloud complexity, increasing sophistication of attacks, lack of in-house cybersecurity expertise, and the overhead of managing multiple point security solutions.”

What is also adding to the challenge is the increasing leverage of the cloud, both multi-provider infrastructure and SaaS, which is dramatically broadening the attack surface and complexity. Leverage of multiple point solutions to address specific use cases are only increasing the operational overhead.

How are we solving it?

Snowbit’s Managed Extended Detection and Response (MxDR) incorporates a SaaS platform and expert services. The platform gives organizations a comprehensive view of their cloud environment’s security and compliance (CIS, NIST, SOC, PCI, ISO, HIPAA). 

The Snowbit team will work to expand on the existing capabilities of the Coralogix platform, so that all data will be used to identify any abnormal activity, configurations, network, and vulnerability issues. This is rooted in the idea that every log can and should be a security log. Furthermore, it will automate threat detection and incident response via machine learning, an extensive set of pre-configured rules, alerts, dashboards, and more. 

The MxDR platform deploys a team of security analysts, researchers, and DFIR professionals stationed at Snowbit’s 24×7 Security Resource Center. There, they provide guided responses to enable organizations to more decisively respond to threats detected in their environment.

“Observability forms the bedrock of cybersecurity, and as a result, Snowbit is strategic for Coralogix as it enables us to offer a powerful integrated observability and security proposition to unlock the value of data correlation,” said Ariel Assaraf, CEO of Coralogix. “Snowbit’s platform and services enable organizations to overcome challenges of cybersecurity talent and disparate tools to more effectively secure their environments.”

With Snowbit, we have the vision to empower organizations across the globe to quickly, efficiently, and cost-effectively secure themselves against omnipresent and growing cyber risks. Snowbit is looking to offer the broadest cloud-native managed detection and response offering available to enable this. 

Make sure to sign up for updates so you can get notified once Snowbit launches.