Top 10 Distributed Tracing Tools For Your Success 

In the intricate web of modern software systems and full-stack observability, knowing how requests flow and interact across distributed components is paramount. Distributed tracing tools can help you.

To better understand how distributed tracing works and benefits, here’s our selection of top distributed tracing tools to choose from.

What is distributed tracing?

Tracing is the process of recording the sequence of activities and events within a software system. It involves capturing data points at each stage of execution to create a detailed log of what’s happening.

The detailed log is called a trace and usually contains the interactions, dependencies, and timings of various components as they process your request. For example, imagine you’re buying a product from an online store. Behind the scenes, your request goes through a series of different steps, including checking your info, making sure the item is available, paying, confirming your order, and shipping.

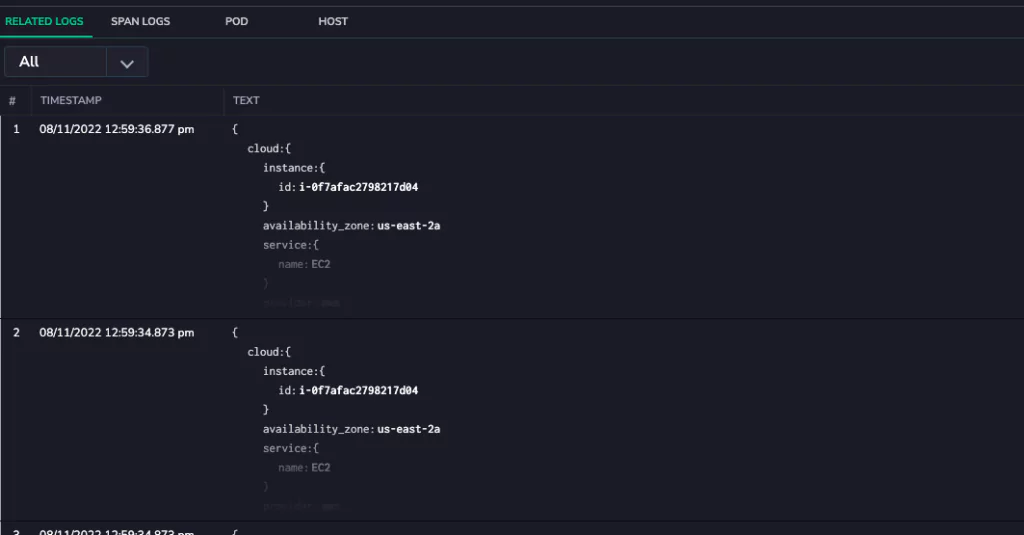
Distributed tracing is simply tracing applied to a distributed system, for instance a microservices application. Each microservice, when processing a request, generates a trace, which contains valuable information such as timestamps, unique identifiers, and metadata about the request and its associated interactions. These traces are then propagated across the system and collected centrally, usually by a tracing tool or platform.

Why is distributed tracing important?

Distributed tracing offers a range of valuable benefits that enhance development, monitoring, troubleshooting, and overall microservices performance. Here are some key advantages:

  • End-to-end visibility: Tracing provides a detailed and visual representation of how requests flow through a system’s various components. This visibility allows developers and operations teams to understand the complete journey of data, from its origin to its destination.
  • Performance optimization: By tracking the timing and interactions of requests within a distributed system, tracing helps identify performance bottlenecks, latency issues, and areas for optimization. This information empowers teams to make informed decisions on how to enhance system efficiency.
  • Issue detection and debugging: When an issue occurs, tracing allows developers to trace back the path of a request, helping identify the root cause of errors, bugs, and unexpected behaviors. Tracing accelerates debugging, reduces mean time to resolution (MTTR), and minimizes downtime.
  • Microservices: In microservices architectures, understanding how services interact is essential. Tracing provides insights into the intricate interactions between microservices, aiding in managing the complexities of distributed systems.
  • Resource allocation: With tracing data, developers can determine resource utilization at different stages of request processing. The information helps in optimizing resource allocation, avoiding contention, and ensuring smooth operation.
  • Capacity planning: Tracing assists in identifying peak load times and potential stress points in the system. The information is critical for effective capacity planning and scaling resources as needed.
  • Change impact assessment: Before making changes to a system, tracing can simulate the effects of those changes on requests. This allows teams to assess potential impacts and make adjustments if necessary.
  • Proactive monitoring: Real-time tracing allows for proactive monitoring of the system’s health. Teams can set alerts for unusual behavior, enabling prompt response to anomalies before they escalate.

Top 10 distributed tracing tools

To help you find the right distributed tracing tools, here are some questions to consider. Are you focused on performance optimization, troubleshooting, or both? Are you dealing with a few microservices or a large, complex architecture? Do you want real-time monitoring and/or historical analysis? What kind of tech stack and budget do you have? 

Once you’ve answered the above, check out these 10 best distributed tracing tools you can choose from.

1. Coralogix

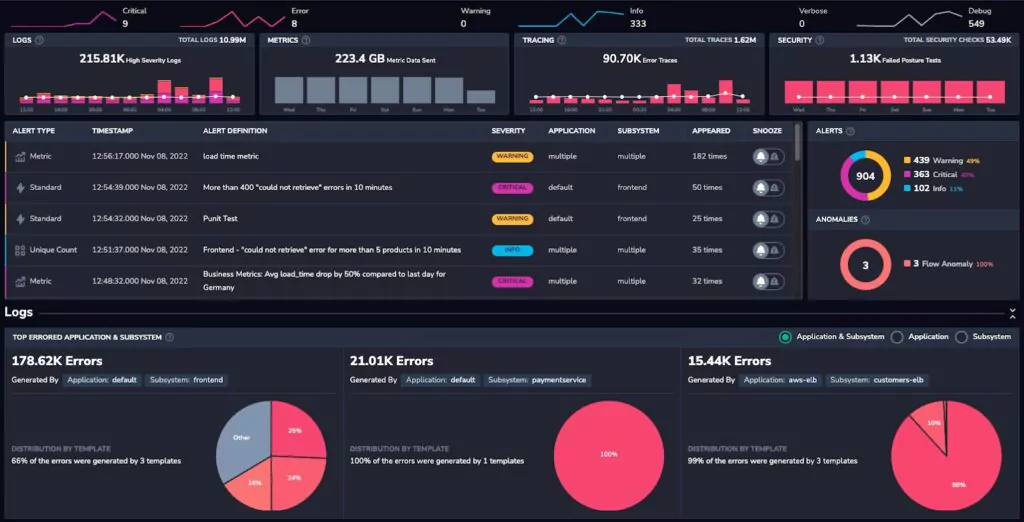
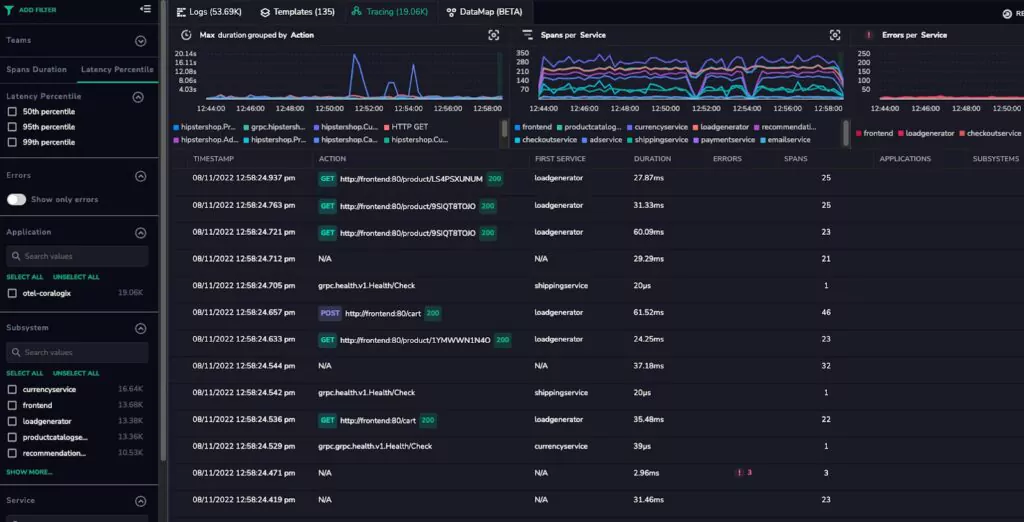
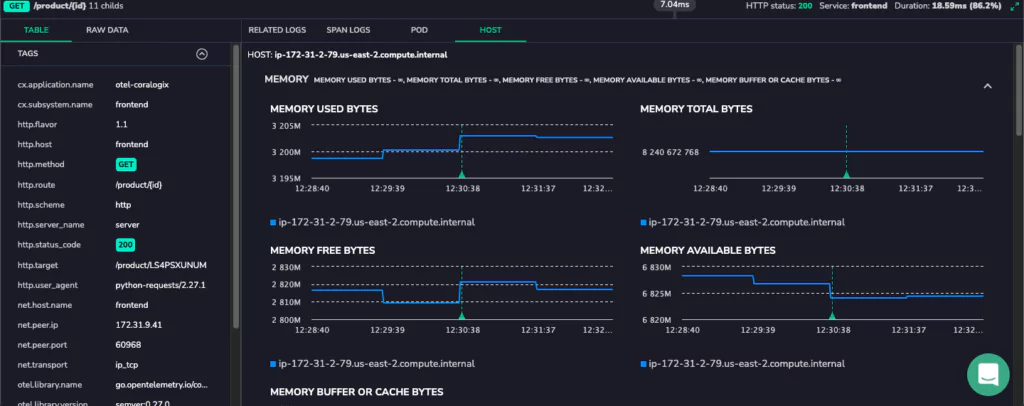
Coralogix is suitable for organizations that require end-to-end visibility into the interactions and performance of their microservices-based applications. The platform lets you optimize system performance, identify bottlenecks, troubleshoot issues, and more.

Coralogix tracing features include high scalability, real-time observability, and intelligent alerting. It’s designed to handle large-scale systems and provides instant insights into system behavior.

2. Jaeger

The platform offers detailed trace visualization, service dependency graphs, and integration with popular observability platforms. However, Jaeger might require more configuration and setup effort compared to hosted solutions and might not be the best fit for organizations seeking a fully managed tracing solution.

3. Zipkin

The platform offers distributed tracing solution and is known for its simplicity. That being said, Zipkin lacks some advanced features found in more robust tracing tools, thus not the best choice for large-scale systems with complex requirements.

4. OpenTelemetry

The platform offers a standardized and vendor-neutral approach to instrumenting and collecting tracing data across various languages and frameworks. It provides an API and instrumentation for different programming languages. However, it might not offer all features found in specialized tracing solutions.

5. Datadog

The platform offers integration between traces, metrics, and logs, but at a cost. Datadog has a steeper pricing curve compared to standalone tracing tools, making it less suitable for smaller budgets or simpler use cases.

6. New Relic

The platform provides end-to-end visibility with APM and distributed tracing integrated. Although it’s not the best choice for organizations focused on distributed tracing without the need for comprehensive APM capabilities.

7. Instana

The platform employs automatic instrumentation and AI-powered root cause analysis. However, Instana’s focus on comprehensive observability might be overkill for organizations seeking a lightweight or simpler tracing solution.

8. LightStep

The platform is to designed to handle high-cardinality data with precision, and more. That being said, the tool is a steeper learning curve due to certain features for applications that require basic tracing functionality.

9. Honeycomb

The platform handles high-cardinality data, providing interactive trace visualizations. At the same time, organizations looking for a more traditional, metrics-focused observability approach, could find it less suitable for their needs.

10. Dynatrace

The platform offers automatic discovery and instrumentation of services. But it could create a challenge for simpler applications that primarily need standalone distributed tracing capabilities, without the comprehensive features of an observability platform.

Observability and Its Influence on Scrum Metrics

Scrum metrics and data observability are an essential indicator of your team’s progress. In an agile team, they help you understand the pace and progress of every sprint, ascertain whether you’re on track for timely delivery or not, and more. 

Although scrum metrics are essential, they are only one facet of the delivery process — sure, they ensure you’re on track, but how do you ensure that there are no roadblocks during development? 

That’s precisely where observability helps. Observability gives you a granular overview of your application. It monitors and records performance logs continuously, helping you isolate and fix issues before scrum metrics are affected. Using observability makes your scrum team more efficient — let’s see how.

Scrum Metrics: The Current Issues & How Observability Helps

Problem #1: 

Imagine a scenario where you’ve just pushed new code into production and see an error. If it’s a single application, you only have to see the logs to pinpoint exactly where the issue lies. However, when you add distributed systems and cloud services to the mix, the cause of the defect can range from a possible server outage to cloud services being down.

Cue the brain-racking deep dives into logs and traces on multiple servers, with everyone from the developers to DevOps engineers doing their testing and mock runs to figure out the what and where. 

This is an absolute waste of time because looking at these individually is like hoping to hit the jackpot – you’re lucky if one of you finds it early on, or you might end up clueless for days on end. And not to mention, scrum metrics would be severely impacted the longer this goes on, causing more pressure from clients and product managers.

How observability fixes it:

With observability, you do not need to comb through individual logs and traces — you can track your applications and view real-time data in a centralized dashboard. 

Finding where the problem lies becomes as simple as understanding which request is breaking through a system trace. Since observability tools are configured to your entire system, that just means clicking a few buttons to start the process. Further, application observability metrics can help you understand your system uptime, response time, the number of requests per second, and how much processing power or memory an application uses — thereby helping you find the problem quickly.

Thus, you mitigate downtime risks and can even solve issues proactively through triggered alerts. 

Problem #2: Hierarchy & Information Sharing

Working in teams is more than distributing tasks and ensuring their timely completion. Information sharing and prompt communication across the ladder are critical to reducing the mean response time to threats. However, if your team prefers individual-level monitoring and problem-solving, they may not readily share or access information as and when required. 

This could create a siloed workplace environment where multiple analytics and monitoring tools are used across the board. This purpose-driven approach inhibits any availability of unified metric data and limits information sharing. 

How observability fixes it:

Observability introduces centralized dashboards that enable teams to work on issues collaboratively. You can access pre-formatted, pre-grouped, and segregated logs and traces that indicate defects. A centralized view of these logs simplifies data sharing and coordination within the team, fostering problem-solving through quick communication and teamwork.

Log management tools such as Coralogix’s full-stack observability platform can generate intelligent reports that help you improve scrum metrics and non-scrum KPIs. Standardizing log formats and traces helps ease the defect and threat-finding process. And your teams can directly access metrics that showcase application health across the organization without compromising on the security of your data.

Let’s look at standard scrum metrics and how observability helps them.

Scrum Metrics & How Observability Improves Them

Sprint Burndown

Sprint burndown is one of the most common scrum metrics. It gives information about the tasks completed and tasks remaining. This helps identify whether the team is on track for each sprint. 

As the sprints go on and the scheduled production dates draw close, the code gets more complicated and harder to maintain. More importantly, it becomes harder to discern for those not involved in developing bits. 

Observability enables fixing the issues early on. With observability, you get a centralized, real-time logging and tracing system that can predictively analyze and group errors, defects, or vulnerabilities. Metrics allow you to monitor your applications in real time and get a holistic view of system performance.

Thus, the effect on your sprint burndown graph is minimal, with significant defects caught beforehand. Observability generates a more balanced sprint burndown graph that shows the exact work done, including fixing defects. 

Team Satisfaction

Observability enables easy collaboration, and information sharing, and gives an overview of how the system performs in real time. A comprehensive centralized observability platform allows developers to analyze logs quickly, fix defects easily, and save the headache of monitoring applications themselves through metrics. And then, they can focus on the job they signed up for — development.

Software Quality

Not all metrics in scrum are easy to measure, and software quality is one of the hardest. The definition is subjective; the closest measurable metric is the escaped defects metric. That’s perhaps why not everyone considers this, but at the end of the day, a software engineering team’s goal is to build high-quality software. 

The quicker you find and squash code bugs and vulnerability threats, the easier it gets to improve overall code quality. You’ll have more time to enhance rather than fix and focus more on writing “good code” instead of “code that works.” 

Escaped Defects

Have you ever deployed code that works flawlessly in pre-production but breaks immediately in production? Don’t worry — we’ve all been there! 

That’s precisely why the escaped defects metric is a core scrum metric. It gives you a good overview of your software’s performance in production.

Implementing observability can directly improve this metric. A good log management and analytics platform like Coralogix can help you identify most bugs proactively through real-time reporting and alerting systems. This reduces the number of defects you may have missed, thus reducing the escaped defects metric.

You benefit from improved system performance and a reduced overall cost and technical debt.

Defect Density

Defect density goes hand-in-hand with escaped defects, especially for larger projects. It measures the number of defects relative to the size of the project.

You could measure this for a class, a package, a set of classes or packages of that deployment, etc. Observability improves the overall performance here. Since you can monitor and generate centralized logs, you can now analyze the defect density and dive deeper into the “why.” Also, using application metrics, you can figure out individual application performance and how efficiently your system works when they are integrated together.

Typically, this metric is used to study irregular defects and answer questions like “are some parts of the code particularly defective?” or “Are some areas out of analysis coverage?” etc. But with observability, you can answer questions like “what’s causing so many defects in these areas?” as defect density and observability complement each other.

Use Observability To Enhance Scrum Metrics

Monitoring scrum KPIs can help developers make better-informed decisions. But these metrics can be hard to track when it comes to developing and deploying modern, distributed systems and microservices. Often, scrum metrics are impacted due to preventable bugs and coordination issues across teams.

Introducing full observability to your stack can revamp the complete development process, significantly improving many crucial scrum metrics. You get a clear understanding of your application health at all times and reduce costs while boosting team morale. If you’re ready to harness the power of observability, contact Coralogix today!

One Click Visibility: Coralogix expands APM Capabilities to Kubernetes

There is a common painful workflow with many observability solutions. Each data type is separated into its own user interface, creating a disjointed workflow that increases cognitive load and slows down Mean Time to Diagnose (MTTD).

At Coralogix, we aim to give our customers the maximum possible insights for the minimum possible effort. We’ve expanded our APM features (see documentation) to provide deep, contextual insights into applications – but we’ve done something different.

Why is APM so important?

Application Performance Monitoring (APM) is one of the most sophisticated capabilities in the observability industry. It allows engineers and operators to inspect detailed application and infrastructure performance metrics. This can include everything from correlated host and application metrics to the time taken for a specific subsystem call. 

APM has become essential due to two major factors:

  • Engineers are reusing more and more code. Open-source libraries provide vast portions of our applications. Engineers don’t always have visibility of most of our application(s).
  • As the application stack grows more extensive, with more and more components performing increasingly sophisticated calculations, the internal behavior of our applications contains more and more useful information.

What is missing in other providers?

Typically, most providers fall victim to the data silo. A siloed mentality encourages engineers to separate their interface and features from the data, not the user journey. This means that in most observability providers, APM data is held in its own place, hidden away from logs, metrics, traces, and security data.

This makes sense from a data perspective. They are entirely different datasets typically used, with varying data demands. This is the basis for the argument to separate this data. We saw this across our competitors and realized that this was slowing down engineers, prolonging outages, and making it more difficult for users to convert their data into actionable insights.

How is Coralogix approaching APM differently?

Coralogix is a full-stack observability platform, and the features across our application exemplify this. For example, our home dashboard covers logs, metrics, traces, and security data:

The expansion of our APM capability (see documentation) is no different. Rather than segregating our data, we want our customers to journey through the stack naturally rather than leaping between different data types to try and piece together the whole picture. With this in mind, It all begins with traces.

Enter the tracing UI and view traces. The filter UI allows users to slice data in several ways, for example, filtering by the 95th Percentile of latency.

Select a span within a trace. This opens up a wealth of incredibly detailed metrics related to the source application. Users can view the logs that were written during the course of this span. This workflow is typically achieved by noting the time of a span and querying them in the logging UI. At Coralogix, this is simply one click.

Track Application Pod Metrics

However, the UI now has the Pod and Host metric for a more detailed insight into application health at the time that the span was generated. These metrics will provide detailed insights into the health of the application pod itself within the Kubernetes cluster. It shows metrics from a few minutes before and after the span so that users can clearly see the sequence of events leading to their span. This level of detail allows users to diagnose even the most complex application issues immediately.

Track Infrastructure Host Metrics

In addition to tracking the application’s behavior, users can also take a wider view of the host machine. Now, it’s possible to detect when the root cause isn’t driven by the application but by a “noisy neighbor.” All this information is available, alongside the tracing information, with only one click between these detailed insights.

Tackle Novel Problems Instantly

If a span took longer than expected, inspect the memory and CPU to understand if the application was experiencing a high load. If an application throws an error, inspect the logs and metrics automatically attached to the trace to better understand why. This connection, between application level data and infrastructure data, is the essence of cutting-edge APM. 

Combined with a user-focused journey, with Coralogix, a 30-minute investigation becomes a 30-second discovery. 

What’s Missing From Almost Every Alerting Solution in 2022?

Alerting has been a fundamental part of operations strategy for the past decade. An entire industry is built around delivering valuable, actionable alerts to engineers and customers as quickly as possible. We will explore what’s missing from your alerts and how Coralogix Flow Alerts solve a fundamental problem in the observability industry. 

What does everyone want from their alerts?

When engineers build their alerts, they focus on making them as useful as possible, but how do we define useful? While this is a complicated question, we can break the utility of an alert into a few easy points:

  • Actionable: The information that the alert gives you is usable, and tells you everything you need to know to respond to the situation, with minimal work on your part to piece together what is going on.
  • Accurate: Your alerts trigger in the correct situation, and they contain correct information.
  • Timely: Your alerts tell you, as soon as possible, the information you need, when you need it.

For many engineers, achieving these three qualities is a never-ending battle. Engineers are constantly chasing after the smallest, valuable set of alerts we can possibly have to minimize noise and maximize uptime. 

However, one key feature is missing from almost every alerting provider, and it goes right to the heart of observability in 2022.

The biggest blocker to the next stage of alerting

If we host our own solution, perhaps with an ELK stack and Prometheus, as is so common in the industry, we are left with some natural alerting options. Alertmanager integrates nicely with Prometheus, and Kibana comes with its own alerting functionality, so you have everything you need, right? Not quite.

Your observability data has been siloed into two specific datastores: Elasticsearch and Prometheus. As soon as you do this, you introduce an architectural complication.

How would you write an alert around your logs AND your metrics?

Despite how simple this sounds, this is something that is not supported by the vast majority of SaaS observability providers or open-source tooling. Metrics, logs, and traces are treated as separate pillars, filtering down into our alerting strategies.

It isn’t clear how this came about, but you only need to look at the troubleshooting practices of any engineer to work out that it’s suboptimal. As soon as a metric alert fires, the engineer looks at the logs to verify. As soon as a log alert fires, the engineer looks at the metrics to better understand. It’s clear that all of this data is used for the same purpose, but we silo it off into separate storage solutions and, in doing so, make our life more difficult.

So what can we do?

The answer is twofold. Firstly, we need to bring all of our observability data into a single place, to build a single pane of glass for our system. Aside from alerting, this makes monitoring and general querying more straightforward. It removes the complex learning curve associated with many open-source tools, which speeds up the time it takes for engineers to become familiar with their chosen approach to observability. However, getting data into one place isn’t enough. Your chosen platform needs to support holistic alerting. And there is only one provider on the market – Coralogix.

Flow alerts cross the barrier between logs, metrics, and traces

There are many SaaS observability providers out there that will consume your logs, metrics, and traces, but none of them can tie all of this data together into a single, cohesive alert that completely describes an outage, making use of your logs, metrics, and traces in the same alert. 

Flow alerts enable you to view your entire system globally without being constrained to a single data type. This brings some key benefits that directly address the great limitations in alerting:

  • Accurate: With flow alerts, you can track activity across all of your observability data, enabling you to outline precisely the conditions for an incident. This reduces noise because your alerts aren’t too sensitive or based on only part of the data. They’re perfectly calibrated to the behavior of your system.
  • Actionable: Flow alerts tell you everything that has happened, leading up to an incident, not just the incident itself. This gives you all of the information you need, in one place, to remedy an outage, without hunting for associated data in your logs or metrics. 
  • Timely: Flow alerts are processed within our Streama technology, meaning your alerts are processed and actioned in-stream, rather than waiting for expensive I/O and database operations to complete. 

Full-Stack Observability Guide

Like cloud-native and DevOps, full-stack observability is one of those software development terms that can sound like an empty buzzword. Look past the jargon, and you’ll find considerable value to be unlocked from building data observability into each layer of your software stack.

Before we get into the details of monitoring observability, let’s take a moment to discuss the context. Over the last two decades, software development and architecture trends have departed from single-stack, monolithic designs toward distributed, containerized deployments that can leverage the benefits of cloud-hosted, serverless infrastructure. 

This provides a range of benefits, but it also creates a more complex landscape to maintain and manage: software breaks down into smaller, independent services that deploy to a mix of virtual machines and containers hosted both on-site and in the cloud, with additional layers of software required to manage automatic scaling and updates to each service, as well as connectivity between services.

At the same time, the industry has seen a shift from the traditional linear build-test-deploy model to a more iterative methodology that blurs the boundaries between software development and operations. This DevOps approach has two main elements. 

First, developers have more visibility and responsibility for their code’s performance once released. Second, operations teams are getting involved in the earlier stages of development — defining infrastructure with code, building in shorter feedback loops, and working with developers to instrument code so that it can output signals about how it’s behaving once released. 

With richer insights into a system’s performance, developers can investigate issues more efficiently, make better coding decisions, and deploy changes faster.

Observability closely ties into the DevOps philosophy: it plays a central role in providing the insights that inform developers’ decisions. It depends on addressing matters traditionally owned by ops teams earlier in the development process.

What is full-stack observability?

Unlike monitoring, observability is not what you do. Instead, it’s a quality or property of a software system. A system is observable if you can ask questions about the data it emits to gain insight into how it behaves. Whereas monitoring focuses on a pre-determined set of questions — such as how many orders are completed or how many login attempts failed — with an observable system, you don’t need to define the question.

Instead, observability means that enough data is collected upfront allowing you to investigate failures and gain insights into how your software behaves in production, rather than adding extra instrumentation to your code and reproducing the issue. 

Once you have built an observable system, you can use the data emitted to monitor the current state and investigate unusual behaviors when they occur. Because the data was already collected, it’s possible to look into what was happening in the lead-up to the issue.

Full-stack observability refers to observability implemented at every layer of the technology stack. – From the containerized infrastructure on which your code is running and the communications between the individual services that make up the system, to the backend database, application logic, and web server that exposes the system to your users.

With full-stack observability, IT teams gain insight into the entire functioning of these complex, distributed systems. Because they can search, analyze, and correlate data from across the entire software stack, they can better understand the relationships and dependencies between the various components. This allows them to maintain systems more effectively, identify and investigate issues quickly, and provide valuable feedback on how the software is used.

So how do you build an observable system? The answer is by instrumenting your code to emit signals and collect telemetry centrally so that you can ask questions about how it’s behaving and why it’s running in production. The types of telemetry can be broken down into what is known as the “four pillars of observability”: metrics, logs, traces, and security data. 

Each pillar provides part of the picture, as we’ll discuss in more detail below. Ensuring these types of data are emitted and collating that information into a single observability platform makes it possible to observe how your software behaves and gain insights into its internal workings.

Deriving value from metrics

The first of our four pillars is metrics. These are time series of numbers derived from the system’s behavior. Examples of metrics include the average, minimum, and maximum time taken to respond to requests in the last hour or day, the available memory, or the number of active sessions at a given point in time.

The value of metrics is in indicating your system’s health. You can observe trends and identify any significant changes by plotting metric values over time. For this reason, metrics play a central role in monitoring tools, including those measuring system health (such as disk space, memory, and CPU availability) and those which track application performance (using values such as completed transactions and active users).

While metrics must be derived from raw data, the metrics you want to observe don’t necessarily have to be determined in advance. Part of the art of building an observable system is ensuring that a broad range of data is captured so that you can derive insights from it later; this can include calculating new metrics from the available data.

Gaining specific insights with logs

The next source of telemetry is logs. Logs are time-stamped messages produced by software that record what happened at a given point. Log entries might record a request made to a service, the response served, an error or warning triggered, or an unexpected failure. Logs can be produced from every level of the software stack, including operating systems, container runtimes, service meshes, databases, and application code.

Most software (including IaaS, PaaS, CaaS, SaaS, firewalls, load balancers, reverse proxies, data stores, and streaming platforms) can be configured to emit logs, and any software developed in-house will typically have logging added during development. What causes a log entry to be emitted and the details it includes depend on how the software has been instrumented. This means that the exact format of the log messages and the information they contain will vary across your software stack.

In most cases, log messages are classified using logging levels, which control the amount of information that is output to logs. Enabling a more detailed logging level such as “debug” or “verbose” will generate far more log entries, whereas limiting logging to “warning” or “error” means you’ll only get logs when something goes wrong. If log messages are in a structured format, they can more easily be searched and queried, whereas unstructured logs must be parsed before you can manipulate them programmatically.

Logs’ low-level contextual information makes them helpful in investigating specific issues and failures. For example, you can use logs to determine which requests were produced before a database query ran out of memory or which user accounts accessed a particular file in the last week. 

Taken in aggregate, logs can also be analyzed to extrapolate trends and detect past and real-time anomalies (assuming they are processed quickly enough). However, checking the logs from each service in a distributed system is rarely practical. To leverage the benefits of logs, you need to collate them from various sources to a central location so they can be parsed and analyzed in bulk.

Using traces to add context

While metrics provide a high-level indication of your system’s health and logs provide specific details about what was happening at a given time, traces supply the context. Distributed tracing records the chain of events involved in servicing a particular request. This is especially relevant in microservices, where a request triggered by a user or external API call can result in dozens of child requests to different services to formulate the response.

A trace identifies all the child calls related to the initiating request, the order in which they occurred, and the time spent on each one. This makes it much easier to understand how different types of requests flow through a system, so that you can work out where you need to focus your attention and drill down into more detail. For example, suppose you’re trying to locate the source of performance degradation. In that case, traces will help you identify where the most time is being spent on a request so that you can investigate the relevant service in more detail.

Implementing distributed tracing requires code to be instrumented so that trace identifiers are propagated to each child request (known as spans), and the details of each span are forwarded to a database for retrieval and analysis.

Adding security data to the picture

The final element of the observability puzzle is security data. Whereas the first three pillars represent specific types of telemetry, security data refers to a range of data, including network traffic, firewall logs, audit logs and security-related metrics, and information about potential threats and attacks from security monitoring platforms. As a result, security data is both broader and narrower than the first three pillars.

Security data merits inclusion as a pillar in its own right because of the crucial importance of defending against cybersecurity attacks for today’s enterprises. In the same way that the importance of building security into software has been highlighted by the term DevSecOps, including security as a pillar in its own right serves to highlight the role that observability plays in improving software security and the value to be had from bringing all available data into a single platform.

As with metrics, logs, and traces, security data comes from multiple sources. One of the side effects of the trend towards more distributed systems is an increase in the potential attack surface. With application logic and data spread across multiple platforms, the network connections between individual containers and servers and across public and private clouds have become another target for cybercriminals. Collating traffic data from various sources makes it possible to analyze that data more effectively to detect potential threats and investigate issues efficiently.

Using an observability platform

While these four types of telemetry provide valuable data, using each in isolation will not deliver the full benefits of observability. To answer questions about how your system is performing efficiently, you need to bring the data together into a single platform that allows you to make connections between data points and understand the complete picture. This is how an observability platform adds value.

Full-stack observability platforms provide a single source of truth for the state of your system. Rather than logging in to each component of a distributed system to retrieve logs and traces, view metrics, or examine network packets, all the information you need is available from a single location. This saves time and provides you with better context when investigating an issue so that you can get to the source of the problem more quickly.

Armed with a comprehensive picture of how your system behaves at all layers of the software stack, operations teams, software developers, and security specialists can benefit from these insights. Full-stack observability makes it easier for these teams to detect and troubleshoot production issues and monitor changes’ impact as they deploy.

Better visibility of the system’s behavior also reduces the risk associated with trialing and adopting new technologies and platforms, enabling enterprises to move fast without compromising performance, reliability, or security. Finally, having a shared perspective helps to break down siloes and encourages the cross-team collaboration that’s essential to a DevSecOps approach. 

June 2022 Platform Updates

Our team has been hard at work this month to introduce 2 new parsing rules, DataMap improvements, updated tracing visualizations for SLA monitoring & more.

Get up to speed on everything that’s new and improved in the Coralogix platform!

New Parsing Rules

Learn More >

This month we are introducing 2 new parsing rules to bring more value to customers who have many fields and nested fields in their log data.

parsing newsletter2

The new Stringify JSON Field and Parse JSON Field rules enable you to parse escaped JSON values within a field to a valid JSON object and vice versa – stringify a JSON object to an escaped string.

Learn More >

DataMap Updates

Learn More >

The DataMap allows you to build custom mappings of your infrastructure using metric data for monitoring system health and quickly identifying issues.

datamap newsletter2

In the Group Editor, you’ll find new options to:

  • Sort the display by attributes (e.g. sort by severity for defined thresholds)
  • Scale threshold values to make metric graphs more readable
  • Limit the number of hexagons shown per group

In the DataMap display, use new ‘Compare to others’ functionality to compare an element with 10 others in the same group. Plus, expand and collapse specific groups to minimize the number of displayed elements.

Learn More >

Tracing Updates

Learn More >

New dynamic graphs and saved views in the Tracing UI enable it to serve as SLA dashboards for any application or service.

tracing newsletter2

In addition to the original default graph for Max duration by Action, there are now two additional default graphs for Count by Service and Error Count by Service.

All three graphs can be customized, and aggregation operators have been added for 99, 95, and 50th percentiles to help deepen your ability to monitor business SLOs.

When investigating traces in the explore section, you can now save your current view and load saved views just like you do in the Logs UI.

Learn More >

*Note that the aggregation operators, as well as the Duration filter in the sidebar, are run over the Spans.

Archive Query Updates

Learn More >

Improvements to the archive query now allow timeframes up to 3 days for added accessibility to data in your remote bucket.

archive query newsletter2

Additional updates to the Archive Query in Explore Screen include:

  • New Execute Archive Query function allows you to review active filters before clicking ‘Run Query’. To prevent unexpected wait times, queries will no longer run automatically when switching from Logs to Archive. 
  • Non-optimal archive queries (e.g. “hello”) will trigger a warning pop up recommending to improve the query conditions.

Learn More >

New Integrations

Amazon Kinesis Data Firehose

Stream large volumes of logs and metrics to Coralogix and reduce operational overhead using our integration with Amazon Kinesis Data Firehose.

Learn More >

Terraform Modules

Easily install and manage Coralogix integrations using Terraform modules in your infrastructure code.

Google Cloud Pub/Sub

Use our predefined function to forward your logs from Google Cloud’s Pub/Sub straight to Coralogix.

Learn More >

GitHub Version Tags

Use the cURL command in GitHub Actions to insert a new tag when a release is published or when a pull request is closed.

Learn More >

Coralogix RabbitMQ Agent

Pull metrics from RabbitMQ Admin UI and send them to your Coralogix account using our AWS Lambda function.

Learn More >

Salesforce Cloud Commerce

Ingest security logs from Salesforce for admin and compliance monitoring.

Learn More >