10 Ways to Take Your Error Logs Up a Level
Error logs are the first port of call for any outage. Great error logs provide context and cause to a mysterious, 3am outage. Engineers often treat…

This tutorial will show you how can Coralogix provide analytics and insights for the Fastly logs you ship to Coralogix, both performance, and security. To get all the Coralogix dashboards and alerts, contact our support on our website/in-app chat. We reply in under 2 minutes!
Content Delivery Networks allow enterprises to distribute web content through data centers around the world without exhausting enterprise resources. Fastly, one of the leading CDNs in the world enables a great real-time logging feature that gives enterprises granular visibility into their apps and services. You can leverage your rich Fastly log data through Coralogix’s User define Alerts and Data Dashboards to instantly discover trends and patterns within any given metric of your application-clients ecosystem, spot potential security threats, and get a real-time notification on any event that you might want to observe. Eventually, getting better monitoring experience and capabilities from your data, with minimum effort.
What data should you send with your Fastly logs? The answer would be, any data you like. You may include in your logs any available Fastly variable, view VCL variables supported by Fastly and Fastly custom log formats documentation for more info. Once you choose your desired log template and set your Coralogix integration with your Fastly account, your apps and services logs will start streaming into Coralogix, data will be indexed and JSON fields will be mapped. Now, you are ready to create alerts and data dashboards.
Note
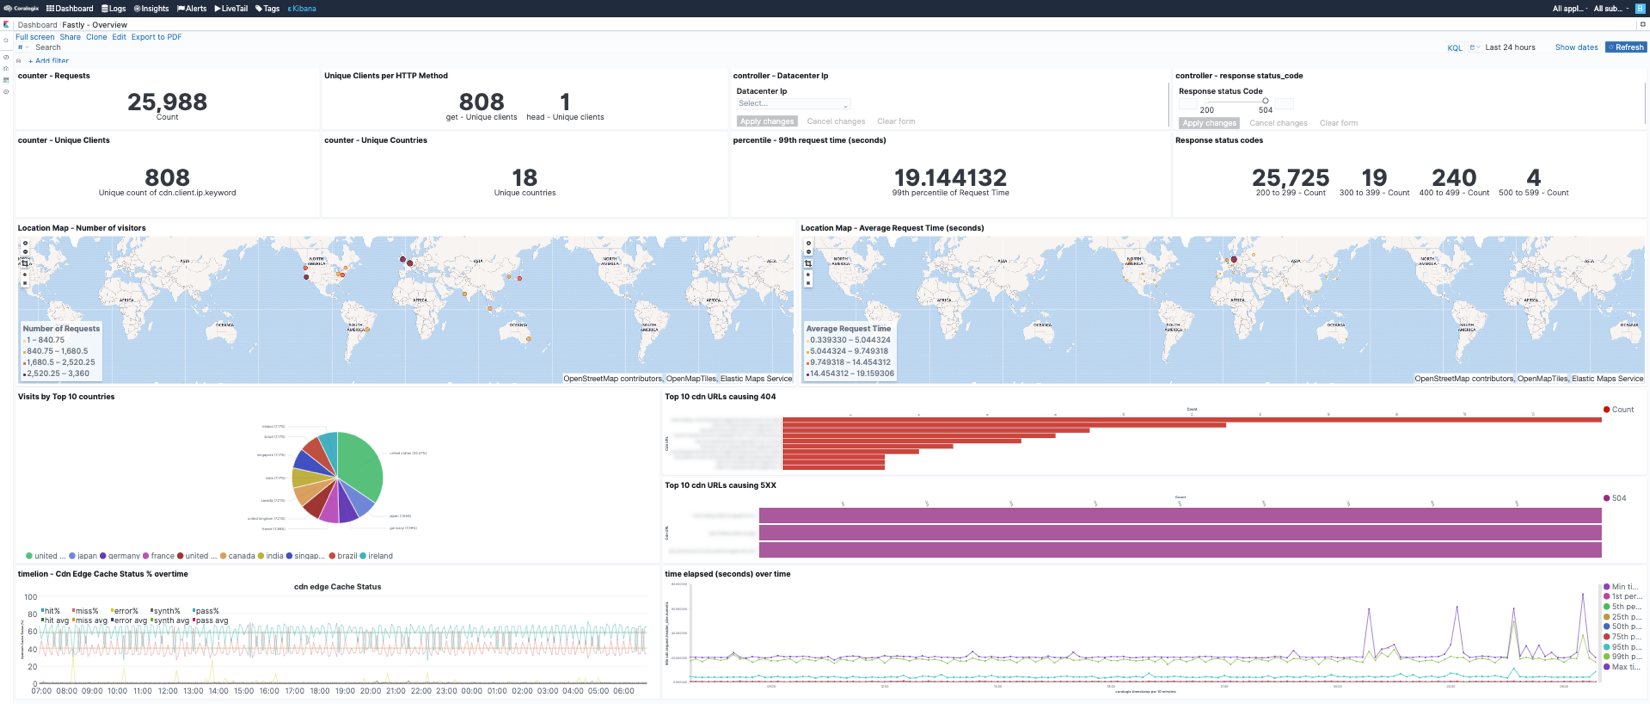
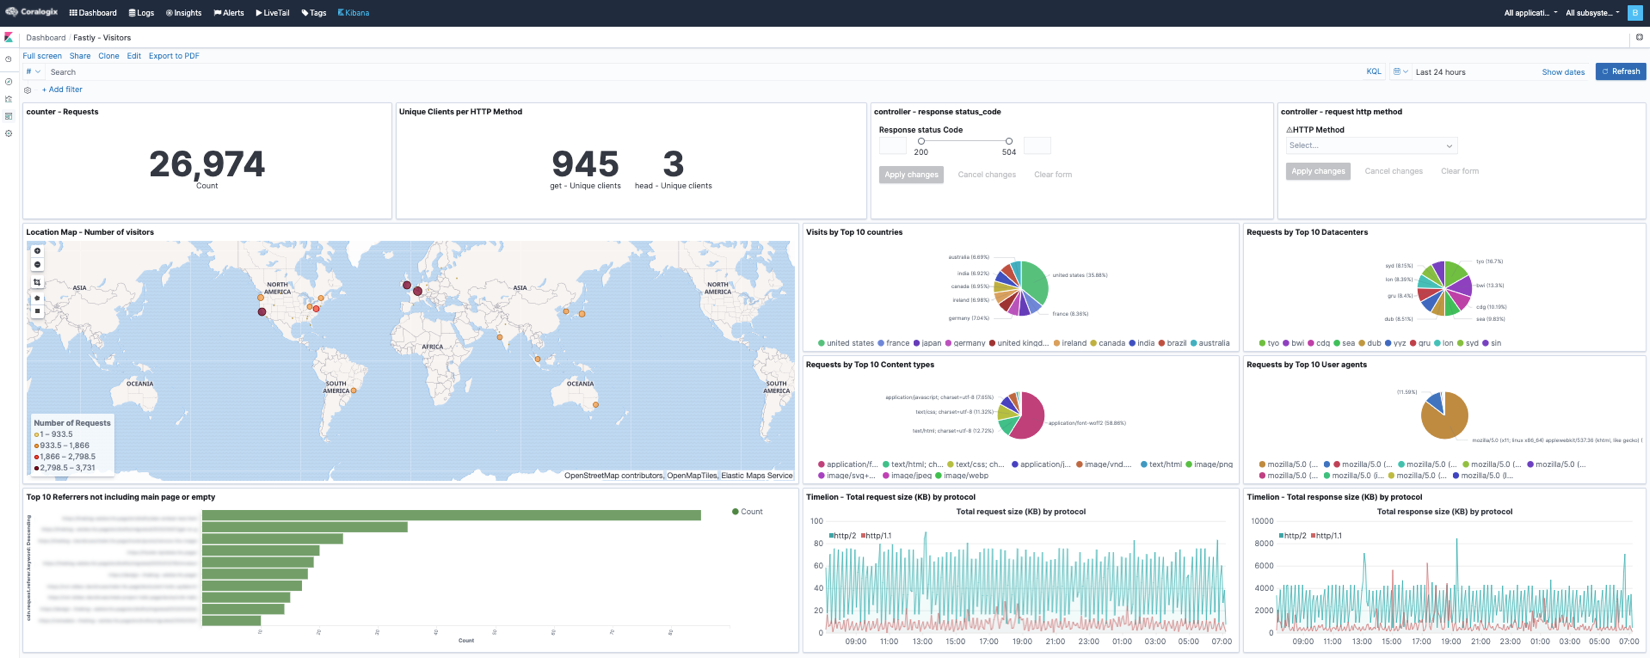
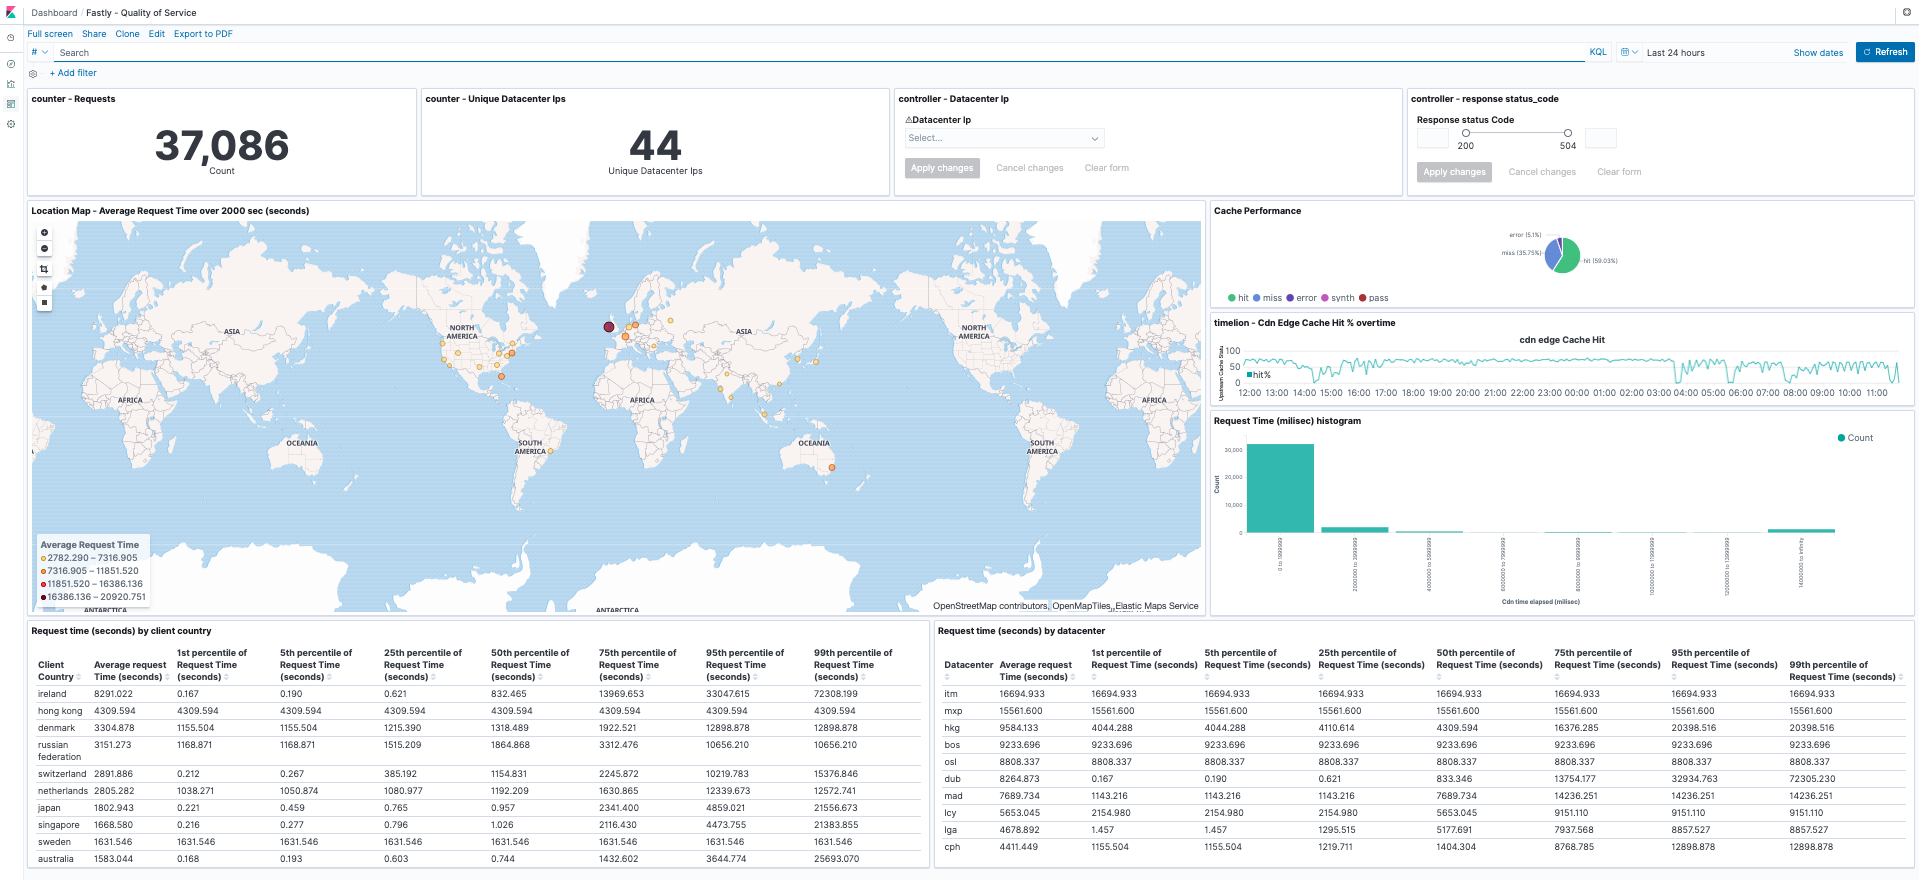
Here are a few examples of data dashboards we created using Fastly data. Using fields like client-IP, client-country, datacenter, status-code, request-time, cache-status, content-type, etc.. and the advanced Kibana & Timelion visualizations and aggregations types, we were able to create these Overview, Visitors and Quality of Service dashboards. The options are practically limitless and you may create any visualization you can think of as long as your logs contain that data you want to visualize. For more information please visit our Kibana tutorial.
Coralogix User-defined alerts enable you to easily create any alert you have in mind, using complex queries and various conditions heuristics, thus being more proactive with your Fastly data and provide you and your team insights you could never gain or anticipate from a traditional log investigation. Here are some examples of alerts we created using traditional Fastly data.
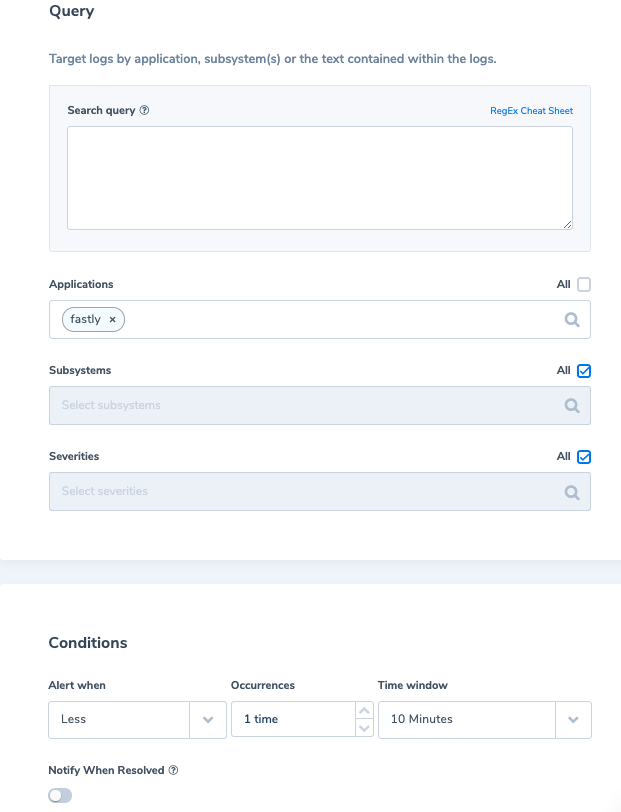
When Fastly stops sending logs for some reason, it is important for us to be notified.
Alert Filter: set a filter on the application name that represents your Fastly logs. In my case, we named it fastly.
Alert Condition: less than 1 time in 10min
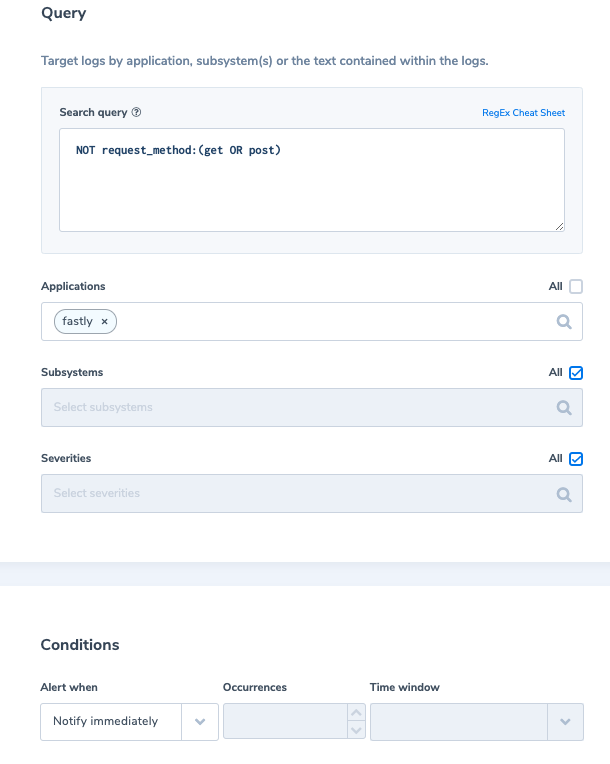
Usually, requests to a website are done VIA GET or POST methods. Other requests are commonly used by malicious actors.
Alert Filter: ‘NOT request_method:(get OR post)’
Alert Condition: ‘Notify immediately’
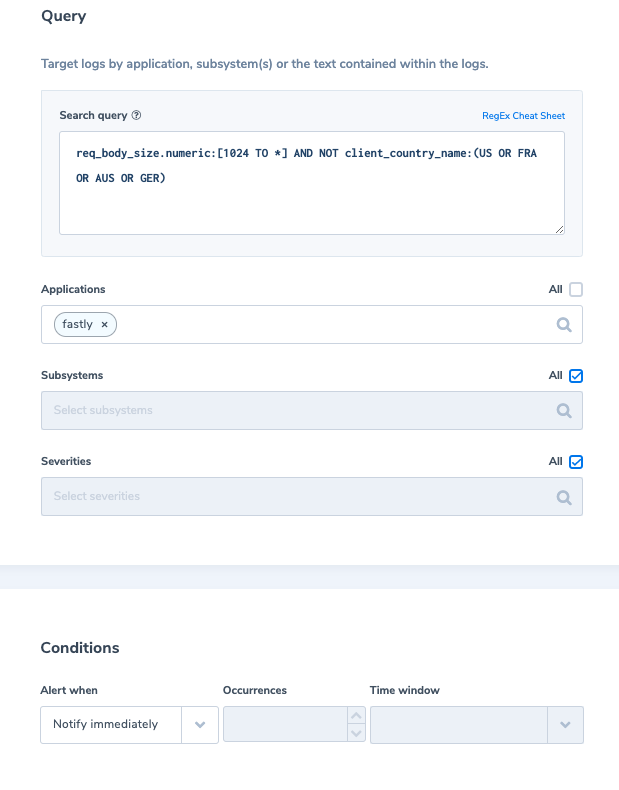
Website defacement is an attack on a website that changes the visual appearance of a website or a web page. Cases, where the request body size exceeding the expected size (usually with web content sites, the expected size for the request body is ~1024 bytes) and the request origin country is somewhat not expected, might be an indication of malicious activity.
Alert Filter: ‘req_body_size.numeric:[1024 TO *] AND NOT client_country_name:(US OR FRA OR AUS OR GER)’
Alert Condition: ‘Notify immediately’
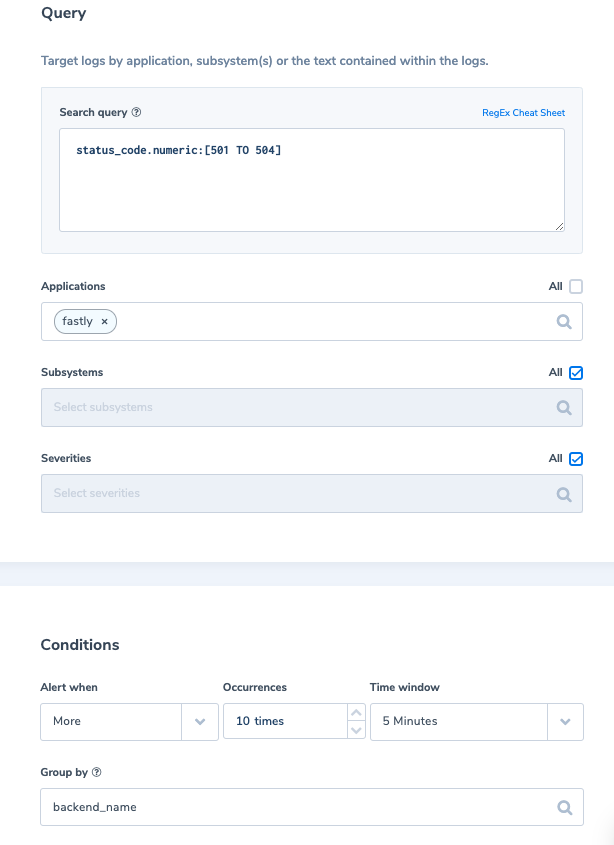
A high frequency of 501-504 errors from any backend can indicate a backend outage.
Alert Filter: ‘status_code.numeric:[501 TO 504]’
Alert Condition: ‘More than 10 times in 5 min’
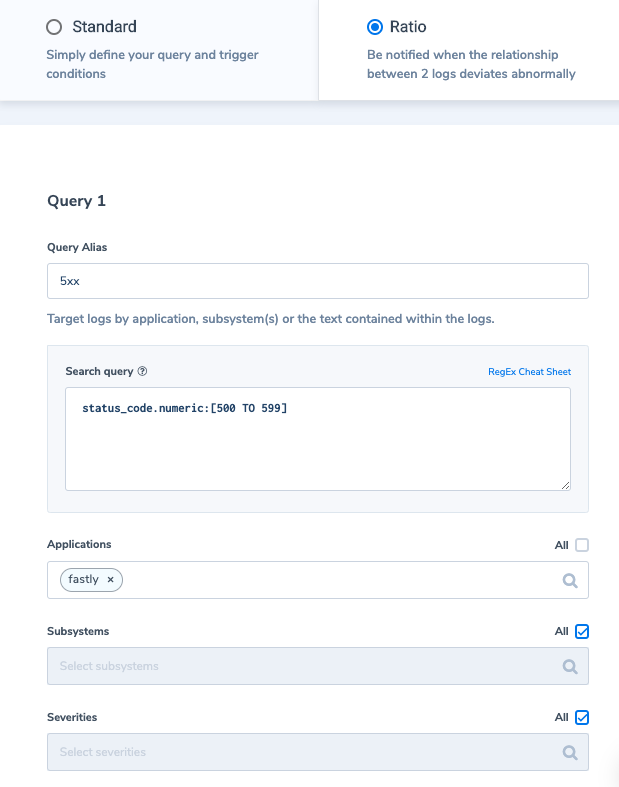
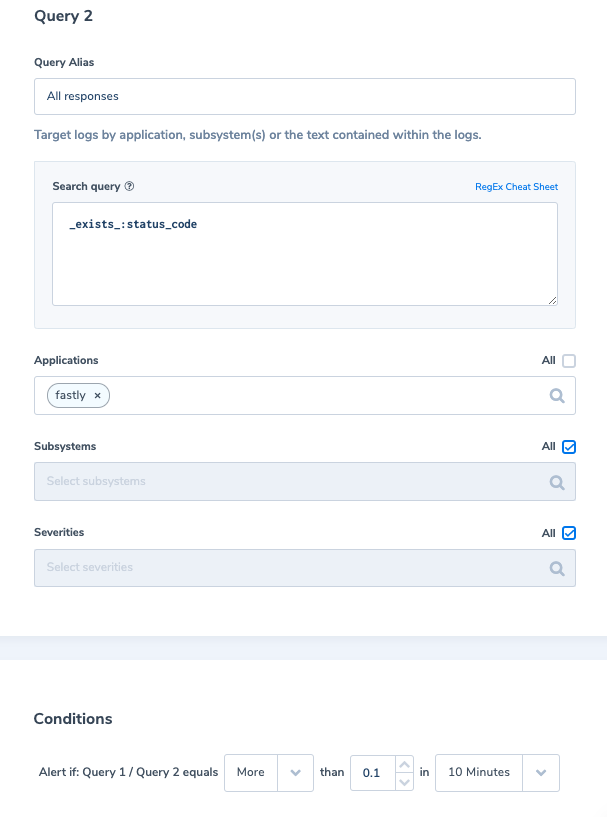
Alert Filter 1: ‘status_code.numeric:[500 TO 599]’
Alert Filter 2: ‘_exists_:status_code’
Alert Condition (Query1/Query2): ‘More than 0.1 times in 10 min’
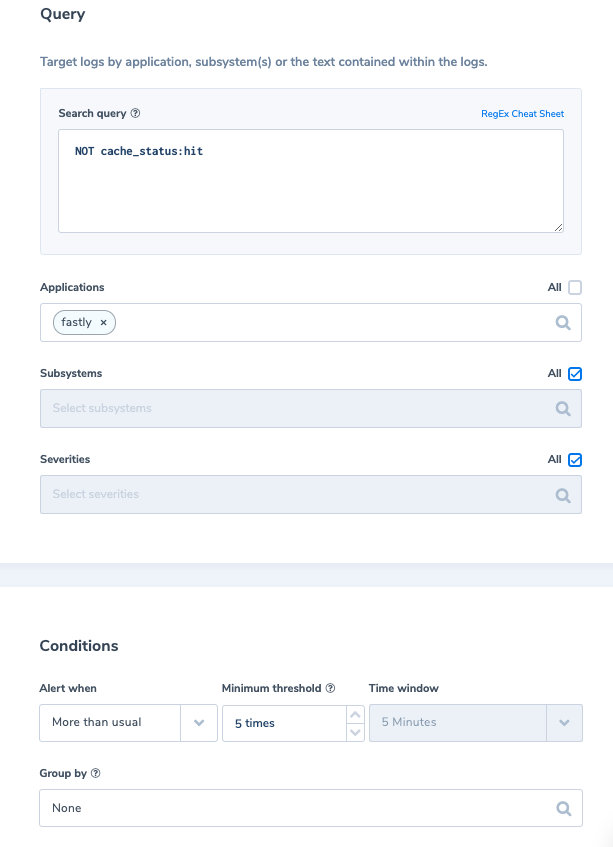
Alert Filter: ‘NOT cache_status:hit’
Alert Condition: ‘More than usual times in 5 min with an allowed minimum of 5 occurrences’
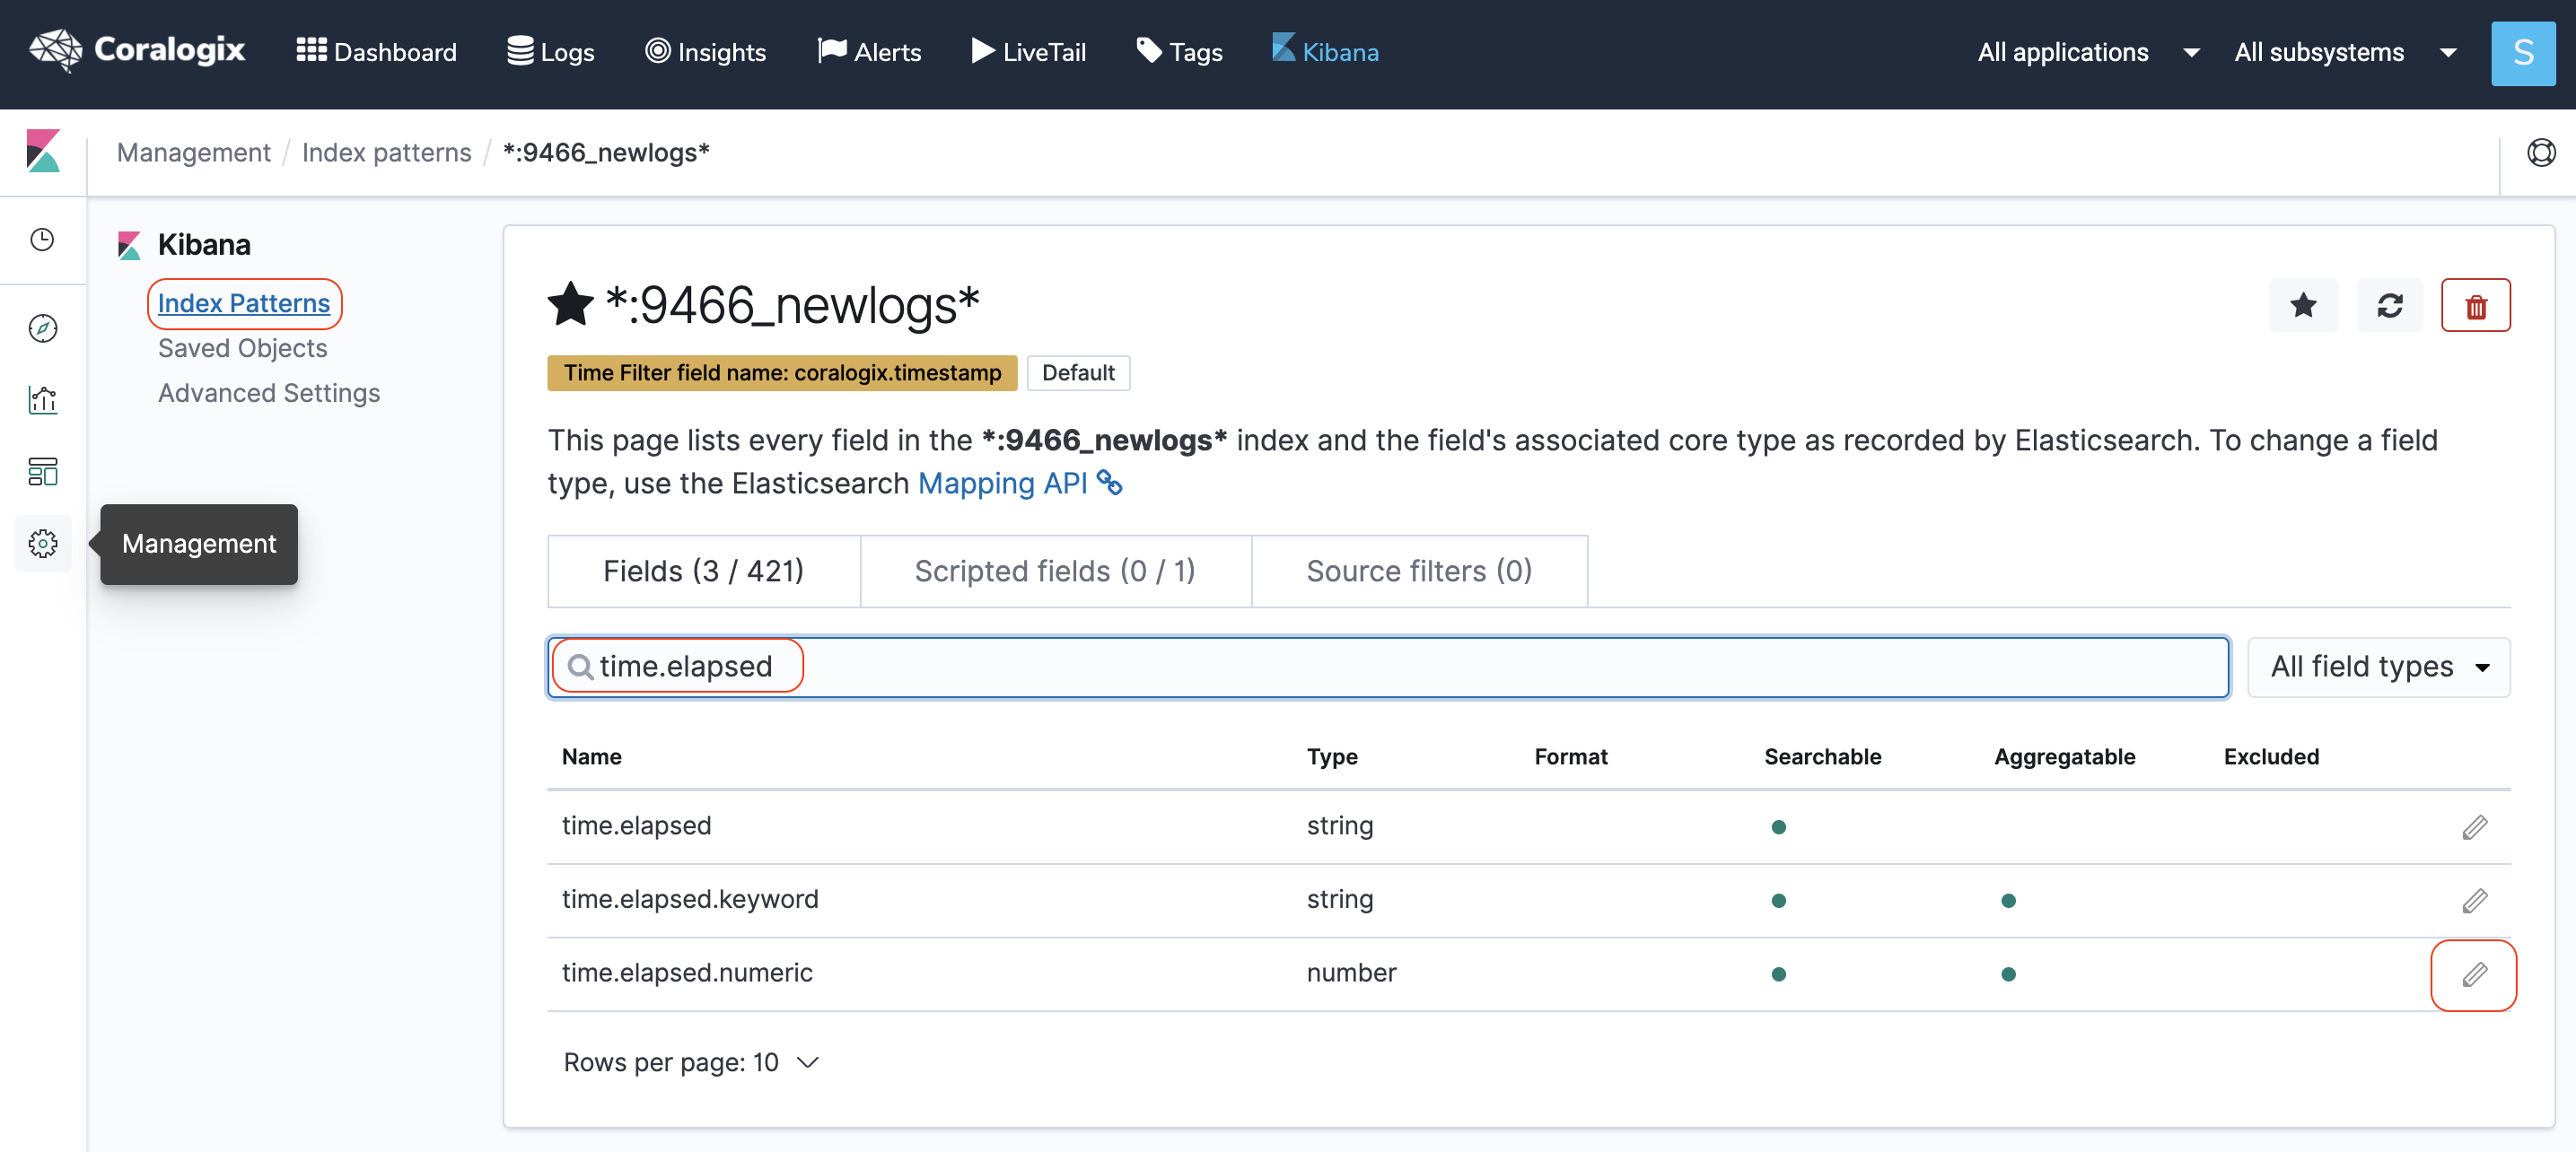
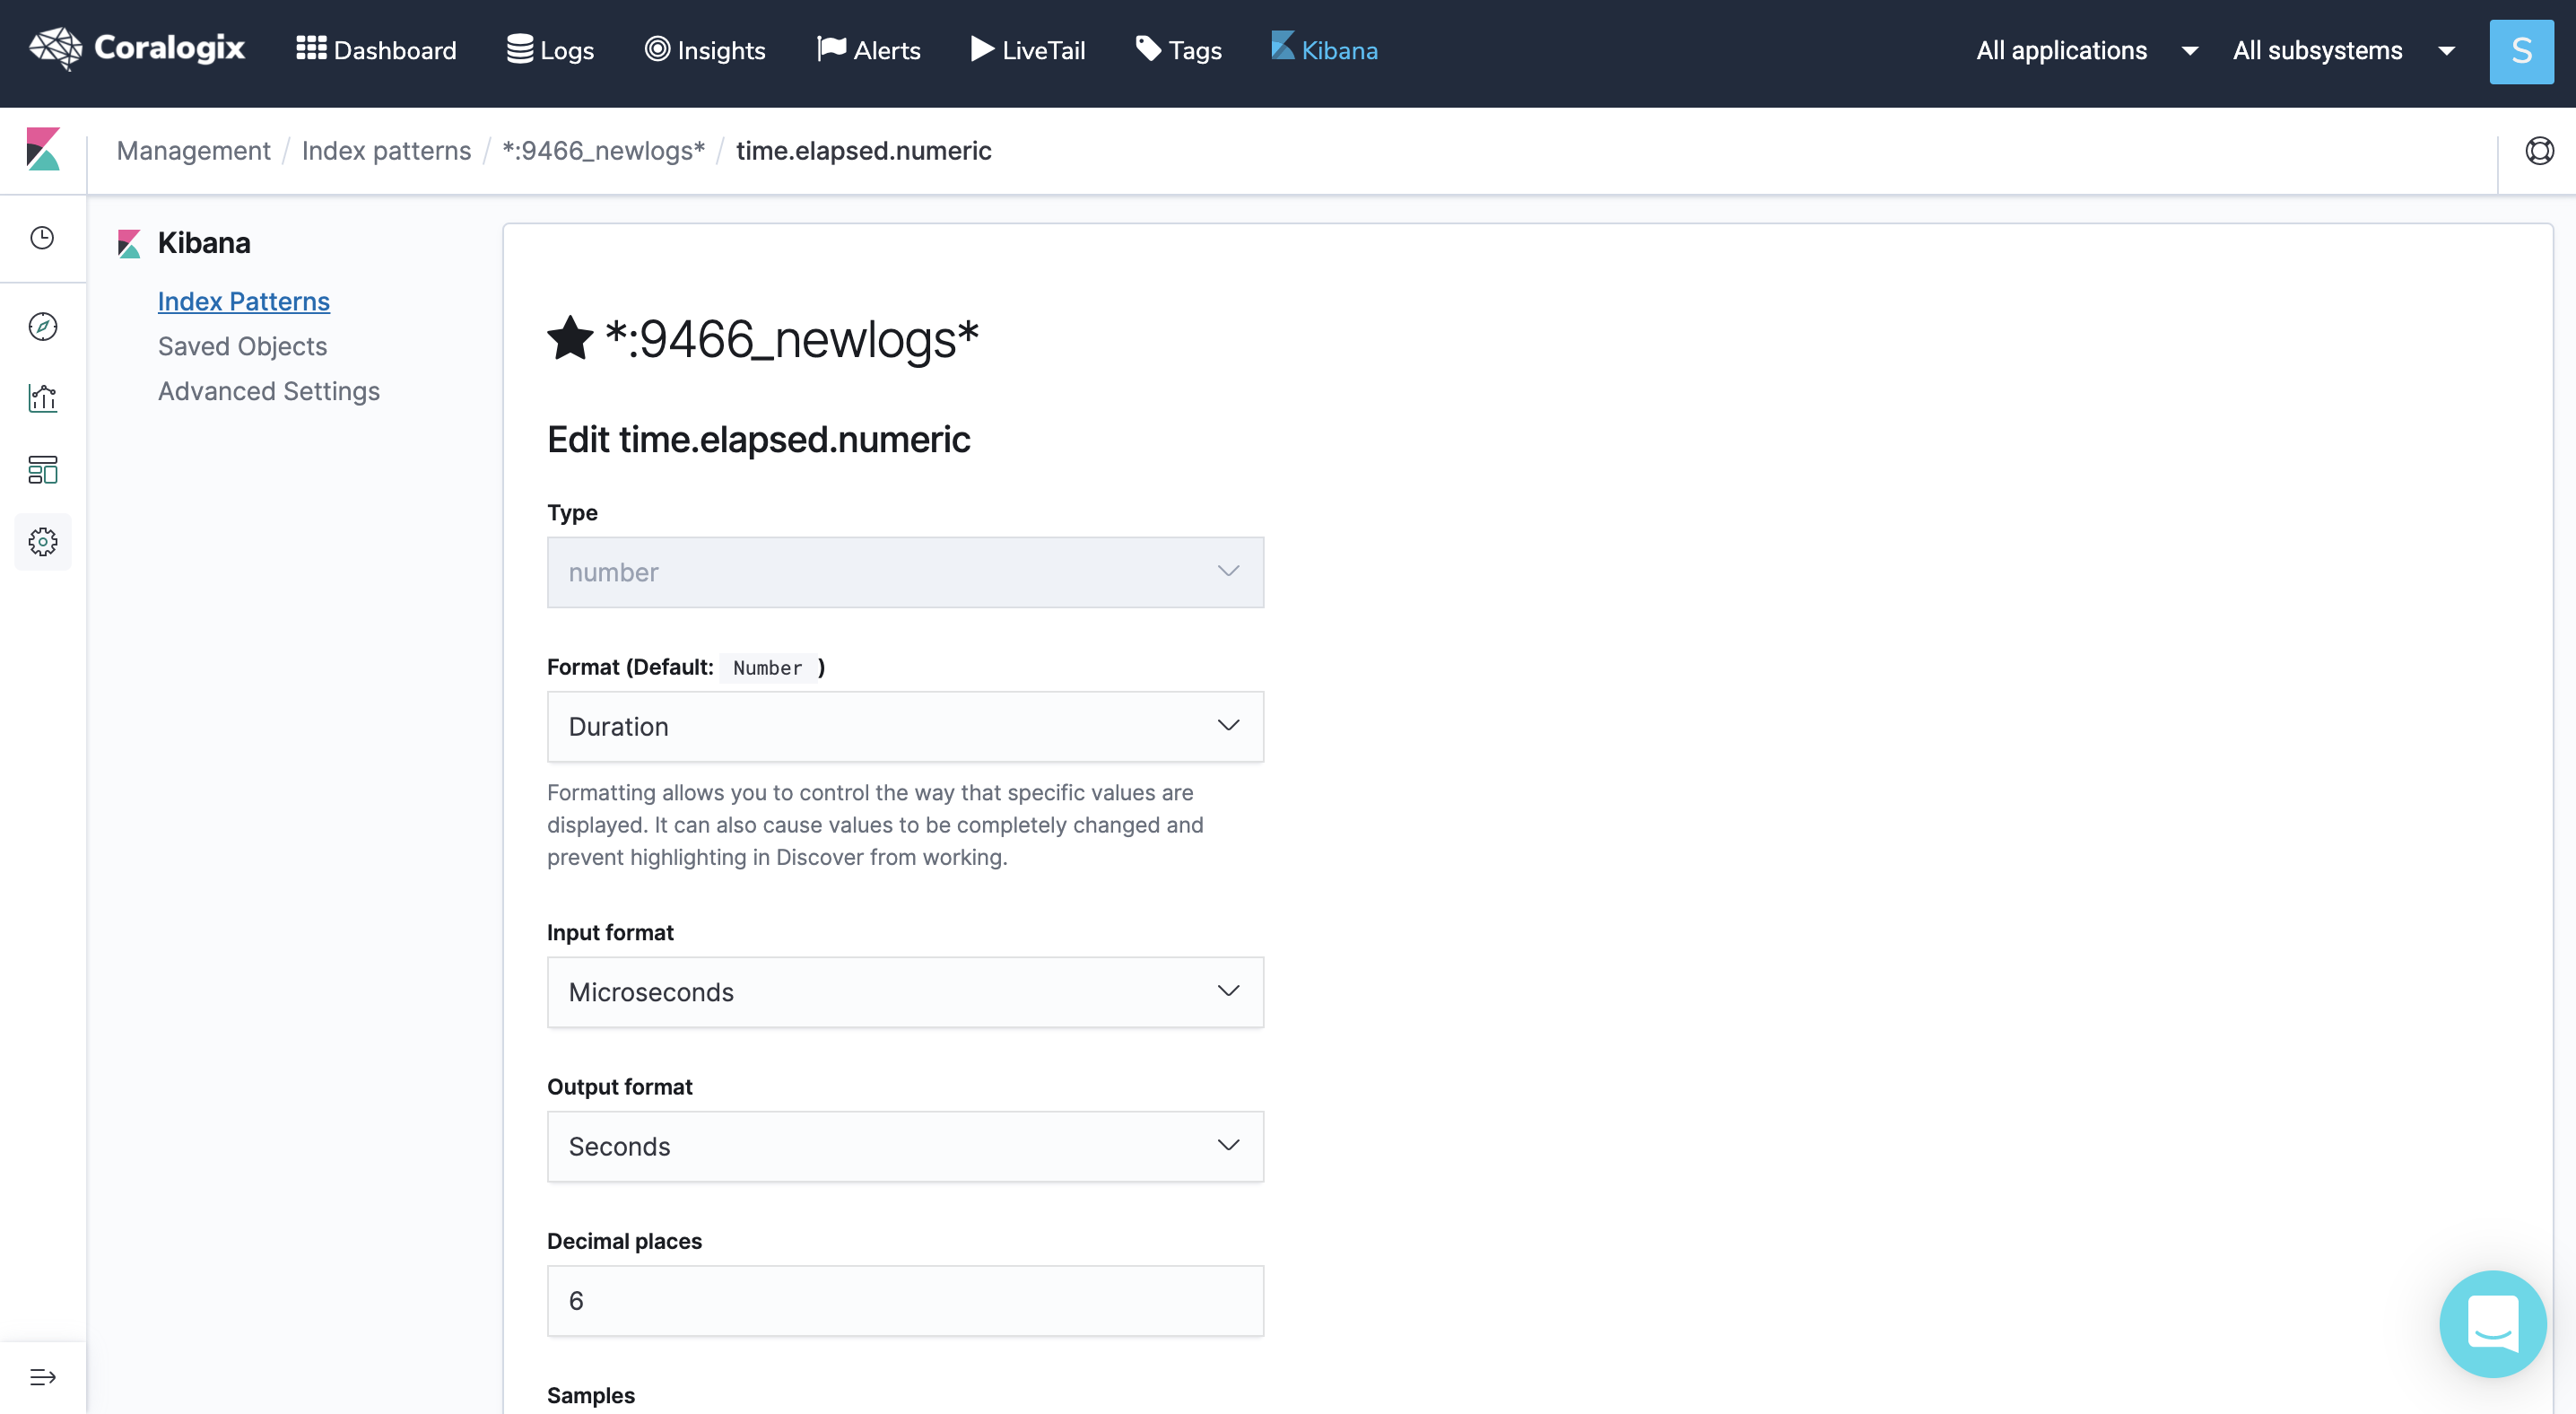
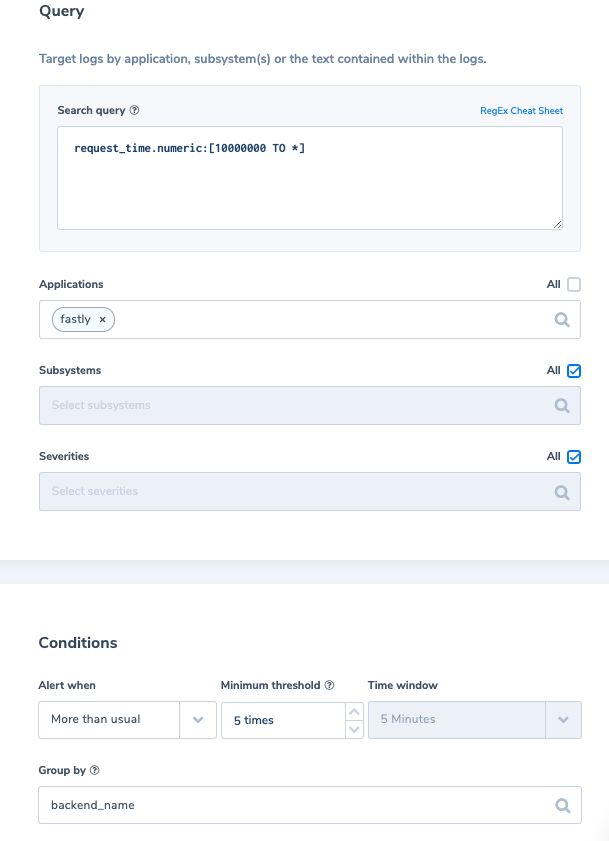
A long request time, higher than 10 seconds from any backend can indicate backend issues (request_time unit is micro sec).
Alert Filter: ‘request_time.numeric:[10000000 TO *]’
Alert Condition: ‘More than usual times in 5 min with an allowed minimum of 5 occurrences’
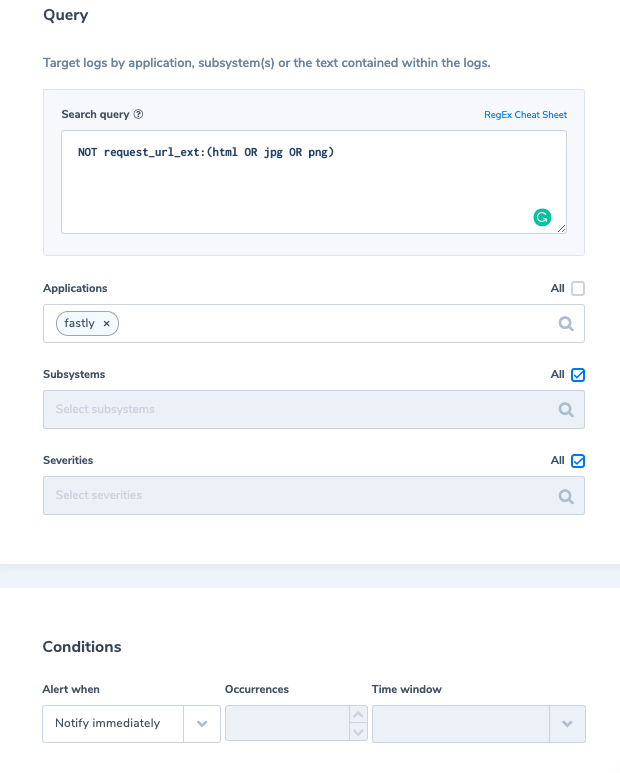
The file extension specified in a URL is expected to be Html, jpg, png.
Alert Filter: ‘NOT request_url_ext:(html OR jpg OR png)’
Alert Condition: ‘Notify immediately’
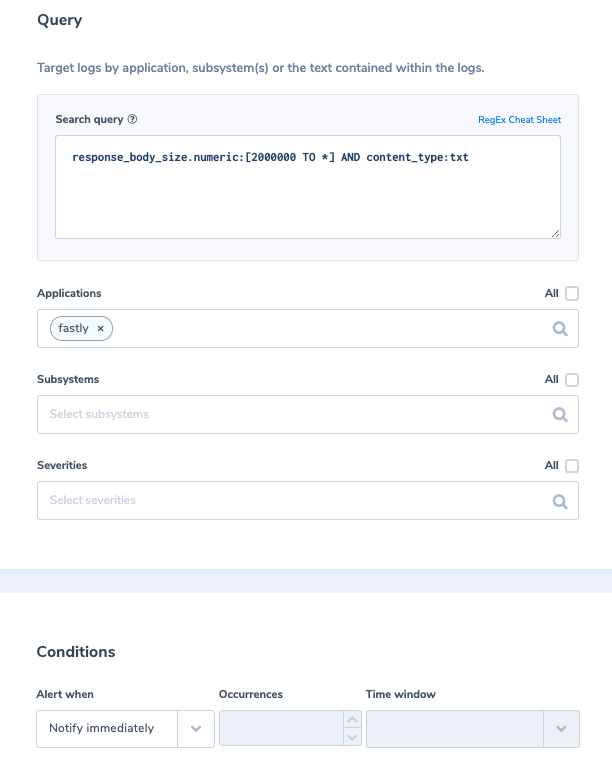
Data exfiltration occurs when malware and/or a malicious actor carries out an unauthorized data transfer from a computer. When the response body size is exceeding the normal threshold for .txt content request it might indicate an attempt to exfiltrate data.
Alert Filter: ‘response_body_size.numeric:[2000000 TO *] AND content_type:txt’
Alert Condition: ‘Notify immediately’
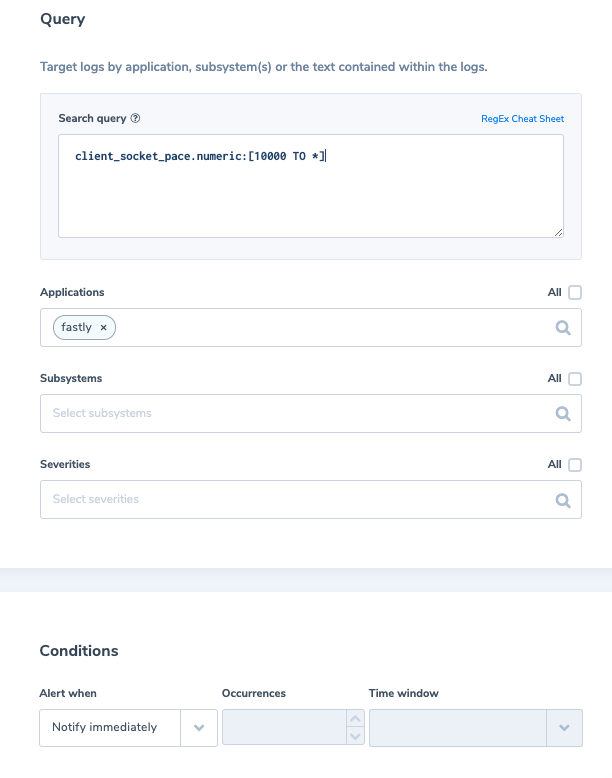
Client socket pace is the ceiling rate in kilobytes per second for bytes sent to the client. When it is exceeding the normal rate it might indicate an attempt to exfiltrate data.
Alert Filter: ‘client_socket_pace.numeric:[10000 TO *]’
Alert Condition: ‘Notify immediately’
Need help? check our website and in-app chat for quick advice from our product specialists.
Error logs are the first port of call for any outage. Great error logs provide context and cause to a mysterious, 3am outage. Engineers often treat…

If you think log files are only necessary for satisfying audit and compliance requirements, or to help software engineers debug issues during development, you’re certainly not…
Logging is critical for monitoring and troubleshooting your Node.js project. The open-source Winston logger helps take a load off our shoulders by making it easier to…
