The new standard of observability is here. Discover Olly, the industry’s first
Log observability and log monitoring are terms often used interchangeably, but really they describe two approaches to solving and understanding different things.
Observability refers to the ability to understand the state of a complex system (or series of systems) without needing to make any changes or deploy new code.
Monitoring is the collection, aggregation, and analysis of data (from applications, networks, and systems) which allows engineers to both proactively and reactively deal with problems in production.
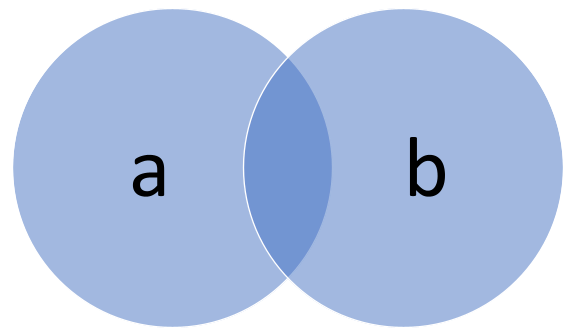
It’s easy to see why they’re treated as interchangeable terms, as they are deeply tied to each other. Without monitoring, there would be no observability (because you need all of that data that you’re collecting and aggregating in order to gain system observability). That said, there’s a lot more to observability than passively monitoring systems in case something goes wrong.
In this article, we will examine the different elements that make up monitoring and observability and see how they overlap.
Types of Monitoring
Monitoring is a complex and diverse field. There are a number of key elements and practices that should be employed for effective monitoring. If monitoring refers to looking at a series of processes, and how they are conducted, whether they complete successfully and efficiently, then you should be aware of the following types of monitoring to build your monitoring practice.
Black and White Box Monitoring
Black box monitoring, also known as server-level monitoring, refers to the monitoring of specific metrics on the server such as disk space, health, CPU metrics, and load. At a granular level, this means aggregating data from network switches, load balancers, looking at disk health, and many other metrics that you may traditionally associate with system administration.
White box monitoring refers more specifically to what is running on the server. This can include things like queries to databases, application performance versus user requests, and what response codes your application is generating. White box monitoring is critical for application and web layer vulnerability understanding.
White and black box monitoring shouldn’t be practiced in isolation. Previously, more focus may have been given to black box or server-level monitoring. However, with the rise of the DevOps and DevSecOps methodologies, they are more frequently carried out in tandem. When using black and white box monitoring harmoniously, you can use the principles of observability to gain a better understanding of total system health and performance. More on that later!
Real-Time vs Trend Analysis
Real-time monitoring is critical for understanding what is going on in your system. It covers the active status of your environment, with log and metric data relating to things like availability, response time, CPU usage, and latency. Strong real-time analysis is important for setting accurate and useful alerts, which may notify you of critical events such as outages and security breaches. Log observability and monitoring depend heavily on real-time analysis.
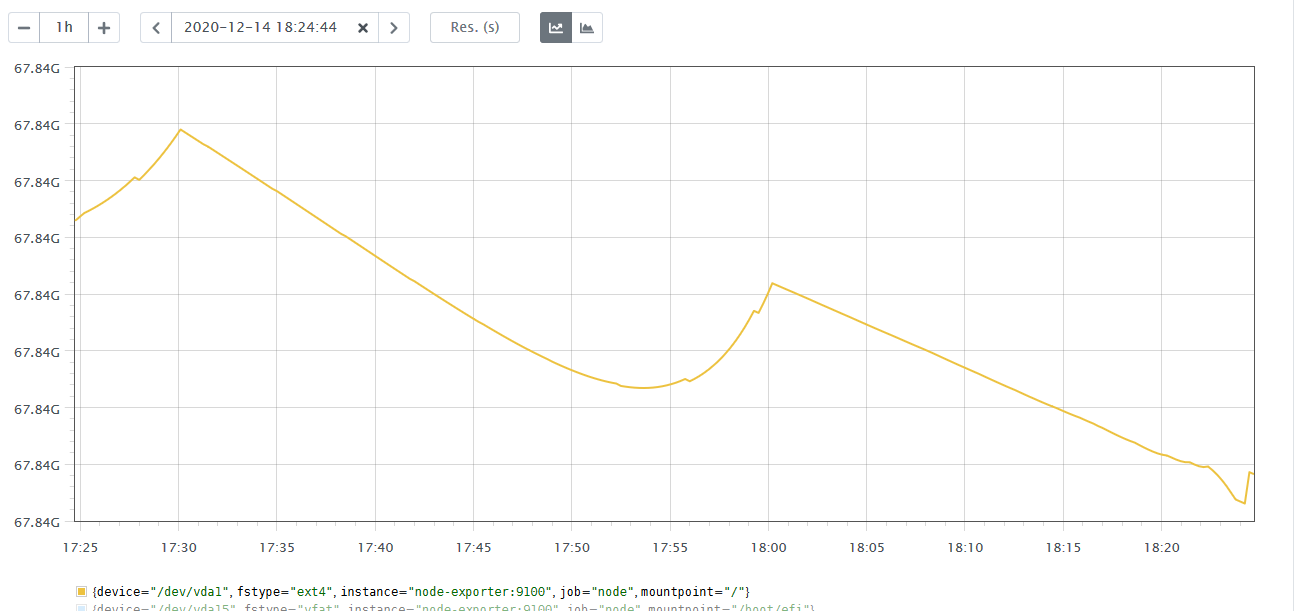
Think of trend analysis as the next stage of real-time analysis. If you’re collecting data and monitoring events in your system in real-time, trend analysis is helpful for gaining visibility into patterns of events. This can be accomplished with a visualization tool, such as Kibana or native Coralogix dashboards.
Trend analysis allows organizations to correlate information and events from disparate systems which may together paint a better picture of system health or performance. Thinking back to the introduction of this piece, we can see where this might link into observability.
Performance Monitoring
Performance monitoring is pretty self-explanatory. It is a set of processes that enable you to understand either network, server, or application performance. This is closely linked to system monitoring, which may be the combination of multiple metrics from multiple sources.
Performance monitoring is particularly important for organizations with customer-facing applications or platforms. If your customers catch problems before you do, then you risk reputational or financial impact.
Analyzing Metrics
Good monitoring relies on the collection, aggregation, and analysis of metrics. How these metrics are analyzed will vary from organization to organization, or on a more granular level, from team to team.
There is no “one size fits all” for analyzing metrics. However, there are two powerful tools at your disposal when considering metric analysis.
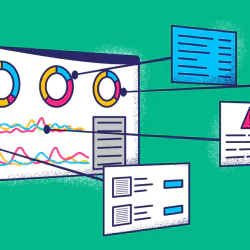
Visualization
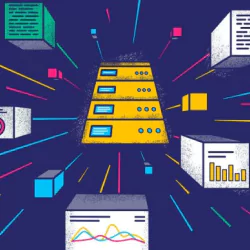
Data visualization is nothing particularly new. However, its value in the context of monitoring is significant. Depending on what you choose to plot on a dashboard, you can cross-pollinate data from different sources which enhances your overall system understanding.
For example, you might see on a single dashboard with multiple metrics that your response time is particularly high during a specific part of the day. When this is overlaid with network latency, CPU performance, and third-party outages, you can gain context.
Context is key here. Visualization gives your engineers the context to truly understand events in your system, not as isolated incidents, but interconnected events.
Machine Learning
The introduction of machine learning to log and metric analysis is an industry-wide game changer. Machine learning allows predictive analytics based on your current system health and status and past events. Log observability and monitoring are taken to the next level by machine learning practices.
Sifting through logs for log observability and monitoring is an often time-consuming task. However, tools like Loggregation effectively filter and promote logs based on precedent, without needing user intervention. Not only does this save time in analysis, which is particularly important post-security events, but it also means your logging system stays lean and accurate.
Defining Rules
Monitoring traditionally relies on rules which trigger alerts. These rules often need to be fine-tuned over time, because setting rules to alert you of things that you don’t know are going to happen in advance is difficult.
Additionally, rules are only as good as your understanding of the system they relate to. Alerts and rules require a good amount of testing, to prepare you for each possible eventuality. While machine learning (as discussed above) can make this a lot easier for your team, it’s important to get the noise-to-signal ratio correct.
The Noise-to-Signal Ratio
This is a scientific term (backed up by a formula), which helps to define what the acceptable level of background noise is for clear signals or, in this case, insights. In terms of monitoring, rules, and alerts; we’re talking about how many false or acceptable error messages there are in combination with unhelpful log data. Coralogix has a whole set of features that help filter out the noise, while ensuring the important signals reach their target, to help defend your log observability and monitoring against unexpected changes in data.
From Monitoring to Observability
So what is the difference then?
Monitoring is the harvesting and aggregation of data and metrics from your system. Observability builds on this and turns the harvested data into insights and actionable intelligence about your system. If monitoring provides visibility, then observability provides context.
A truly observable system provides all the data that’s needed in order to understand what’s going on, without the need for more data. Ultimately, an observability platform gives you the ability to see trends and abnormalities as they emerge, instead of waiting for alerts to be triggered. A cornerstone of your observability is log observability and monitoring.
In this way, you can use marketing metrics as a diagnostic tool for system health, or even understand the human aspect of responses to outages by pulling in data from collaboration tools.
Log Observability and Monitoring
Monitoring and observability shouldn’t be viewed in isolation: the former is a precursor to the latter. Observability has taken monitoring up a few notches, meaning that you don’t need to know every question you’ll ask of your system before implementing the solution.
True observability is heterogeneous, allowing you to cross-analyze data from your Kubernetes cluster, your firewall, and your load balancer in a single pane of glass. Why? Well, you might not know why you need it yet, but the beauty of a truly observable system is that it’s there when you need to query it.
As systems grow ever more advanced, and there are increasing numbers of variables in play, a robust observability platform will give you the information and context you need to stay in the know.