
AWS Lambda Logging & Monitoring Tutorial
Going serverless relieves you of setting up servers, updating operating systems, or maintaining physical infrastructure. But what happens when a function doesn’t work and things go…

Ruby is an opinionated language with inbuilt Ruby logging monitoring options that will serve the needs of small and basic applications. Whilst there are fewer alternatives to these than say, the JavaScript world, there are a handful, and in this post, I will highlight those that are active (based on age and commit activity) and help you figure out the options for logging your Ruby (and Rails applications).
Before proceeding, take note that this article was written using Rails v4.x; later versions of Rails may not be supported.
Before deciding what tool works best for you, following broad logging best practices will also apply to Ruby logging and will help make anything you do log more useful when trying to track down a problem. Read “The Most Important Things to Log in Your Application Software” and the introduction of “JAVA logging – how to do it right” for more details, but in summary, these rules are:

Ruby ships with two inbuilt methods for logging application flow, puts, most suited to command line applications, and logger, for larger, more complex applications.
puts takes one parameter, the object(s) you want to output to stdout, with each item outputting to a new line:
puts(@post.name, @post.title)
logger provides a lot of options for an inbuilt class, and Rails enables it by default.
logger.info “#{@post.name}, #{@post.title}“
The logger class provides all the log information you typically see when running Rails. You can set levels with each message, and log messages above a certain level.
require ‘logger’
logger = Logger.new(STDOUT)
logger.level = Logger::WARN
logger.debug(“No output”)
logger.info(“No output”)
logger.warn(“Output”)
logger.fatal(“Output”)
Logger doesn’t escape or sanitize output, so remember to handle that yourself. For details on how to do this, and create other forms of custom loggers and message formatters, read the official docs
Whilst many Rails developers find it’s default logging options essential during development, in production, it can be noisy, overwhelming, and at worst, unhelpful. Lograge attempts to reduce this noise to more salient and useful information, and into a format that is less human-readable, but is more useful to external logging systems if you use its JSON formatted output option.
There are many ways you can initialize and configure the Gem, I stuck to the simplest, by creating a file in config/initializers/lograge.rb with the following content:
Rails.application.configure do
config.lograge.enabled = true
end
Which changes the output to this.
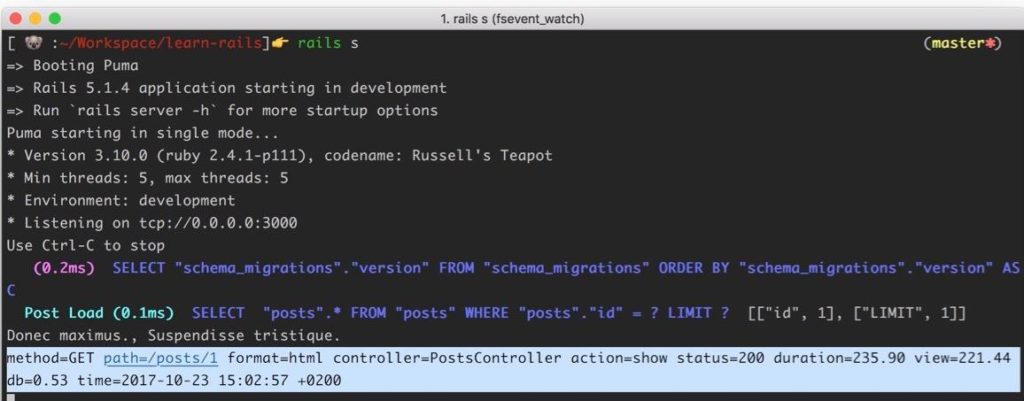
Lograge output
Unsurprisingly there are a lot of configuration options to tweak the logging output to suit you based on values available in the logging event. For example to add a timestamp:
Rails.application.configure do
config.lograge.enabled = true
config.lograge.custom_options = lambda do |event|
{ time: event }
end
end
You can also add custom payloads into the logging information for accessing application controller methods such as request and current_user.
config.lograge.custom_payload do |controller|
{
# key_name: controller.request.*,
# key_name: controller.current_user.*
# etc…
}
end
If adding all this information already feels counter to the point of lograge, then it also gives the ability to remove information based on certain criteria. For example:
config.lograge.ignore_actions = [‘PostsController#index’, ‘VisitorsController#new’]
config.lograge.ignore_custom = lambda do |event|
# return true if you want to ignore based on the event
end
Drawing inspiration from Java’s log4j library, logging offers similar functionality to the inbuilt logger, but adds hierarchical logging, custom level names, multiple output destinations and more.
require ‘logging’
logger = Logging.logger(STDOUT)
logger.level = :warn
logger.debug “No output”
logger.warn “output”
logger.fatal “output”
Or to create custom loggers that output to different locations and assigned to different classes.
require ‘logging’
Logging.logger[‘ImportantClass’].level = :warn
Logging.logger[‘NotSoImportantClass’].level = :debug
Logging.logger[‘ImportantClass’].add_appenders \
Logging.appenders.stdout,
Logging.appenders.file(‘example.log’)
class ImportantClass
logger.debug “I will log to a file”
end
class NotSoImportantClass
logger.debug “I will log to stdout”
end
One of the more recent projects on this list, semantic_logger aims to support high availability applications and offers a comprehensive list of logging destinations out of the box. If you are using Rails, then instead use the rails_semantic_logger gem that overrides the Rails logger with itself. There are a lot of configuration options, where you can sort log levels, tags, log format, and much more. For example:
config.log_level = :info
# Send to Elasticsearch
SemanticLogger.add_appender(
appender: :elasticsearch,
url: ‘http://localhost:9200’
)
config.log_tags = {
# key_name: :value,
# key_name: -> request { request.object[‘value’] }
}
With all the above options you will still need to parse, process and understand your logs somehow, and numerous open source and commercial services can help you do this (open your favorite search engine and you’ll find lots), I’ll highlight those that support Ruby well.
If you’re a fluentd user, then there’s a Ruby gem that offers different ways to send your log data. If you’re a Kibana user, then Elastic offers a gem that integrates with the whole ELK stack.
Papertrail has a gem that extends the default logger to send logs to their remote endpoint. They haven’t updated it in a while, but it still their official solution, so should work, and if it doesn’t they offer an alternative method.
Loggly uses lograge and some custom configuration to send logs data to their service.
And for any Airbrake users, the company also offers a gem for direct integration into their service.
There are also a handful of gems that send the default ruby logs to syslog, which then enables you to send your logging data to a large amount of external open source and commercial logging services.
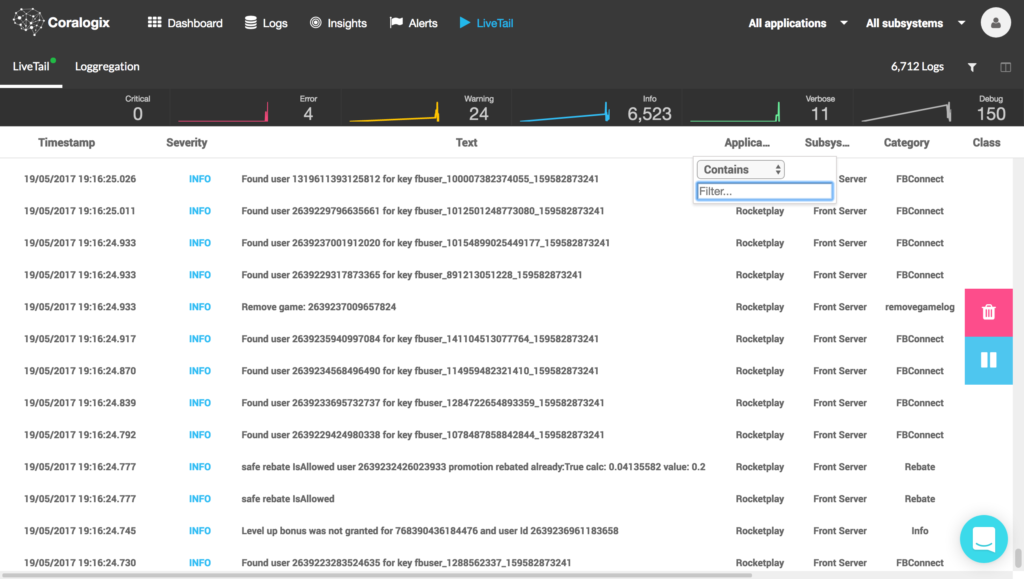
And of course, Coralogix’ own package allows you to create different loggers, assign a log level to them and other useful metadata. In addition to all standard logging features, such as flexible log querying, email alerts, centralized live tail, and a fully hosted Kibana, Coralogix provides machine learning powered anomaly detection in the context of software builds.
Another benefit is that Coralogix is the only solution which offers straightforward pricing, all packages include all features.
First, create an initializer in initializers/coralogix.rb with your account details, set a default class and extend the default Rails logger:
require ‘coralogix_logger’
PRIVATE_KEY = “<PRIVATE_KEY>”
APP_NAME = “Ruby Rails Tester”
SUB_SYSTEM = “Ruby Rails Tester Sub System”
*Private key is received upon registration, **Application name separates environments, ***Subsystem name separates components.
Coralogix::CoralogixLogger.configure(PRIVATE_KEY, APP_NAME, SUB_SYSTEM)
Rails.application.config.coralogix_logger =
Coralogix::CoralogixLogger.get_logger(“feed-service”)
Rails.logger.extend(ActiveSupport::Logger.broadcast(Rails.application.config.coralogix_logger))
And then in each class, we recommend you get an instance of the logger in each class and set the logger name to the class name, which Coralogix will use as the category. The log() method offers options to tailor the logging precision, but the severity and message are mandatory:
logger = Coralogix::CoralogixLogger.get_logger(“Posts Controller”)
logger.log(Coralogix::Severity::VERBOSE, “Post created #{post.inspect}“)
You can also use severity methods if you prefer, where only the message is mandatory, but other options are available:
logger.verbose(“Post created #{post.inspect}“)
And there you have it:
Whilst Ruby and Rails lack the ‘cool factor’ they had in the past, depending on where you look it still claims the 5th most used language (it peaked at 4th place in 2013 anyway), 12th place in the IEEE spectrum and 4th place on GitHub. It’s still a relevant, and widely used language, especially on certain platforms, such as web backends and Heroku. This means your code should be as optimized as possible. And of course, your Ruby logging/Rails logging should be as organized as possible. I hope this post will help you track down the source of potential problems in the future.

Going serverless relieves you of setting up servers, updating operating systems, or maintaining physical infrastructure. But what happens when a function doesn’t work and things go…
Platforms like Heroku give you the freedom to focus on building great applications rather than getting lost setting up and maintaining infrastructure. Heroku provides many great…

Before we dive into e-commerce logging, a short history recap: In 1992, avowed book nerd and prescient businessman Charles M. Stack launched an e-commerce site called books.com….
