Elevate Your Event Data With Custom Data Enrichment in Coralogix
Have you ever found yourself late at night combing through a myriad of logs attempting to determine why your cluster went down? Yes, that’s a really…
Whether you are just starting your observability journey or already are an expert, our courses will help advance your knowledge and practical skills.
Expert insight, best practices and information on everything related to Observability issues, trends and solutions.
Explore our guides on a broad range of observability related topics.

Life is all about perspective, and the way we look at things often defines us as individuals, professionals, business entities, and products. How you understand the world is influenced by many details, or in the case of your application – many data sources.
At Coralogix, we not only preach comprehensive data analysis but strive to enable it by continuously adding new ways to collect data. With more comprehensive data collection, you can reach a more accurate perception of your entire system and its state.
During one of our POCs, a customer wanted to take advantage of Coralogix’s advanced alerting mechanisms for monitoring Azure/Office 365 health status. We allow users to easily ingest contextual data from a wide range of contextual data sources such as status pages, feeds, and even Slack channels. Unfortunately, Office 365 does not have a public status page or API.
In this post, we will demonstrate the simple steps required to monitor the status of your Office 365 application with Coralogix.
To get around the lack of public status page or API with Office 365 and Azure, we can leverage Microsoft Graph, which exposes the health status of the current subscription services. We will use Microsoft Graph to query the API and get the information we need.
Your Office 365 health status can be checked by signing into your Office 365 admin account and navigating to the Service Health submenu:
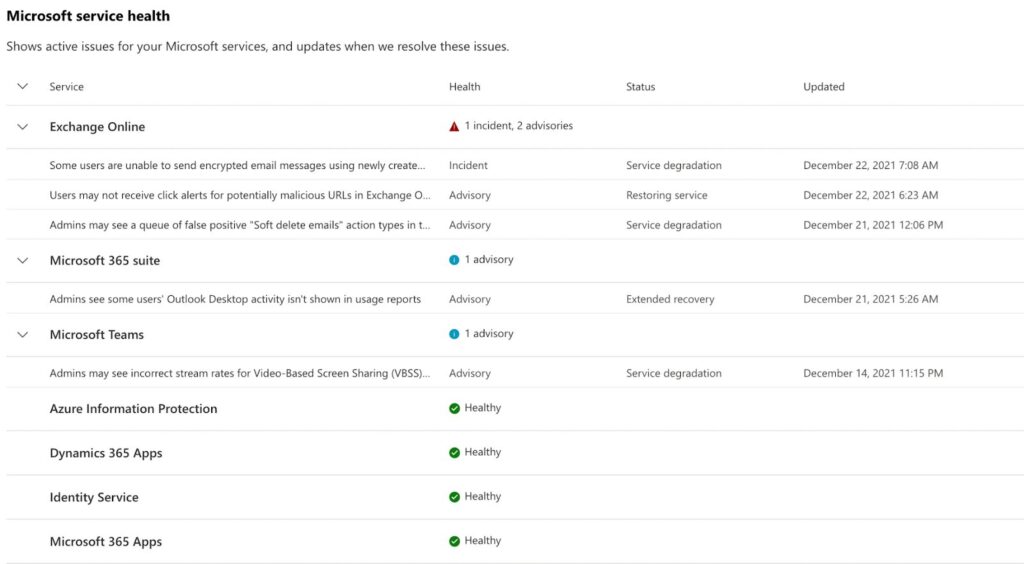
You will notice that you can view the issues of any services that you have enabled in your subscription.
Now let’s get to the fun part.
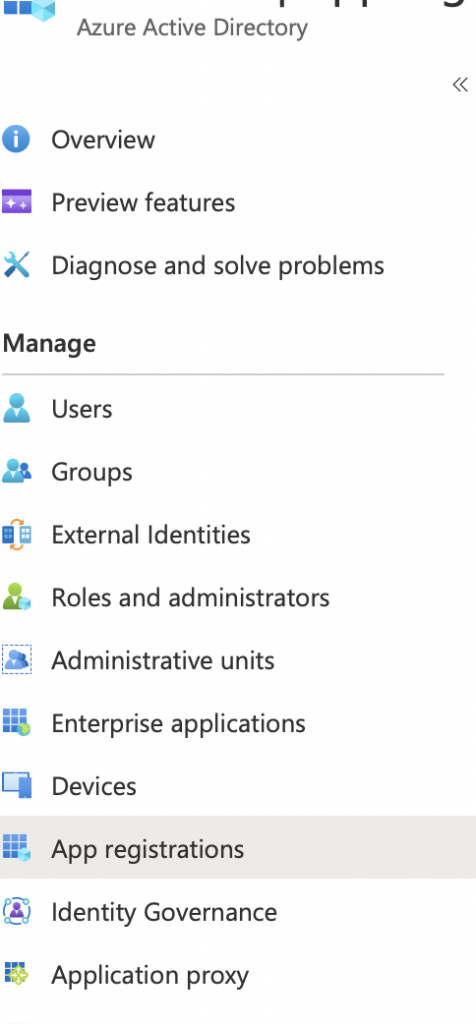
The first thing we need to do is navigate to App Registration in Azure Active Directory and register a new application. This will facilitate the authentication with 365 to sample it in a “machine-like manner.”
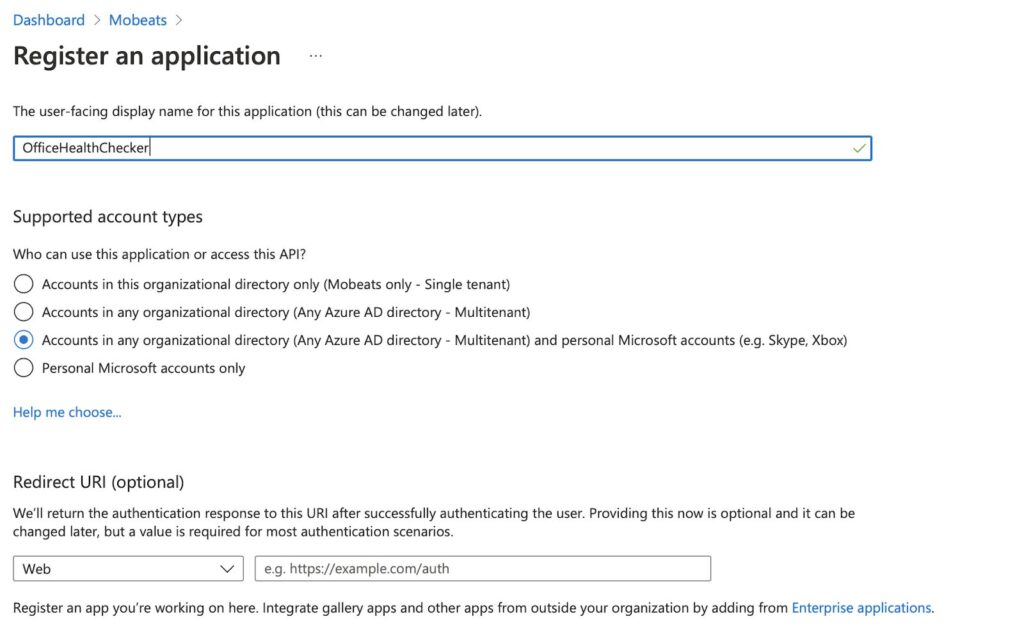
Once we register the new application, we will see the following screen to access its details. We will need to create a new secret for our application, we can click on the right and create a new one.

Note: Take note of the Application (client) ID and newly created secret, we’ll need it in the following steps.
We also need to grant the Application Permissions. Add ServiceHealth.Read.All and Grant admin consent.

Once we have this information, we will need to find our Tenant ID. Click here to retrieve it.
Since we are building a service to basically sample the status and only report if anything happened, we need some compute. And since we want this to be as low maintenance and as economical as possible, we chose to do this using lambda functions.
We need to deploy our Lambda Function to start pulling this data and pushing the logs into our Coralogix Account.
Let’s start by cloning the Function repository (here), build and deploying is quite simple. We need to have AWS CLI and SAM installed to perform the deployment.
# sam build
# sam deploy --guided
Once we deploy the Lambda function, we need to go into our AWS console and change the environment variables to match the details that we’ve collected in the previous section along with the Coralogix private key which can be found in the “send your logs” screen in the Coralogix UI.
Note: The application and subsystem are Naming tags you can choose for your application. (i.e. Application: Office365_status, Subsystem: office365_lambda_tester).
Once those values are updated with the details relevant to your application, you should be good to go. Test the Lambda function and you will see the status update in your Coralogix Account like in this example:

This data, when ingested to Coralogix, can be correlated with additional application logs and metrics for deeper context into the long-term stability of services. Advanced alerting with dynamic thresholds can be used to update relevant parties about some or all of the organization’s Office365 cloud services.
Learn more about Coralogix’s contextual data analysis solution.
Have you ever found yourself late at night combing through a myriad of logs attempting to determine why your cluster went down? Yes, that’s a really…
Metrics and Insight have been the obsession of every sector for decades now. Using data to drive growth has been a staple of boardroom meetings the…
At Payoneer, we use Coralogix to collect logs from all our environments from QA to PROD. Each environment has its own account in Coralogix and thus…


