What is the Coralogix Security Traffic Analyzer (STA), and Why Do I Need It?
The wide-spread adoption of cloud infrastructure has proven to be highly beneficial, but has also introduced new challenges and added costs – especially when it comes…

Ask any DevOps engineer, and they will tell you about all the alerts they enable so they can stay informed about their code. These alerts are the first line of defense in the fight for Perfect Uptime SLA.
With every good solution out there, you can find plenty of methods for alerting and monitoring events in the code. Each method has its own reasons and logic for how it works and why it’s the best option.
But what can you do when you need to connect two opposing methodologies? You innovate!
Recently, we had a customer approach us and describe a need to integrate our push alerting mechanism with their current Nagios infrastructure.
As part of their requirements, we had to minimize:
But requirements aside, let’s ask ourselves the most basic of questions in engineering.
Why do we need it?
The main concept of Nagios is pulling test results from either an available endpoint or by executing an agent on a machine and retrieving data from it.
Regardless of the manner in which the data is being generated, the Nagios server has to be the one pulling it.
Unfortunately, the basic concept of webhooks and resulting notifications is the exact opposite.
Webhooks are the way in which a machine will deliver the message when they need to.
Much like in human communication, you can ask me every once in a while “Is anything wrong?”
or we can agree that when something is wrong, I will tell you “Something is wrong.”
Like everything in life and tech, each has its merits and caveats.
This is where this solution comes into play.
Using this tool, you will be able to use your Nagios infrastructure to query Coralogix alerts with zero special configuration and very low system costs.
This way your Ops teams can continue looking at the same monitoring dashboards they were using prior to adopting Coralogix.
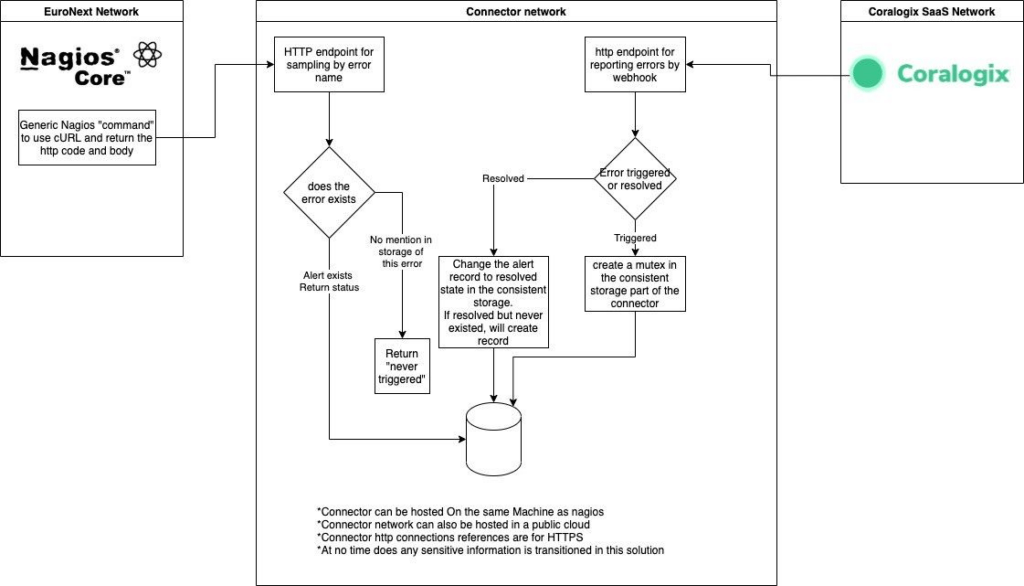
Think of it as a web-server listening to all alert webhooks coming from Coralogix. It then creates and updates an object on S3 to contain the status of each alert and the last time of update.
When Nagios requests information on a specific alert, it gets all the information it would receive from a regular hook update along with the last time of the update. This helps Nagios to be aware of the differences in time which may occur due to longer pull intervals from the Nagios configuration.
This is a basic drawing to explain the manner in which the solution will work.
The code for this solution can be found here: https://github.com/coralogix/coralogix-nagios-connector
The repository contains an elaborate manual on how to set up your own instance along with the explanations and copy-paste sections for all related commands.
In a world full of people and companies working on revolutionary new ideas, we have set out on a journey to help modern engineering teams overcome the challenges of exponential data growth in large-scale systems.
This solution is highly available and can be scaled up or down as needed, but that is not even the best attribute here!
The approach ticks off all the boxes per our customer’s requirements:

The wide-spread adoption of cloud infrastructure has proven to be highly beneficial, but has also introduced new challenges and added costs – especially when it comes…

Hybrid cloud architectures provide the flexibility to utilize both public and cloud environments in the same infrastructure. This enables scalability and power that is easy and…

A decade ago, DevOps teams were slow, lumbering behemoths with little automation and lots of manual review processes. As explained in the 2020 State of DevOps…