The new standard of observability is here. Discover Olly, the industry’s first
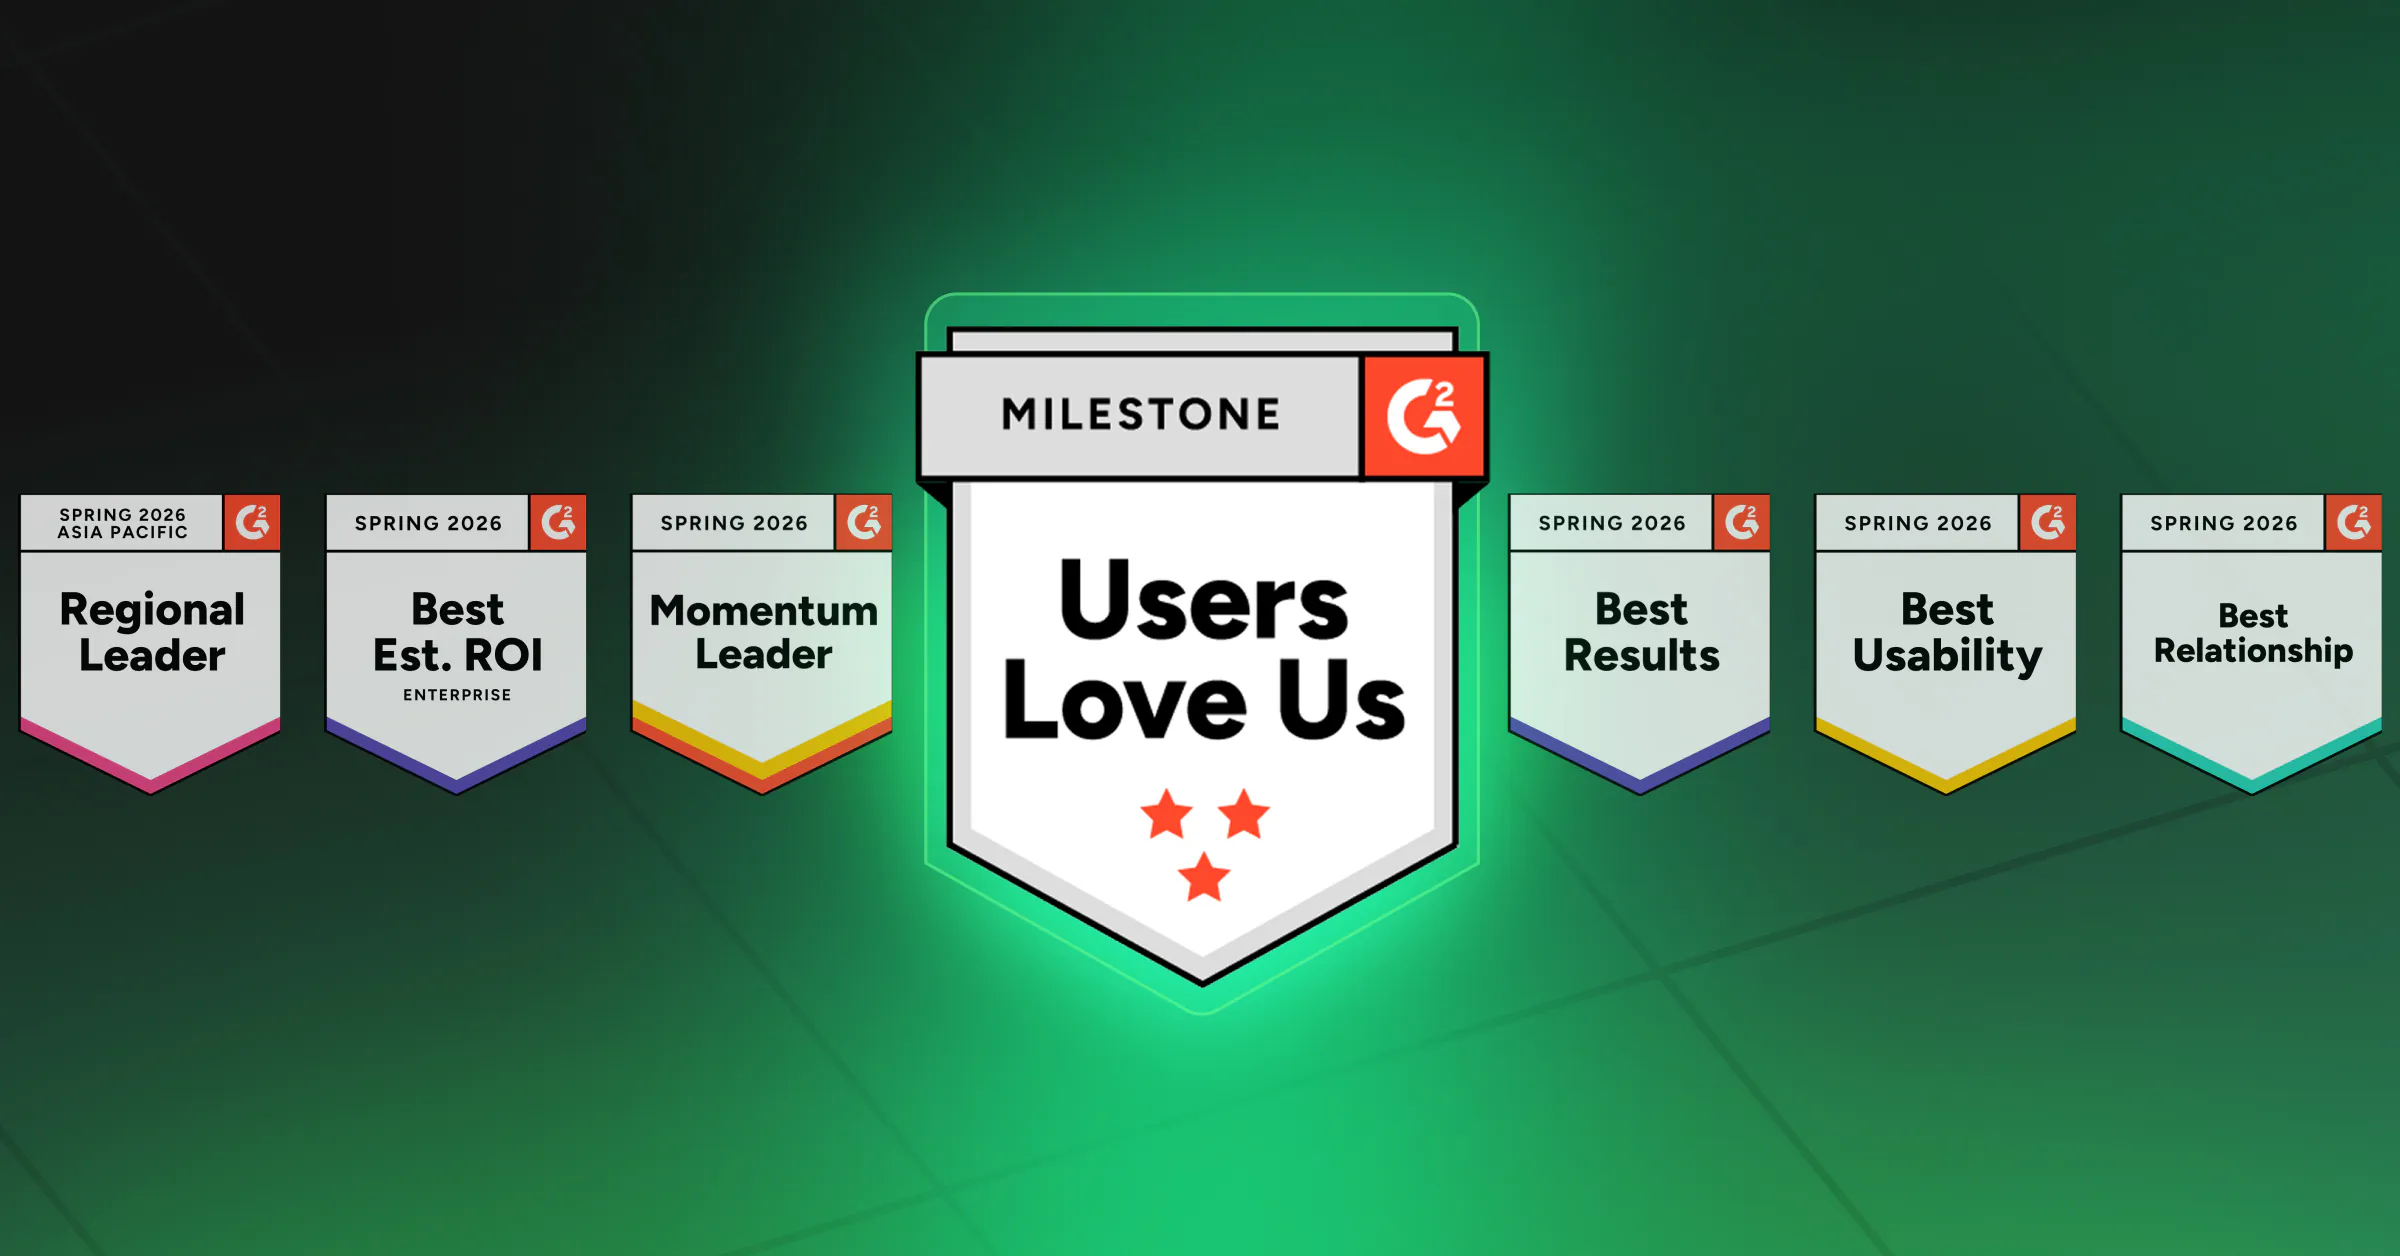
We’re proud to announce that Coralogix has earned 196 badges across 15 categories in the G2 Spring 2026 Reports, our strongest G2 performance to date. Placing in 369 reports, this represents a significant leap from Spring 2025, when we placed in 318 reports and earned 141 badges.
These results are a direct reflection of the trust our customers place in Coralogix and their willingness to share honest feedback on the world’s largest software review platform.
What Are the G2 Awards?
G2 is the world’s largest and most trusted B2B software marketplace, with more than 90 million buyers annually using peer reviews to make smarter purchasing decisions. Every quarter, G2 publishes thousands of reports covering tens of thousands of software products and awards badges only to top performers based on verified user reviews and satisfaction data.
Earning a G2 badge, especially a Leader or Momentum Leader designation, signals that real users consistently rank your product at the top of its category. These aren’t analyst opinions or sponsored rankings. They’re the voice of actual practitioners: engineers, DevOps teams, security analysts, and platform architects who rely on these tools every day.
For buyers evaluating observability and security platforms, G2 badges are a meaningful signal of product quality, customer satisfaction, and market momentum.
Coralogix Spring 2026: 196 Badges, 15 Categories, 369 Reports
Here’s the full breakdown of Coralogix’s Spring 2026 G2 performance:
| Category | Badges |
| Log Analysis | 24 – Leader | Momentum Leader |
| Application Performance Monitoring (APM) | 20 – Leader | Momentum Leader |
| DevOps | 20 – Leader |
| Cloud Infrastructure Monitoring | 22 – Leader | Momentum Leader |
| Container Monitoring | 16 – Leader | Momentum Leader |
| IT Alerting | 16 – Leader | Momentum Leader |
| SIEM | 15 – Leader | Momentum Leader |
| Network Monitoring | 15 – Leader | Momentum Leader |
| Cloud Security Monitoring and Analytics | 14 – Momentum Leader |
| Enterprise Monitoring | 11 – Momentum Leader |
| AIOps Platform | 6 – Momentum Leader |
| Network Traffic Analysis | 8 – Momentum Leader |
| Cloud Security | 4 – Leader Badge |
| Observability Software | 4 – Leader | Momentum Leader |
| System Security | 1 – Leader Badge |
| Total | 196 |
Compared to Spring 2025, where Coralogix earned 141 badges across 318 reports, this represents a 39% increase in badges and a 16% increase in report placements year-over-year.
What This Means Across Our Core Categories
Log Analysis: 24 Badges
Log Analysis remains one of Coralogix’s strongest categories on G2. Our log analytics platform continues to earn recognition for its speed, flexibility, and the unique way we handle data across hot, warm, and frozen storage tiers, giving teams infinite retention without infinite cost, with data stored in their own cloud object storage. Coralogix has consistently been recognized as a G2 Momentum Leader in this space, ranking above Datadog, Splunk, New Relic, and Sumo Logic.
Application Performance Monitoring: 20 Badges
With 20 badges in APM, Coralogix continues to gain recognition as a leading alternative to legacy APM tools. Our APM capabilities, including distributed tracing, service maps, continuous profiling, and SLO management, provide full-stack visibility without the cost overhead of per-host or per-trace pricing.
Cloud Infrastructure Monitoring: 22 Badges
Cloud Infra Monitoring is one of our highest badge-count categories this season. Our infrastructure monitoring gives teams real-time visibility into cloud-native environments, including AWS, Azure, and GCP, all within a unified observability experience.
DevOps: 20 Badges
Coralogix’s strong showing in the DevOps category reflects our deep integrations with CI/CD pipelines, Kubernetes environments, and developer-first workflows. Engineers choose Coralogix because it fits into how modern teams actually work, not the other way around.
SIEM: 15 Badges
Security teams are increasingly turning to Coralogix for SIEM capabilities. Our cloud-native SIEM combines high-volume log ingestion with AI-powered security analysis and anomaly detection, helping security operations teams cut through noise and respond faster.
Cloud Security Monitoring and Analytics: 14 Badges
With 14 badges in Cloud Security Monitoring and Analytics, Coralogix is earning recognition as a platform that serves both observability and security use cases without requiring separate tools or data silos.
Container Monitoring: 16 Badges
Container and Kubernetes environments generate enormous volumes of telemetry data. Coralogix’s Kubernetes monitoring solution earns high marks for its ability to ingest and analyze that data efficiently, at scale, with meaningful cost controls.
IT Alerting: 16 Badges
Coralogix’s alerting and case management capabilities help teams cut through alert fatigue. Users consistently highlight the accuracy and configurability of our alerting engine as a differentiator.
AIOps Platform: 6 Badges
As AI-driven operations become the new standard, Coralogix is building capabilities that help teams use AI to detect anomalies, correlate signals, and automate responses, reducing MTTR.
Why Customers Choose Coralogix
G2 badges are earned through reviews, and those reviews consistently highlight a few key themes:
Cost-efficiency at scale. Coralogix’s unique data pipeline model, which processes and enriches data before indexing, helps teams dramatically reduce storage and query costs without sacrificing observability depth. We consistently outperform competitors on G2’s Satisfaction scoring.
Unified platform. Rather than stitching together separate tools for logs, metrics, traces, and security, Coralogix delivers all of these from a single platform. Users don’t have to context-switch between systems or reconcile data from different sources.
Outstanding support. Across categories, our G2 reviews cite Coralogix’s customer support team as a standout differentiator: responsive, knowledgeable, and genuinely invested in customer outcomes.
Innovation velocity. From the DataPrime query engine to AI observability and our Autonomous Observability Agent, Olly, Coralogix continues to invest heavily in capabilities that keep pace with how modern engineering and security teams operate.
A Note of Thanks to Our Customers
Every badge Coralogix earns on G2 starts with a customer taking time to share their honest experience. Real reviews with genuine feedback from practitioners who use Coralogix in production, every day.
To everyone who has reviewed Coralogix on G2: thank you. Your feedback shapes our roadmap, validates our direction, and helps other teams find a platform they can trust.
We earned the G2 “Users Love Us” badge again this season, a recognition reserved for vendors with consistently high satisfaction scores, and it means more to us than any analyst ranking.
See What Our Customers Are Saying
If you’re evaluating observability or security platforms, we encourage you to read our G2 reviews directly from the engineers and security teams who use Coralogix in production.
And if you’re ready to see the platform for yourself, schedule a demo with one of our observability experts today.