What are AWS Log Insights and How You Can Use Them
Within this blog post, we’re going to take a look at AWS Log Insights and cover some of the topics that you will find useful around…

The key challenge with modern visibility on clouds like AWS is that data originates from various sources across every layer of the application stack, is varied in format, frequency, and importance and all of it needs to be monitored in real-time by the appropriate roles in an organization. An AWS monitoring solution, therefore, becomes essential when scaling a product and organization.
To achieve this kind of end-to-end visibility requires a conscious effort to centralize all the disparate AWS monitoring data irrespective of their source of origin. The focus of this guide is centralizing logs, events, and metrics for cloud-native applications running on Amazon Web Services (AWS).
AWS has by far, the most comprehensive suite of cloud services, numbering 175 services as of 2020. Every AWS service churns out its own set of metrics, events, and logs. Additionally, there are performance metrics produced by the applications running in AWS. AWS provides CloudWatch for centralizing this data. Being a native-AWS service, there is hardly any setup required and CloudWatch automatically records some default monitoring data from many AWS services as soon as they are activated.
To get beyond the basic functionality offered by CloudWatch, AWS users resort to other methods to gain end-to-end visibility in AWS. One option is to push all monitoring data from CloudWatch to AWS Elasticsearch which has a more capable data analytics engine. This is a step up from the default CloudWatch experience, but still puts the burden of having to manage Elasticsearch on your shoulders.
A better option is to use an AWS Partner Network offering like Coralogix to take the management load off your team and still give them all the benefits of an end-to-end monitoring experience for AWS.
There are numerous types of logs in AWS, and the more applications and services you run in AWS, the more complex your logging needs are bound to be.
Logs originate from two primary sources – applications running on AWS services, and the AWS services themselves. CloudWatch is the primary log collector that collects logs and metrics about application performance, and service utilization. Separately, AWS stores all API calls made to AWS services inside CloudTrail.
Once collected in CloudWatch and CloudTrail, the data is ready for analysis and setting up alerts. From here, they can be archived in AWS S3, or sent to a separate logging and monitoring solution.
CloudWatch offers basic log management capabilities such as alerting, actions, log analysis, and querying. CloudWatch can generate custom metrics from log data you specify. It’s grown into an important component in the AWS ecosystem and offers many basic log and metric management capabilities.
To gain a holistic view of your AWS applications and resources, you’ll need not just application and service-level logs, but API-level logs as well. This is handled by AWS CloudTrail.
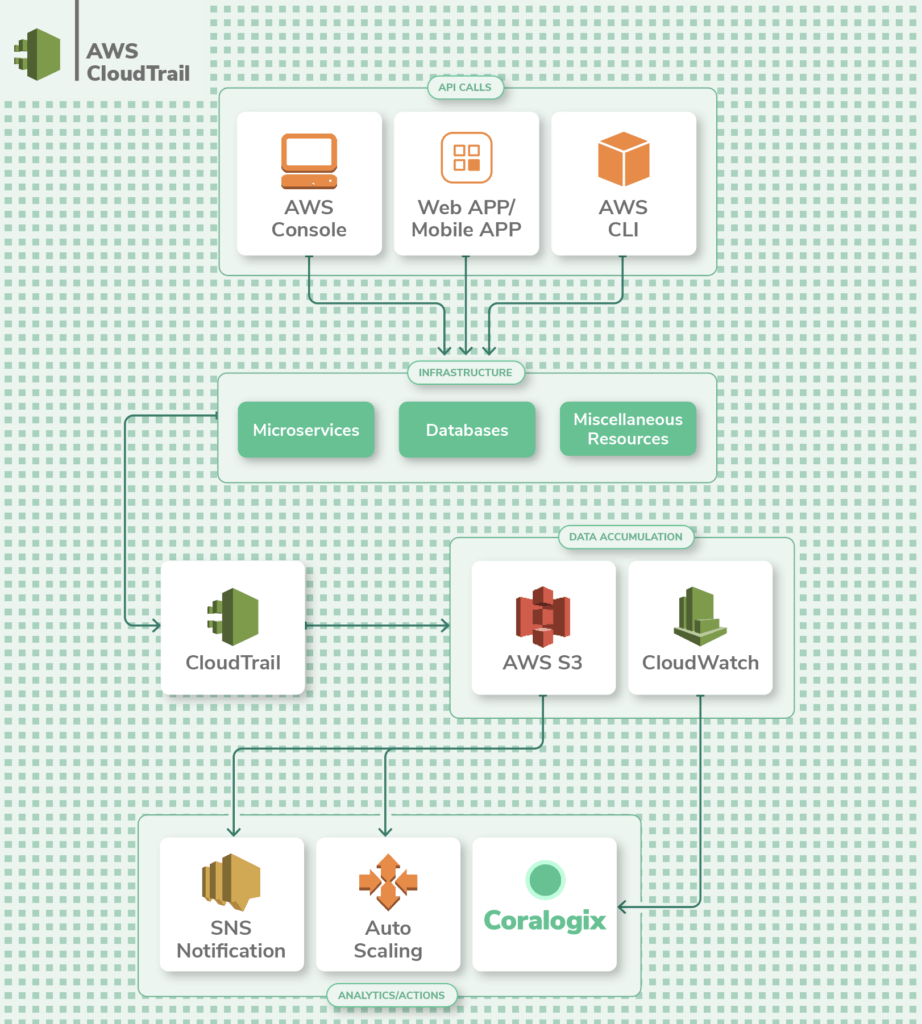
CloudTrail tracks actions taken by a user, role, or an AWS service whether taken through the AWS console or API operations. In contrast to on-premise infrastructure where something as important as network flow monitoring (Netflow logs) could take weeks or months to get off the ground, AWS has the ability to track flow logs with a few clicks at a relatively low cost.
Some basic tracking is enabled by default with AWS CloudWatch and CloudTrail, but you should review the configuration and use this guide to apply the most important best practices.
Most services publish CloudTrail events but only save the most recent events from the past 90 days. In order to save data long-term, you’ll need to create a Trail and enable continuous delivery to an S3 bucket. By default, when you create a Trail, it captures data from all regions.
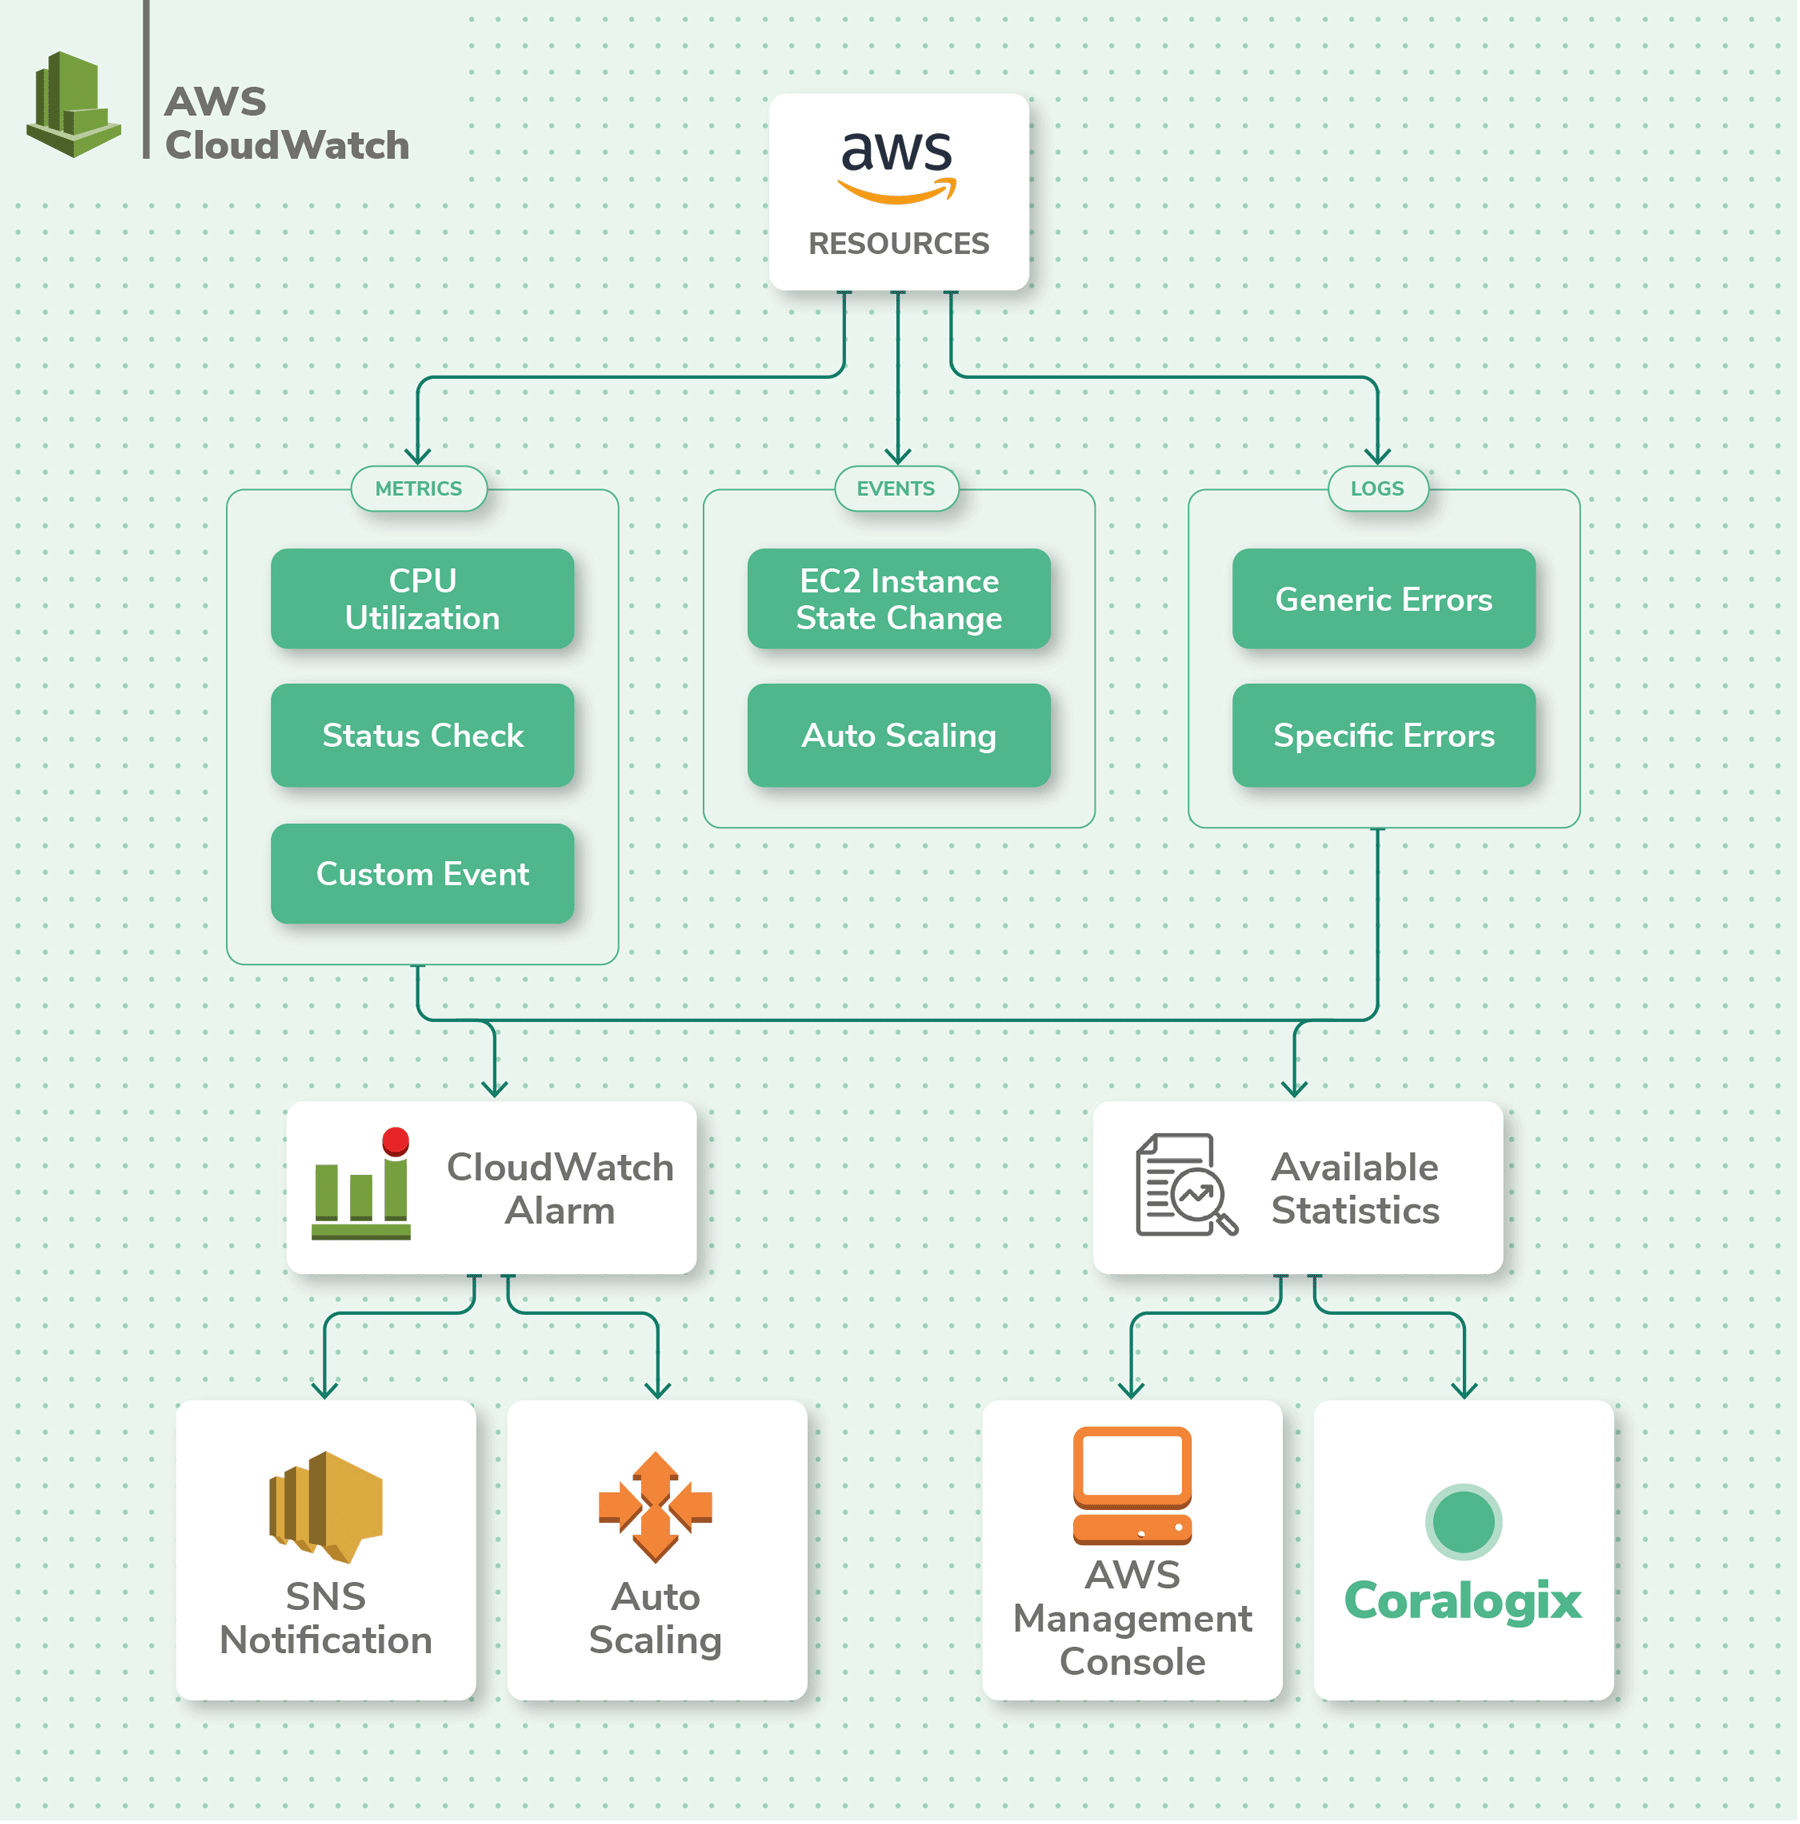
Monitoring with AWS CloudWatch can be confusing if you’re not familiar with the different types of data available to you. There are three types of AWS log monitoring data in CloudWatch – Metrics, events, and logs.
Logs can have more than one piece of data in them, whereas metrics are specifically focused on just the one data point they measure. Events are generated whenever something changes in an AWS service. CloudWatch Subscriptions allow other AWS services like Kinesis and Lambda to listen to a real-time feed of CloudWatch Logs for further processing or to ship it to another service like Coralogix. Further, you can use subscription filters to define which logs get sent to specific AWS resources.
Metrics are numeric data points that report on one specific aspect of the system’s performance. By default, metrics are recorded in 1-minute intervals – this is called resolution. A finer resolution of 1-second intervals is available in CloudWatch by upgrading to paid custom metrics.
Events are generated when a change is made to an AWS service in near real-time, and they are saved as JSON objects. Examples of an event are when an EC2 instance is created, or an AWS API is accessed. These events are recorded by CloudWatch and can be acted upon. For example, you could set up an event rule to notify an AWS SNS topic whenever an EC2 instance is terminated.
Here is a list of the most vital AWS services and what you should consider when setting up logging with CloudWatch and CloudTrail. Below, you’ll also find a table with a more complete list of AWS services.
AWS EC2 logs is the most popular and widely-used AWS service. It offers cloud-based compute instances to run applications on. The instances come in Linux and Windows flavors, and of various compute capacities.
To start collecting logs from EC2 you need to configure the appropriate IAM policies and roles. Then, you’ll need to install the CloudWatch agent using a single-line command from the AWS CLI. Once you configure the agent, logs start streaming from the EC2 instances and are sent to CloudWatch for an AWS log analysis.
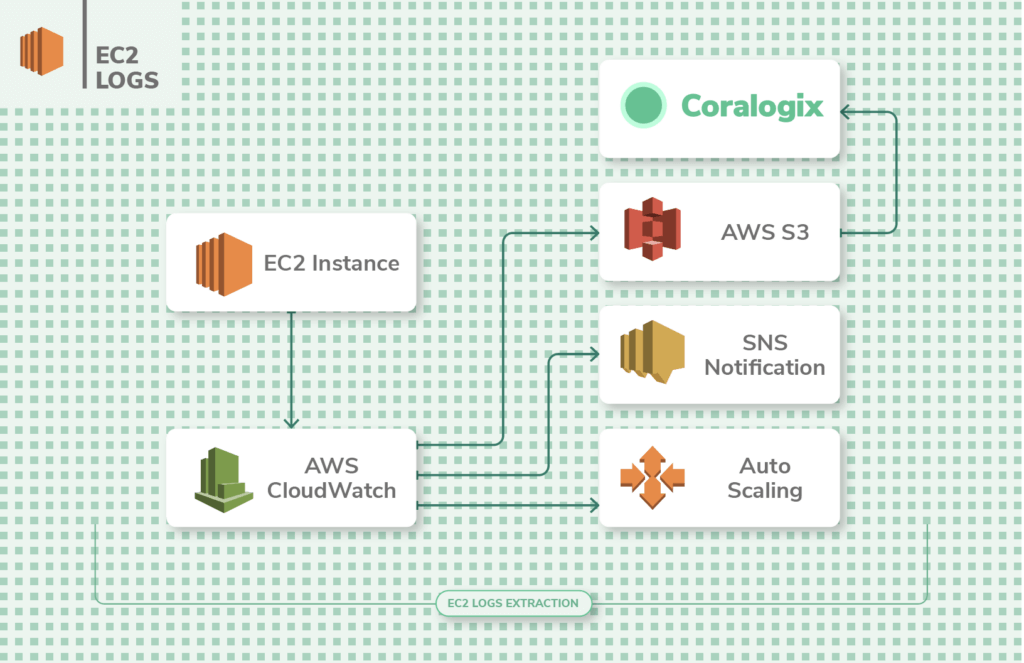
You’ll want to analyze the EC2 error logs when troubleshooting issues with instances. The logs are sent to CloudWatch for analysis and can be stored in S3 buckets for archiving. The key metrics that are logged from EC2 instances are disk I/O, network I/O, and CPU utilization.
How to: Integrate ECS / EC2 Logs with Coralogix
If the default shared EC2 instances of AWS aren’t adequate for your application’s security and performance needs, AWS VPC is a service that enables you to have a private EC2 experience where you control the network. This essentially gives you your own private space in the AWS cloud where only your apps run, and yet, you don’t have to maintain the underlying EC2 instances, as AWS does the maintenance for you. Once VPC is set up, it is essential to monitor the traffic flow to and from the network interfaces (Ingress & egress).
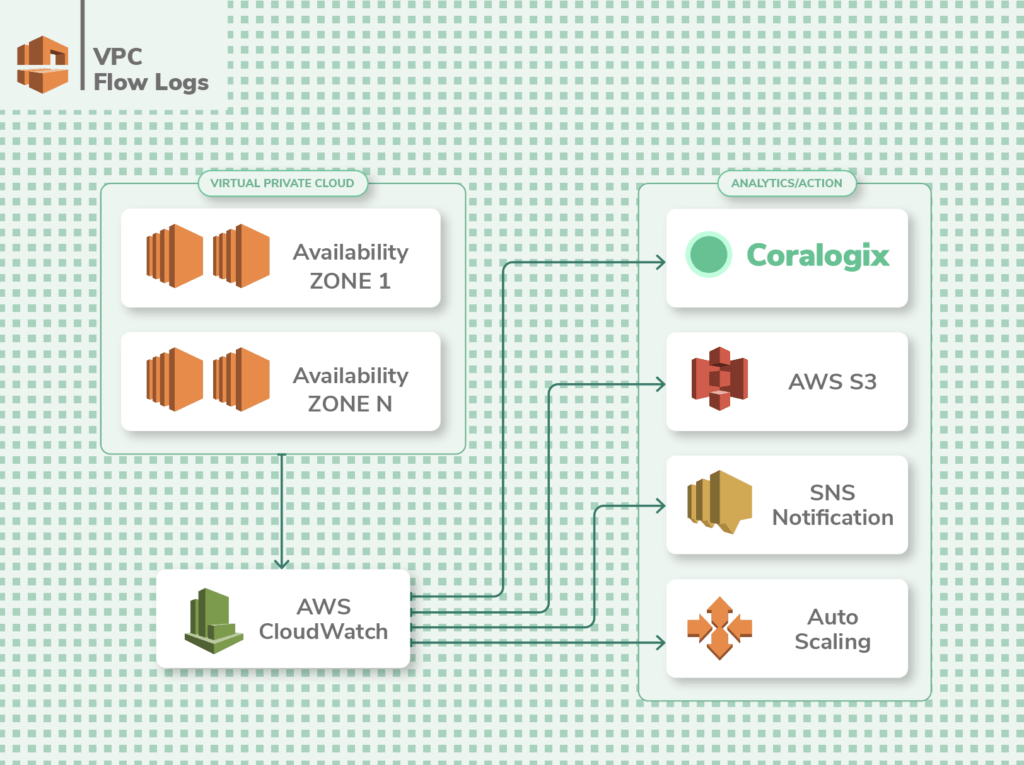
VPC Flow Logs contain information about the traffic passing through your application at any given time. It lists the requests that were allowed or denied according to your ACL (access control list) rules. It also has information about the IP addresses, and ports for each request, the number of packets and bytes sent, and timestamps for each request.
This information brings deep visibility into your VPC-based applications. Using these logs you can optimize your existing ACL rules, and make exceptions to allow or reject certain types of requests.
You can also set alarms to be notified of suspicious requests. However, you can’t tag Flow Logs. Also, once created, you can’t change the config for a Flow Log, you’ll need to delete it and create a new one. And finally, you can publish and store Flow Logs to CloudWatch Logs or S3 at additional cost.
How to: Integrate VPC flow logs with Coralogix
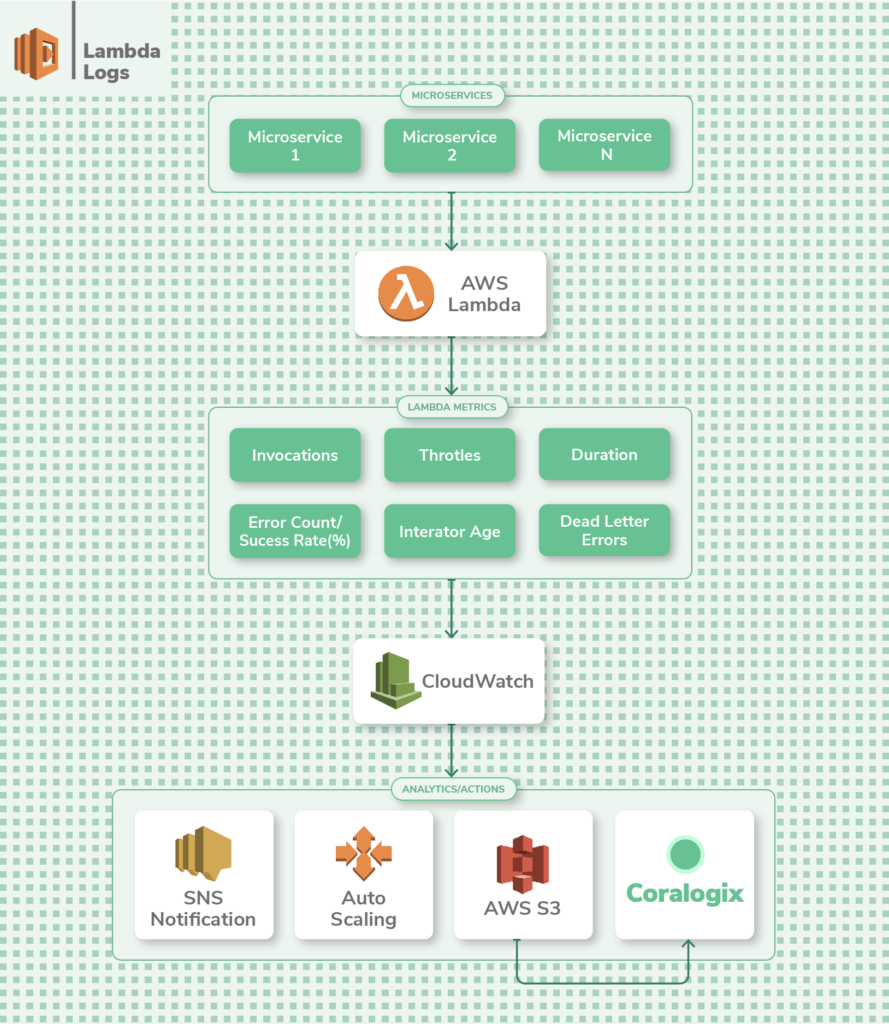
Lambda is the serverless computing solution from AWS that lets you run applications without having to create or maintain any underlying instances. It excels for short-term jobs that require compute capacity in short bursts.
The CloudWatch dashboard provides you with vital logs and metrics such as the number of invocations of a function, duration of an invocation, errors, and throttles. This is great for gaining an overview of your application’s health.
To drill deeper into the performance of your Lambda functions, you’ll need to insert logging statements within the code of each function. Remember to assign the appropriate execution role so that the Lambda function has permission to publish logs to CloudWatch.
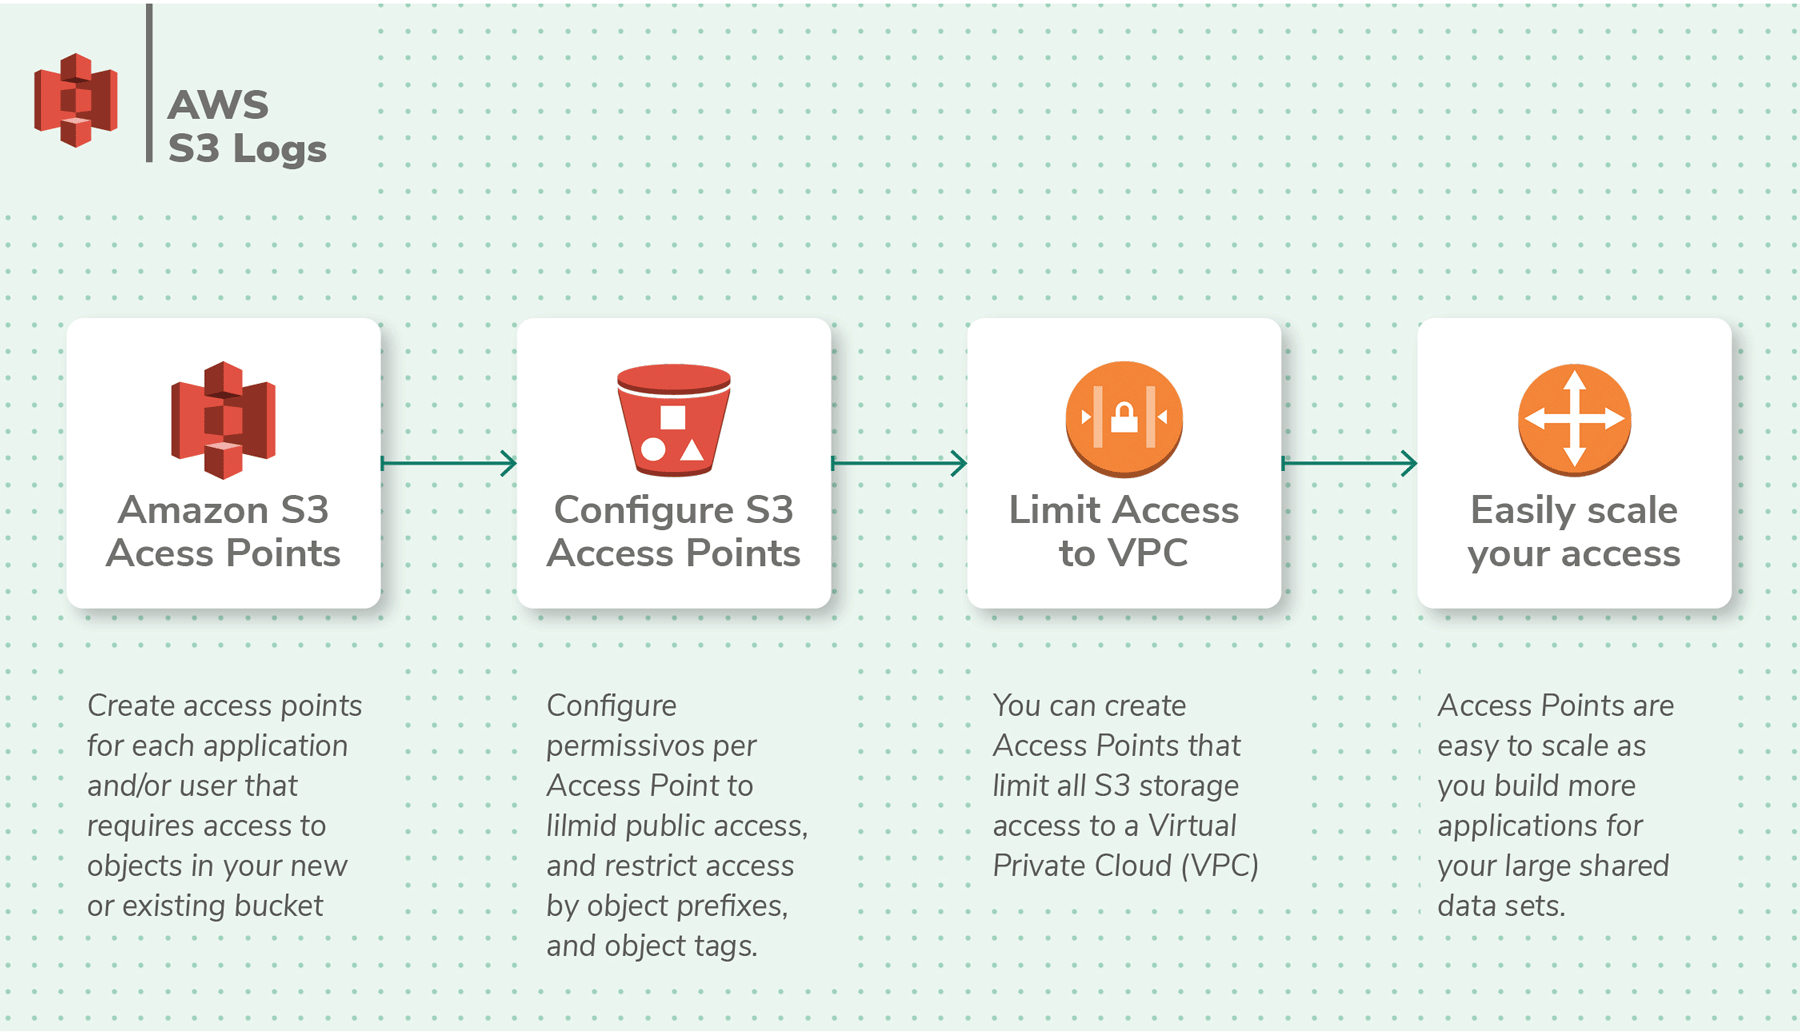
AWS S3 is the first service that AWS started with and it plays a vital role is storing data, including logs, from various other AWS services. You need visibility into S3 performance itself, but arguably the most important type of S3 logs are the server access logs.
The logs provide visibility into each call made to an S3 bucket from other AWS services or applications. It includes details like the source of the request, name of the S3 bucket, request time, error, and response codes. By default, server access logs are disabled and need to be enabled.
Going deeper, object-level logs that are tracked by CloudTrail monitor API calls to S3 and the changes they make to the actual objects stored within S3. As with the server access logs, object-level logs need to be manually setup.
The easiest way to get started with S3 logs is through the S3 management console to set up a destination bucket to send the logs to.
How to: Integrate S3 logs with Coralogix
AWS Elastic Load Balancer (ELB), as the name suggests, is a load balancer service that routes traffic across various AWS services. It is used to handle spikes in traffic.
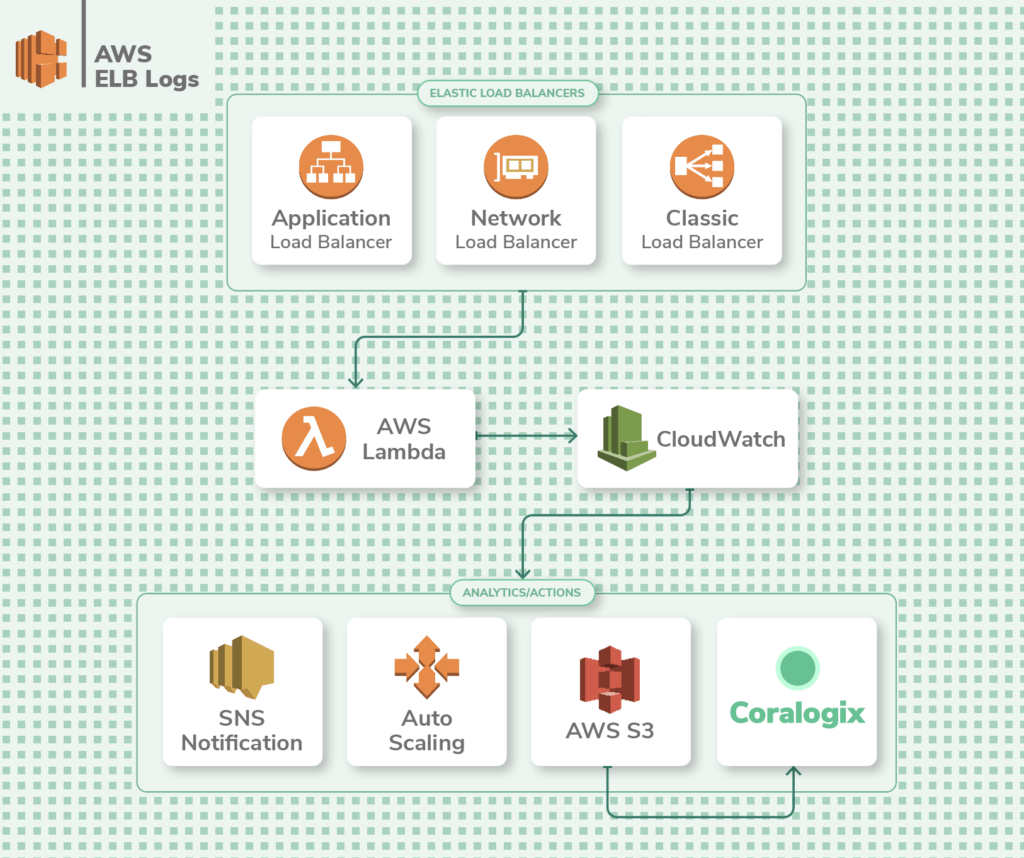
Being a networking management service, it’s vital to monitor ELB to gain insight into application performance. ELB generates logs such as the source of requests, latency, timestamps, and errors. These are called access logs and can be stored in an S3 bucket. They’re not enabled by default and need to be configured. The only additional cost will be the S3 storage fees.
How to: Integrate ELB logs with Coralogix
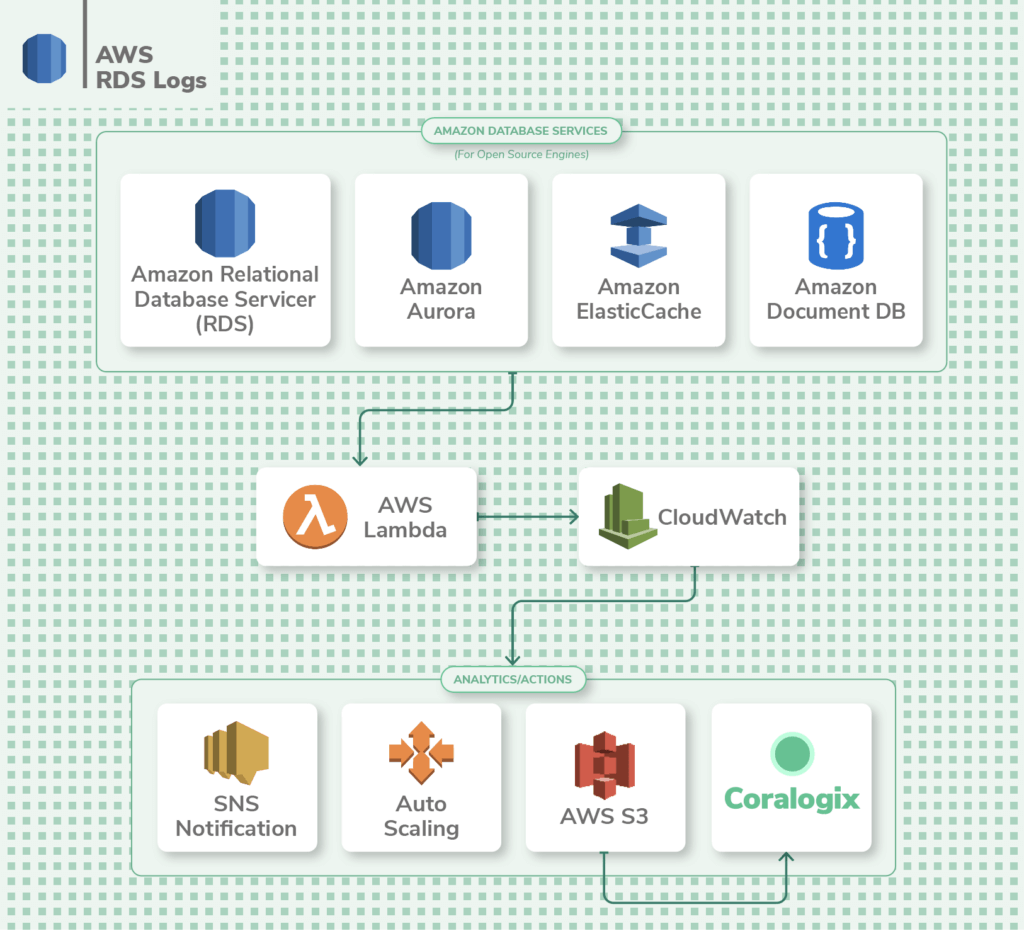
AWS Relational Database Service (RDS) is a managed database service that makes it easy to scale and operate relational databases. You can run a variety of database engines on RDS such as MariaDB, Microsoft SQL Server, MySQL, Oracle database, and PostgreSQL database.
You can view database logs from within the RDS console or publish logs to CloudWatch for further analysis. By default, error logs are generated in RDS, but you’ll need to configure additional logs like slow query, audit, and general logs for optimization and troubleshooting.
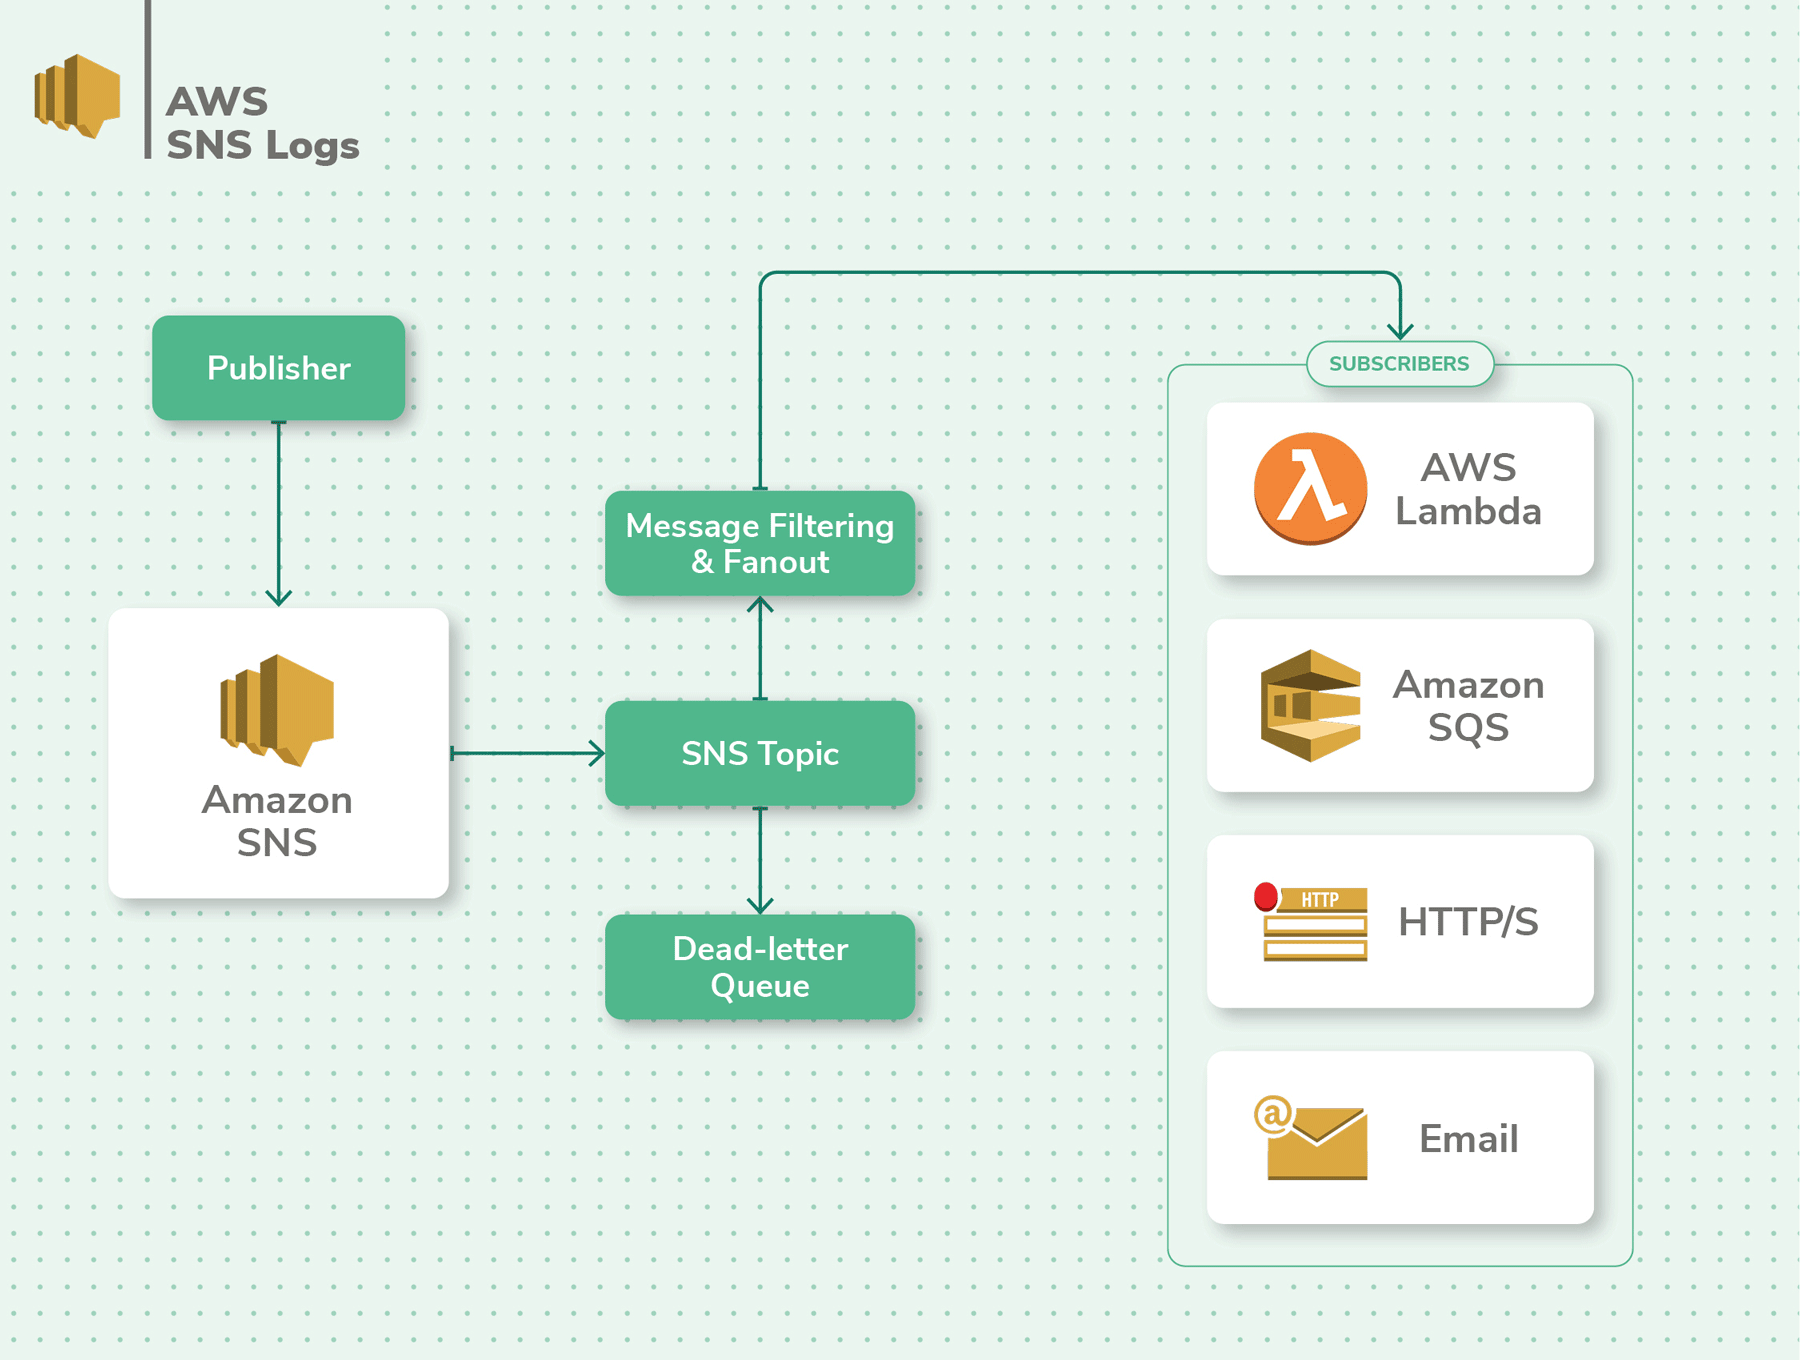
AWS SNS is a pub/sub messaging service to send out messages to other AWS services or even end-users via SMS or email. These messages can be used by services like Lambda as triggers to begin parallel execution of a job. SNS makes it easier to manage communication internally between distributed microservice applications.
When monitoring SNS topics, you will want to monitor the volume of messages, failed notifications, the reasons for their failures, messages that are filtered out, and the volume of SMS’s sent. All of these metrics are conveniently available within CloudWatch. Additionally, CloudTrail stores information about the API calls made to SNS. In CloudTrail, you’ll need to configure a trail to track all SNS events from all regions in an S3 bucket.
Once you’ve decided which services you’d like to monitor using CloudWatch and CloudTrail, the next step is to analyze these logs to glean meaningful and actionable insights.
Collecting
As with any logging practice, the first step to AWS log analytics is to collect logs from various sources. To start collecting logs AWS has a unified logging agent that collects both logs and advanced metrics. There are many ways to install the agent on your EC2 instances and other AWS services depending on where your instances are running. You’ll also need to configure the awslogs.conf file that specifies the log group, log stream, time zone, and more. Some AWS services can send logs directly to S3, but CloudWatch “Deliver Logs” costs would still apply.
Parsing unstructured logs is critical in order to extract the full potential value of the data and make it ready for analysis. Parsing enables us to get statistics on log message parameter values, conduct faceted searches and filter logs by specific fields and values.
In CloudWatch, parsing is supported at the query level only, but the underlying log data cannot be changed. For full parsing and enriching capabilities, you’ll need a 3rd party tool like Coralogix or forward the logs to Logstash (with the CloudWatch input plugin) for parsing with Grok and then feeding that into AWS Elasticsearch.
Querying is likely the most common operational task performed on log data. The right searching capabilities enable you to analyze logs to find insights easier.
For AWS logs, we have several options to query the data:
CloudWatch: Includes aggregations, filters, regular expressions, and auto-discovered JSON fields
Awslogs: This is a simple command-line tool for querying groups, streams, and events from Amazon CloudWatch logs. It allows you to query across log groups and streams with log aggregation and offers more user-friendly features like human-friendly time filtering.
AWS Elasticsearch: AWS’ hosted Elasticsearch service
Coralogix: A fully managed Elasticsearch service with advanced search, filtering, and automatic log clustering capabilities.
Dashboards help you track the most important metrics so you’re always aware of the state of the system. AWS CloudWatch comes with multiple visualization options that you can make use of. You can create dashboards from where you can monitor metrics that are derived from your logs. Simply create a log query in CloudWatch and add it to a dashboard. For example, you can calculate statistics like percentiles and aggregations. You can then visualize the data in the form of a line chart, a stacked chart, or a numerical metric. Taking things further, you can add alarms to widgets for quick and simple monitoring.
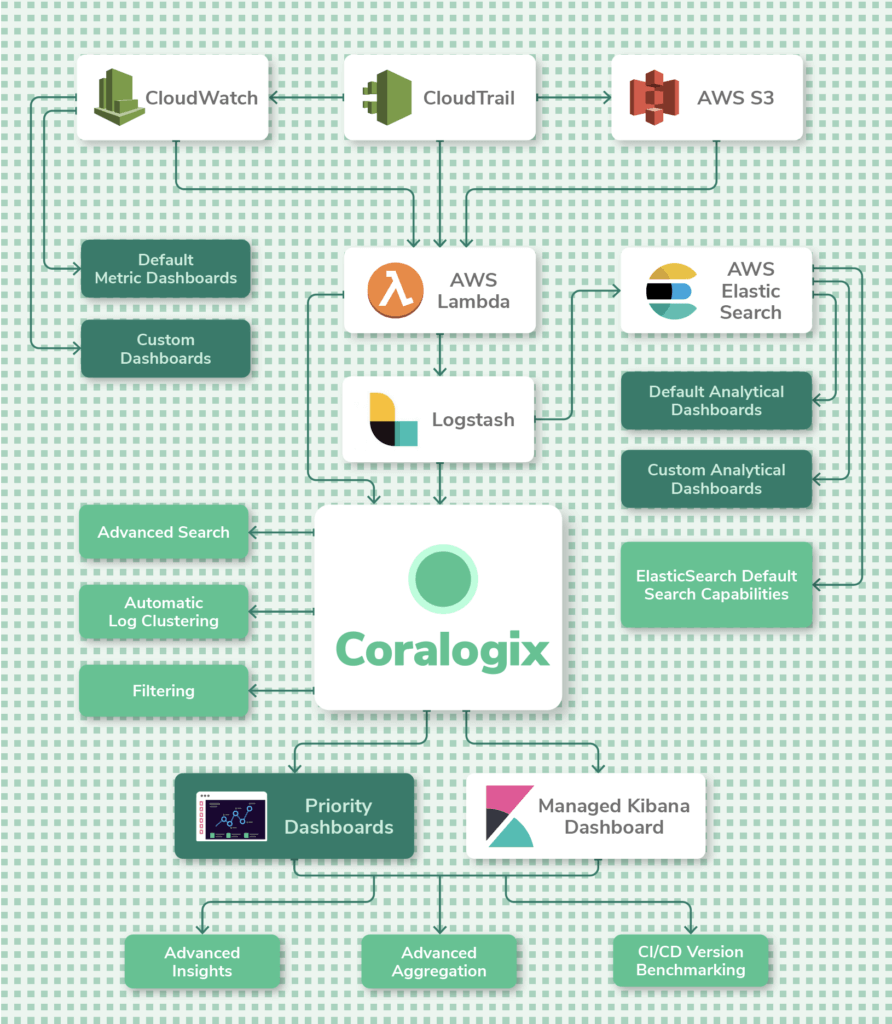
When it comes to monitoring an entire infrastructure, Coralogix provides fully managed Kibana access as well as proprietary dashboards that provide advanced insights.
When things go wrong, alerts are essential for reducing response and recovery times. CloudWatch offers the ability to set alarms or alerts on any widget in a dashboard. You can configure CloudWatch Logs to set off an alarm whenever a metric reaches a defined threshold.
Alarms have configurable resolutions between 1-60 second intervals so you can decide how often to run the query for each metric. CloudWatch also offers the ability to trigger automated actions across AWS services based on a triggered alarm to create sophisticated workflows.
Apart from CloudWatch, within AWS you setup Lambdas to trigger alerts as well. Using scheduled event triggers in AWS Lambda, you can run a query and then publish the results to an Amazon Simple Notification Service (SNS) topic which can then trigger an email or initiate an automated action.
Users that need more advanced monitoring and alerting capabilities will need to integrate a tool like Coralogix. Examples include filtering by log metadata, grouping by particular fields, limiting triggering to specific times, customizing alert messaging and automating alerting with ML-assisted anomaly detection. The Coralogix integration with CloudWatch allows AWS customers to aggregate all of their log data combined with data from other sources across hybrid and multi-cloud environments.
Users may need to export logs from CloudWatch for archiving, sharing, or to analyze the data further with advanced 3rd party tools. AWS provides several different ways of getting your log data to the right source.
While day-to-day logging operations is what takes more time in CloudWatch and CloudTrail, frequently, you’ll need to make important decisions about how to manage your logs. This includes securing access to log data, retaining them for use in the future, and keeping costs under control.
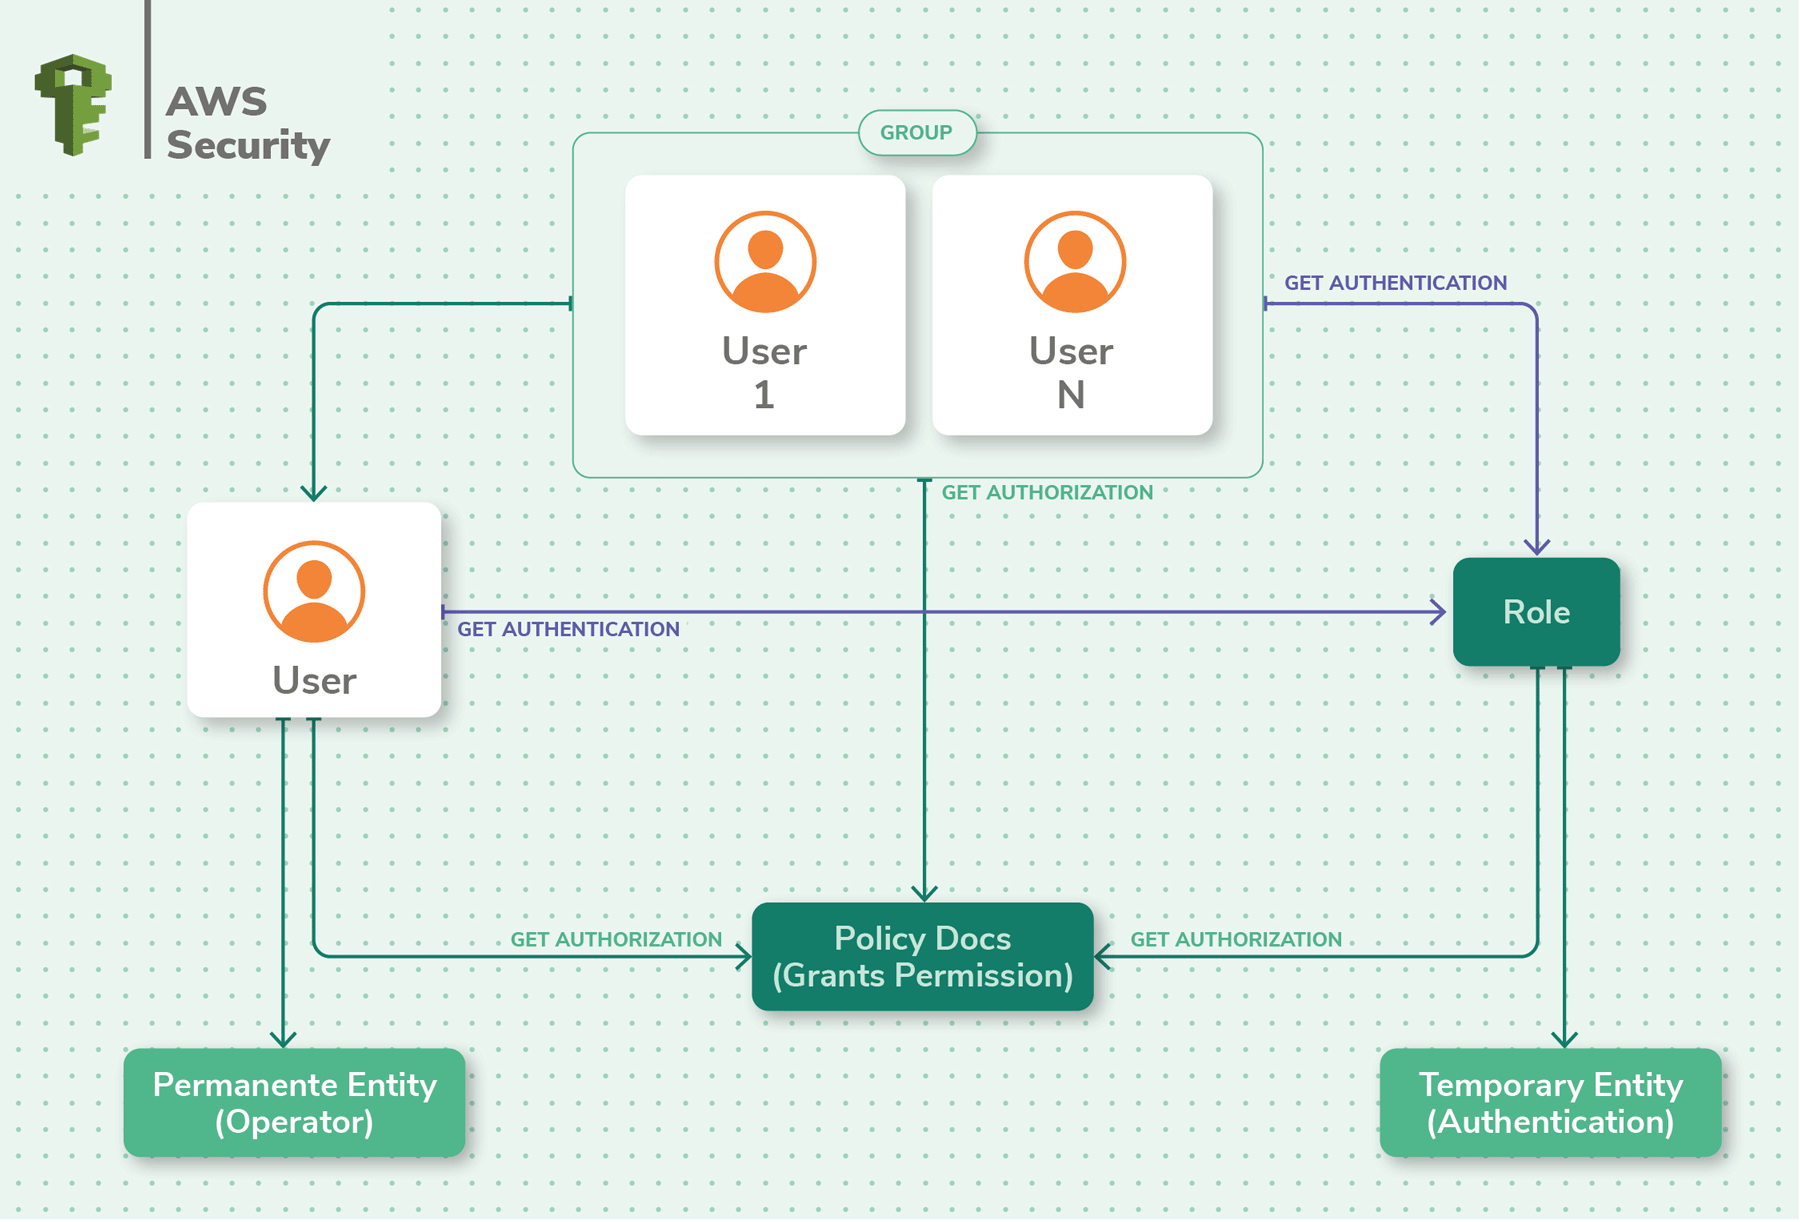
AWS has baked in security best practices into its platform. For example, log data is encrypted at rest and during transfer. The IAM service enables you to control access to log data and give granular access to users and other applications. Further, CloudTrail is great for recording all activity related to logs for auditing and compliance purposes.
While AWS has done its part, according to the ‘shared responsibility’ model, you’ll need to do your part in securing log data in AWS. For example, in AWS S3 access logs, you can enable “MFA delete” (Multi-factor authentication delete) to protect from accidental deletions or sabotage of log data. Using Cloudwatch Events, you can automatically detect when an instance is being shut down and offload log data before the shutdown is complete.
Log retention is critical for operational and compliance purposes. Sometimes a data breach could be discovered years after it actually occurred. In cases where historical data is necessary, you need to have your logs retained and AWS CloudWatch lets you retain log data for as long as you like.
When new CloudWatch Log Groups are automatically generated (e.g. when new Lambda Function is created) it will always default to “Never Expire” so this is something that needs attention.
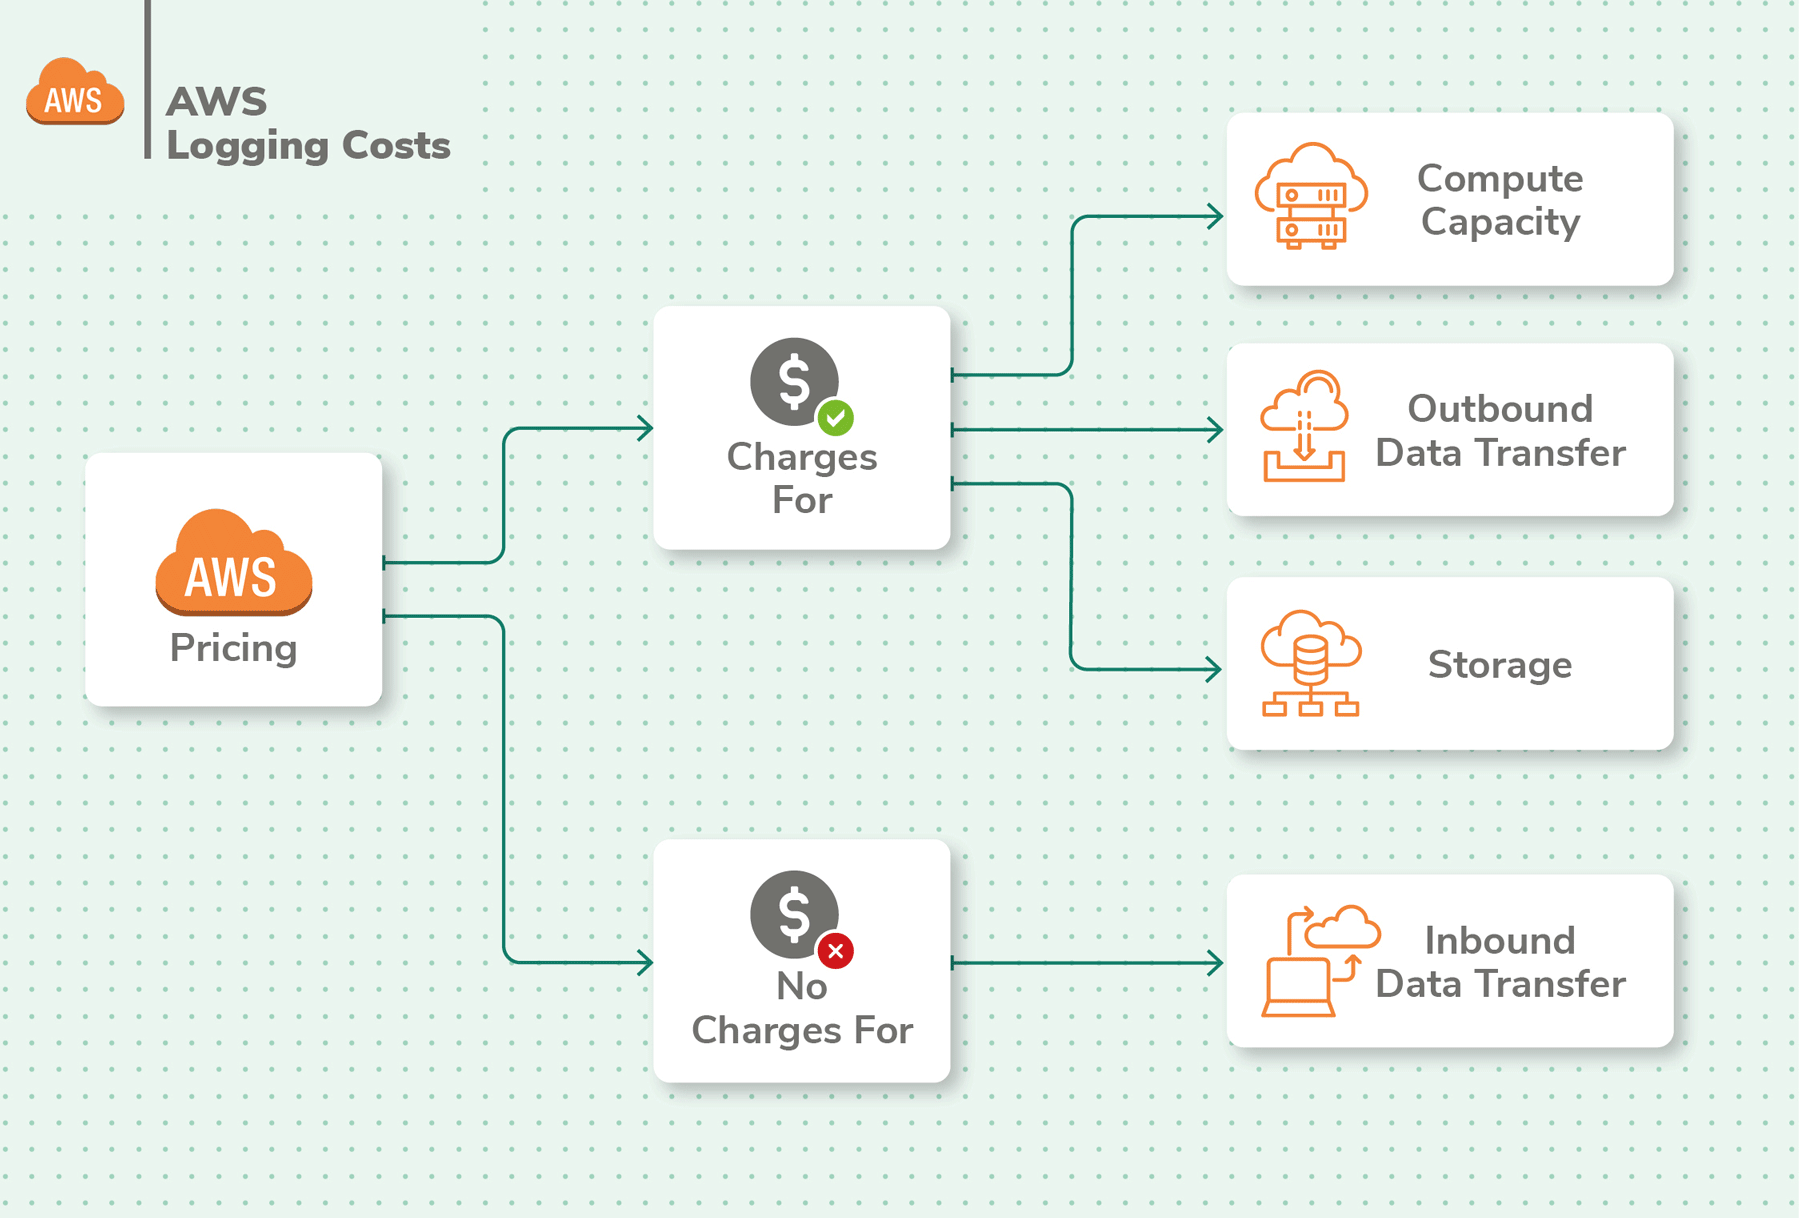
Cost is an important consideration when it comes to logging in the AWS cloud. AWS has a Free Tier with basic logging, and storage space of 5GB of ingested log data and 5GB of archived data. Most applications’ logging needs will scale beyond this tier. If left unchecked, costs can quickly shoot up and result in bill shock at the end of the month.
The costs for logging in AWS vary based on the region you choose. You also need to factor in metrics, logs, events, alerts, dashboards, retention, archiving, data transfer and more to arrive at your final cost with AWS CloudWatch. Given the various options to choose from, pricing can be complex with AWS CloudWatch.
Costs also matter for metrics. You get only 10 detailed monitoring metrics in the free tier, limiting your ability to do in-depth monitoring. Additionally, only 3 dashboards and 10 alarms are included in the free tier. Custom events have additional costs as well.
Logs published by AWS services are priced like custom logs. If you store a lot of logs in AWS, there’s a discounted vended log pricing which is subject to volume discounts, but currently, this only includes VPC and Route 53 logs.
In order to have better visibility into your CloudWatch costs, you can tag Log Groups, through the API (it isn’t currently possible via the console).
Logs are generated regionally by AWS services so the best practice is to funnel all regional logs into one region in order to analyze the data across regions. There are three options to centralize your AWS logs insights.
Use CloudWatch for your centralized AWS log collection and then push them to a log analysis solution via Lambda or Kinesis.
Send all logs directly to S3 and further process them with Lambda functions.
Configure agents like Beats on EC2 instances and FunctionBeat on Lambdas to push logs to a logging solution.
Once gathered together in the same region within AWS, the logs can be pushed to a more powerful logging solution like AWS Elasticsearch or an AWS partner service such as Coralogix.
Before embarking on a self-managed solution such as the ELK stack, consider the full costs and complexity of each approach. While AWS Elasticsearch is easier in terms of management, you’ll still be responsible for maintaining and scaling its usage.
There are three major options when deciding how to analyze your AWS logs centrally – AWS CloudWatch, AWS Elasticsearch, and an AWS partner solution like Coralogix. Let’s compare these options in the following table.
| Features | CloudWatch | AWS Elasticsearch | Coralogix |
|---|---|---|---|
| Service | Managed | Self-managed | Fully-Mangged |
| Error Anomalies | No | No | ML, Automated |
| Volume Anomalies | No | No | ML, Automated |
| Instant Log Clustering | No | No | Yes |
| Dashboards | Basic | Self-managed Kibana | Managed Kibana, Proprietary Custom Dashboards |
| Alerts | Basic, cost per metric | Basic | Advanced rule configuration options |
| Parsing | Automatic JSON field detection Parsing unstructured data is only possible while querying | Self-managed Logstash | Automatic JSON field detection Custom parsing rules |
| Querying | Results are limited to max 10,000 logs Maximum of 4 concurrent CloudWatch queries Queries cost $0.005 per GB of data scanned (US East) | Unlimited, but can get slow if data is not organized well | Lightning fast performance Unlimited log results Unlimited queries at no additional cost |
| Ingest | Maximum batch size: 1 MB Maximum event size: 256KB | Multiple options for ingesting – Kinesis Data Firehost, Logstash, CloudWatch Logs. Can be difficult to convert and map data. | Simple data ingestion from AWS and non-AWS sources without limitations |
| Threat Detection | No | No | IP Enrichment |
| Live Tail | No | No | Yes |
| Pricing | Usage-based, can start small but grow big very quick Difficult to calculate various nuances with pricing. | Usage-based, can start small but grow big very quick. Need to factor in additional resource costs of setup and maintenance | Simple tier-based pricing with clearly-defined features, and few restrictions |
Coralogix is a cloud-based log analytics tool available via the AWS Marketplace for convenient billing and tighter integration. It improves on AWS CloudWatch in many ways and is an advanced logging solution for AWS. Here are the key advantages of Coralogix over CloudWatch:
Shipping logs from AWS to Coralogix is a breeze with two options. You can either set up a Lambda function to transfer logs from a Kinesis stream to Coralogix, or you can set up a Beats agent to listen in on logs and send them to Coralogix automatically. Once in Coralogix, you can leverage the powerful logging capabilities of the platform to glean insights into your logs, complete with dashboards, visualizations, and mature alerting.
Finally, here are the key takeaways that you should remember as you think ahead about your logging strategy:
| AWS Service | What to log | Where | Delay | How |
|---|---|---|---|---|
| CloudFormation | EC2 application bootstrapping logs | CloudWatch | 5 seconds by default, can be changed | In the CloudFormation template1) create a CloudWatch Logs configuration file (cfn-logs.conf) on the instance 2) download the awslogs package 3) start the awslogs daemon You can use a single CloudWatch Logs configuration file to use across multiple stacks |
| CloudFront | Access requests | S3 | Up to 24 hours | Select the S3 bucket where your CloudFront logs will be saved and configure the ACL (access control list) permissions for the bucket. |
| CloudTrail | Collect and monitor any AWS API call, complete audit trails of all AWS account activity such as security policy changes, new instances, console logins, etc | S3 | 15 minutes (default) | By default, CloudTrail logs are activated for all new accounts with 90-day retention. By default, logs saved per region (except for Global Service Events). Therefore, set up global logging to one bucket.Config: “Apply trail to all regions” To deliver log data to S3, create Trails in CloudTrail. Options include Encryption and Log Data Integrity Validation |
| CloudWatch Events | AWS API changes for various AWS services like EC2, Lambda, Kinesis streams and more | CloudWatch | Real-time | Create a rule that triggers whenever something happens, or an API call is made, or on a set schedule. |
| CodeBuild | API calls | CloudTrail | 15 minutes | Via CloudTrail |
| CodePipeline | API calls | CloudTrail | 15 minutes | Via CloudTrail |
| Config | Resource configurations and changes. You can validate resource compliance with a set of rules | CloudTrail SNS Topic S3 | 15 minutes | Use default “Managed Rules” or “Custom Rules” Setup by Console or CLI Option to aggregate data from multiple regions and accounts Open source rules |
| EC2 | Monitor disk I/O, network I/O, CPU utilization | CloudWatch Export to S3 | 5 minutes (default) 1 minute | Install and Configure the Unified Options to deliver to CloudWatch: 1) AWS CLI commands that are scheduled to deliver the logs in Cloudwatch 2) Custom code to deliver via CloudWatch SDK or API 3) Install Rsyslog (Linux) or NxLog (Windows) on EC2 to ship logs to 3rd party services like Coralogix 4) CloudWatch Agent (recommended) or EC2Config service running on the EC2 can push the logs Install Cloudwatch Agent on EC2 Grant permission to allow EC2 to create and write to CloudWatch Log Groups and Log Streams Edit the CloudWatch Log Agent’s configuration file to define the file path of the logs on the EC2 instance. Edit the CloudWatch Log Agent’s configuration file to choose a CloudWatch Group and Stream to ship the logs to Detailed Monitoring option Stream to AWS Elasticsearch or to a third-party solution like Coralogix via Lambda. |
| ECS | General operating system logs API actions with CloudTrail and ELK Docker and Amazon ECS container agent logs Docker container output Docker daemon events | /var/log/ecs folder CloudWatch | 5 seconds by default, can be changed | Install awslogs Log Driver to send to CloudWatch add a LogConfiguration property to each ContainerDefinition property in your ECS task definition. Create the log group, and specify the log group inside CloudWatch Logs, then specify an AWS region and a prefix to label the event stream. You can also enable ECS to auto-configure CloudWatch logs. Install the jq JSON query utility Update CloudWatch Logs agent configuration file Start CloudWatch agent Alternatively, install the json-file log driver. The log events are then retrieved via the Docker Remote API using a Logspout service to centralize and ship all logs to a destination like Logstash. If using Fargate, awslogs is the only supported logDriver |
| Elastic Load Balancer (ELB) | Access requestsChanges in availability and latency | S3 | 5 Minutes | Using the AWS Console enable access logs for ELB and select the S3 bucket where the logs should be saved. |
| Glacier | API calls | CloudTrail | 15 minutes | Via CloudTrail |
| GuardDuty | Cloudtrail Management Events API calls Request type, source, time and more | CloudTrail | 15 minutes | Enable a CloudTrail trail to log events in an S3 bucket |
| IAM | API calls | CloudTrail | 15 minutes | Via Cloudtrail |
| Inspector | API calls | CloudTrail | 15 minutes | Via Cloudtrail |
| Kinesis Data Firehose | Error logs for streams | CloudWatch Logs | 5 seconds by default, can be changed | Enable error logging in the Kinesis Data Firehose console |
| Kinesis Data Streams | Log API calls for Kinesis data streams as events | CloudTrail | 15 minutes | Via CloudTrail, stored in an S3 bucket |
| Lambda | Events Logs: Memory Used, and the Billed Duration at the end of each invocation (otherwise not tracked by CW metrics) | Lambda CloudWatch | 5 seconds by default, can be changed | Logging statements in code (stdout) are pushed to a CloudWatch Log Group linked with the Lambda function. PutLogEvents: 5 requests per second per log stream (adds additional execution time)CloudWatch groups are generated whenever you create a new Lambda function. Alternatively, stream the data directly to Amazon’s hosted Elasticsearch via the CloudWatch Action configuration. Use CloudTrail Events to invoke a separate Lambda when a new CloudWatch log Group is created Avoid creating infinite invocation loops: Use CloudWatch subscriptions filter to ignore this type of log Custom metrics add to the execution time, and therefore user-facing latency Due to the AWS concurrent execution limitation, care must be taken to avoid reaching the limit with too many logging functions |
| Managed Streaming for Kafka – MSK | API calls | CloudTrail | 15 minutes | Via CloudTrail |
| RDS | RDS Database Log Files | RDS console, CLI, or API CloudWatch | Real-time | View & download DB instance logs from RDS Send logs to CloudWatch for analysis, storage, and more. |
| Redshift | Audit logs: Connection logs, user logs, user activity logs Service-level logs in CloudTrail | S3 CloudTrail | A few hours | Enable logging from the Redshift console, API, or CLI |
| Route 53 | DNS query data like domain or subdomain, DNS record type, edge location, response, date and time API calls with CloudTrail | CloudWatch CloudTrail | 5 seconds by default for DNS query logs, can be changed. 15 minutes for API calls | Configure Route 53 to send logs to CloudWatch Logs to an existing or new log group. Create a CloudTrail trail that tracks API calls and stores them in an S3 bucket. |
| S3 | Bucket-level changes logged by default Object-level changes not logged by default Service Access Logs | S3 | 1 hour | Turn on log delivery for the source S3 bucket, and enable permissions to store logs in the target S3 bucket |
| SNS | Amazon SNS Log File Entries: message delivery status, SNS endpoint response, and message dwell time Successful and unsuccessful SMS message deliveries Metrics API Calls | Metrics in CloudWatch API calls in CloudTrail | 5 minutes for metrics | Configure SNS Topic to send logs via Lambda to CloudWatch and apply an IAM role with permissions to give SNS write access to use CloudWatch Logs Create a Trail in CloudTrail to save data longer than default 90 days |
| SQS | API calls | CloudTrail | 15 minutes | Detailed monitoring (or one-minute metrics) is currently unavailable for Amazon SQS. |
| Step Functions | Metrics & events using CloudWatch API calls with CloudTrail | CloudWatch CloudTrail | 5 seconds for metrics and events 15 minutes for API calls | Configure Step Functions to send metrics and events to CloudWatch. Create a CloudTrail trail to track API calls to Step Functions. |
| STS | Successful requests to STS, who made the request, when it was made | CloudTrail | 15 minutes | Via Cloudtrail |
| Virtual Private Cloud (VPC) Logs | Monitor incoming/outgoing traffic flow by IP for the network interfaces with your resources E.g. Monitor rejected connections, many connections from the same IP, large data transfers, brute force RDP/SSH attack, blacklisted IPs, VPC, VPC Subnet, or Elastic Network Interface (ENI) | CloudWatch S3 Each Network Interface receives a unique log stream | 15 minutes | Setup per region Setup IAM Role with permissions to publish logs to S3 or the CloudWatch log group. Each ENI is processed in a Stream. Setup S3 bucket if storing in S3. Setup Log Group if storing in CloudWatch Choose “Create flow log” per Network Interface or VPC. Choose to send either to CloudWatch or to S3. |
| WAF | All AWS WAF rules that get triggered including the reason, and by which request | Via Amazon Kinesis Data Firehose | Near-real-time (configurable via buffer size and buffer interval) | Create delivery stream in Kinesis Enabling AWS WAF logging Select the Kinesis Data Firehose (within the same Region) that the logs should be delivered to Optionally configure the Kinesis stream to send the data to an S3 bucket for archiving Send to AWS Elasticsearch or Coralogix for analysis Coralogix provides a predefined Lambda function to forward your Kinesis stream straight to Coralogix. Consider redacting sensitive fields from logs before shipping. E.g. Cookies, Auth headers in Kinesis |

Within this blog post, we’re going to take a look at AWS Log Insights and cover some of the topics that you will find useful around…

AWS Lambda is a serverless compute service that runs your code in response to events and automatically manages the underlying compute resources for you. The code…

Amazon Web Services (AWS) introduced a preview of Timestream in November 2018 before releasing the full version in October 2020. AWS Timestream is a time series…
