3 Key Benefits to Web Log Analysis
Whether it’s Apache, Nginx, ILS, or anything else, web servers are at the core of online services, and web log monitoring and analysis can reveal a…

With dozens of microservices running on multiple production regions, getting to a point where any error log can be immediately identified and resolved feels like a distant dream. As an observability company, we at Coralogix are pedantic when it comes to any issue in one of our environments.
That’s why we are using an internal Coralogix account to monitor our development and production environments.
After experiencing a painful issue a few weeks ago, we started the process of adopting a zero-error policy on our team.
Preston de Guise first laid out his definition for a zero-error policy back in 2009 for data backups and protection. The policy soon gained popularity as a strategy for maintaining quality and reliability across all systems.
The three fundamental rules that de Guise lays out are:
Implementing a zero-error policy means that existing errors in the application should be prioritized over feature development and immediately addressed and solved.
Once an error has been identified, the impact needs to be analyzed. If the error does not have a real impact, it may be reclassified or marked as resolved, but such a decision should be weighed carefully after identification.
This brings us to the three components of maintaining a zero-error policy long-term:
Now, let’s take a look at how we used Coralogix to put a zero-error policy in place.
As part of the zero-error policy, we need to identify each error log of our owned services and then fix or reclassify it.
We started by clearing out existing errors such as internal timeouts, edge cases, and bugs and identified logs that could be deleted or reclassified as Info/Warning. This, together with defining relevant alerts, allowed us to reach a state where the zero-error policy can be applied.
Let’s take a closer look at how we used our Coralogix account to accomplish all of this hard work in just a few simple steps.
We preferred to adopt a fixed JSON format on all of our services, which easily supports multiline logs and contains all needed information as severity, class, method, and timestamp.
This also helps us take advantage of Coralogix’s automated parsing to sort, filter, group, and visualize any JSON parameter.
Using Coralogix Rules we can process, parse, and restructure log data to prepare for monitoring and analysis. We configured a few useful parsing rules such as “JSON Extract” for severity determination as well as “Extract” rules in order to rearrange 3rd-party logs.
Check out our Rules Cheat Sheet for helpful tips and tricks to get you started.
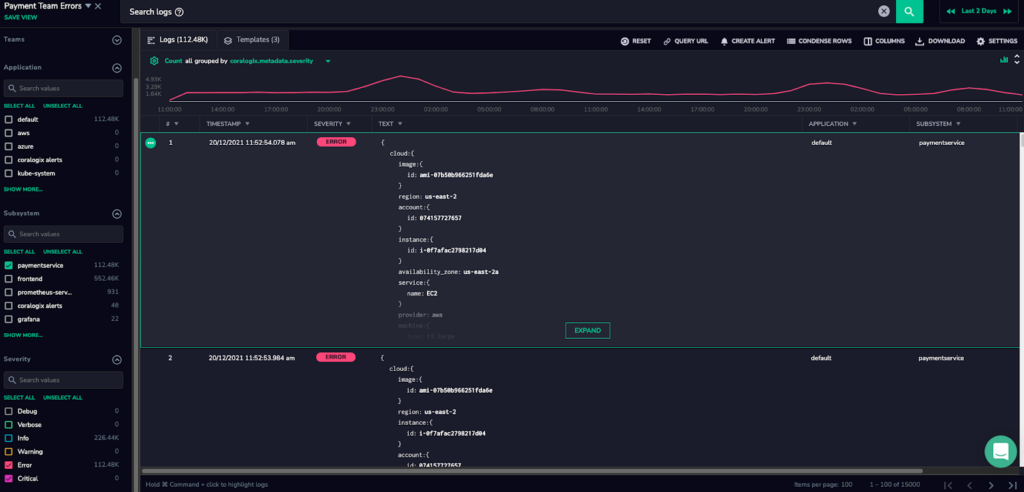
The Logs Screen is a powerful tool for investigating our data, and defining a Logs View helps us ensure that our team will be able to focus on the relevant logs for clean-up.
For example, the first Logs View that we defined filtered for Error and Critical level logs from our team’s applications and subsystems.
One of the existing errors that we tackled immediately was timeouts of internal HTTP requests between our services. For handling these kinds of errors, we improved the efficiency of SQL queries and in-memory calculations and adopted better configuration for our HTTP clients and servers.
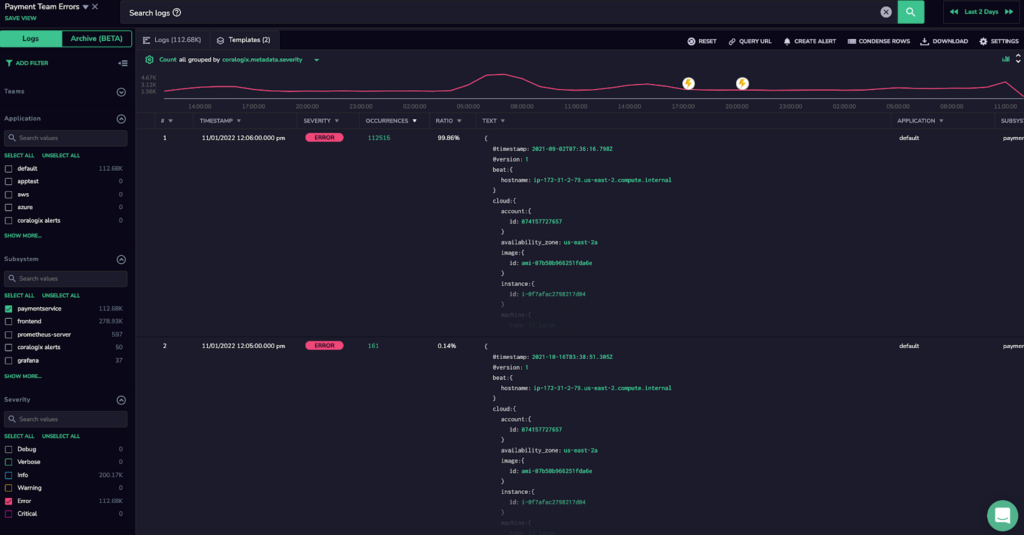
Using the Logs Screen to investigate issues, we rely on Coralogix’s Loggregation feature which deduplicates our noisy logs into more manageable templates. This way we can look at issues as a whole rather than individual log lines.
When we created our Log View, we were looking at more than 100K log errors, but many of those were from the same issue. Looking at the log templates, it was easy to see that only 2 issues were causing all of those errors, and we were able to immediately fix them and clear the service.
To really implement a zero-error policy, it’s important to stay on top of new errors as they come up. To do this with Coralogix, we created an alert directly from our Log View to be fired for the same filters with a summary of errors grouped by subsystem. We also defined an alert to be triggered immediately after each error.
Using our Webhook integration with Slack, we easily centralized these alert notifications in a dedicated Slack channel and added all relevant team members. Using Jira integration for Slack, we can also create Jira tickets for each encountered issue.
Known and non-urgent issues are filtered out from the alert, changed into Info/Warning severity, or deleted.
Check out our Alerts Tutorial for extra guidance and ideas.
Now, after each fix and deployment, we are immediately aware of its impact. When the error has been resolved, the alert will not be triggered anymore. If we add a fix that doesn’t work, we get additional alerts triggering for the same issue or may see another new issue that may have been accidentally added while fixing the first one.
After applying the steps above and ensuring our system is clear from errors, we have reached a state where we can immediately identify every new error and reduce the total number of alerts and bugs which affect our customers. After the first cleanup, our team’s number of high urgency incidents was reduced by 30%. That helped us to stay focused on our day-to-day work, with fewer interruptions resulting from urgent issues.
We’ve moved the notifications of the Coralogix alerts we created to our team channel, along with other defined Coralogix and Prometheus alerts. This was done in order to keep the engagement of the entire team on new errors and alerts and to facilitate maintaining the zero-error policy. Today, all alerts are being identified, assigned, and fixed by our team in a transparent and efficient way.
Whether it’s Apache, Nginx, ILS, or anything else, web servers are at the core of online services, and web log monitoring and analysis can reveal a…
The value of log files goes far beyond their traditional remit of diagnosing and troubleshooting issues reported in production. They provide a wealth of information about…
Observable and secure platforms use three connected data sets: logs, metrics, and traces. Platforms can link these data to alerting systems to notify system administrators when…