Last Updated: Apr. 07, 2024
This tutorial demonstrates how to conduct Snyk vulnerability monitoring with Coralogix by exporting Snyk’s security testing data using Prometheus .
Overview
This Docker was designed by the LunarTech team and was written in Go. This exporter enables you to automatically export Snyk’s security testing data into Prometheus by scraping Snyk’s API .
Prerequisites
Snyk Setup
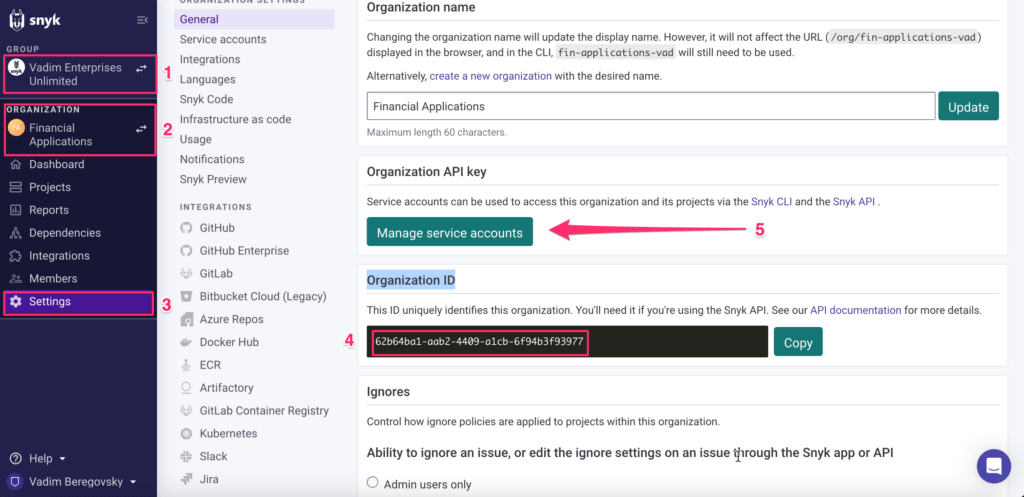
You are required to obtain your Organization ID and Organization API key in your Synk UI.
To obtain your Organization ID :
STEP 1 . In your left-hand sidebar, select your Synk Group.
STEP 2 . Select your Snyk Organization.
STEP 3 . Navigate to Settings .
STEP 4 . Copy your Organization ID.
To access your Organization API key :
STEP 5 . Complete STEPS 1-4 above, then click Manage service accounts .
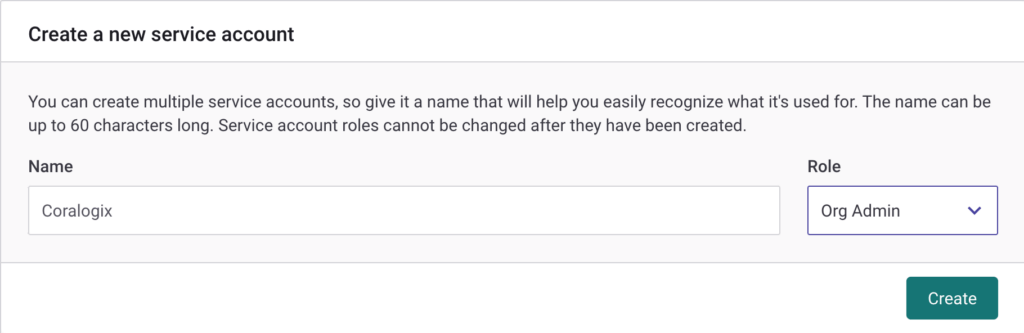
STEP 6 . Create a new service account and token for Coralogix.
Input Name & Role .
Click Create .
STEP 7 . Copy the Organization API key.
Configuration
STEP 1 . Run the docker command with the following arguments:
docker run -p9532:9532 [quay.io/lunarway/snyk_exporter](<http://quay.io/lunarway/snyk_exporter>) --snyk.api-token 'API TOKEN' --log.level="info" --snyk.organization='ORG ID’
The output should appear as follows:
time="2023-04-25T18:45:37Z" level=info msg="Starting Snyk exporter for organization '62b64ba1-aab2-4409-a1cb-6f94b3f93977'" source="main.go:67"
time="2023-04-25T18:45:37Z" level=info msg="Listening on :9532" source="main.go:111"
time="2023-04-25T18:45:37Z" level=info msg="Snyk API scraper starting" source="main.go:140"
time="2023-04-25T18:45:37Z" level=info msg="Running Snyk API scraper for organizations: Financial Applications" source="main.go:174"
time="2023-04-25T18:45:37Z" level=info msg="Collecting for organization 'Financial Applications'" source="main.go:196"
The Docker output should appear as follows:
time="2023-04-25T18:52:54Z" level=info msg="Recorded 585 results for organization 'Financial Applications'" source="main.go:205"
time="2023-04-25T18:52:54Z" level=info msg="Exposing 585 results as metrics" source="main.go:216"
STEP 2 . Update Prometheus RemoteWrite by following these instructions .
remote_write:
- url: <endpoint>
  name: '<customer_name>'
  remote_timeout: 120s
  bearer_token: '<Send_Your_Data_private_key>'
url: Select a Prometheus RemoteWrite endpoint URL for the domain associated with your Coralogix accountname: Name of the timeseries bearerToken: Your Coralogix Send-Your-Data API key
Validation
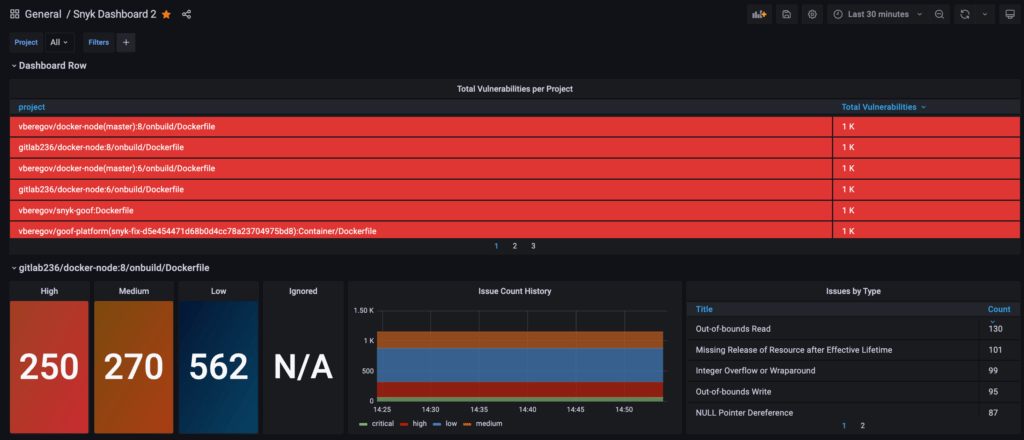
STEP 1 . Access the Coralogix Grafana instance to ensure metrics are being published and scraped. Query the snyk_vulnerabilities_total metric.
STEP 2 . Install the Grafana Snyk dashboard to obtain an overview of the data.
Additional Resources
Support
Need help?
Our world-class customer success team is available 24/7 to walk you through your setup and answer any questions that may come up.
Feel free to reach out to us via our in-app chat or by sending us an email at [email protected]
 Oh no!We didn’t find anything for “”,