[Live Webinar] Next-Level O11y: Why Every DevOps Team Needs a RUM Strategy Register today!

Back to All Docs

Synthetic Monitoring With Telegraf Synthetic Monitoring With Telegraf

Last Updated: Mar. 25, 2024

Synthetic monitoring is critical for identifying and resolving production events, as it allows companies to proactively monitor the availability and performance of their applications and websites. By simulating real user interactions with these systems, synthetic monitoring can help identify potential issues before they affect real users.

This guide outlines the steps required to use the Coralogix Telegraf integration to monitor response codes and response times of URLs and ship the metrics to Coralogix.

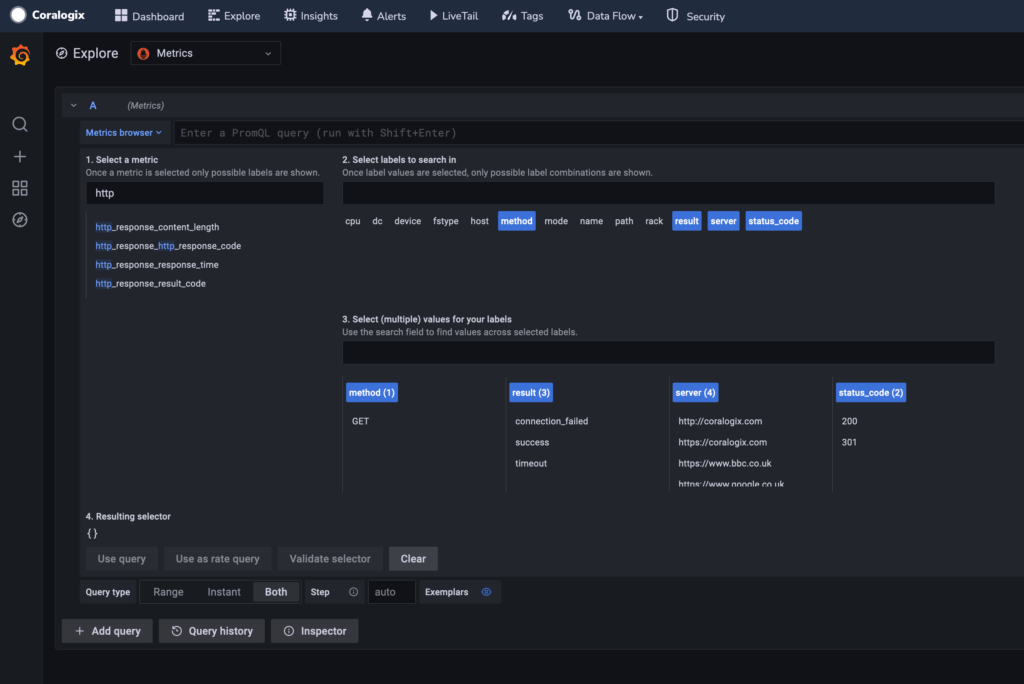
This configuration makes use of the Telegraf plugin inputs.http_response. This plugin allows you to provide a list of URLs to Telegraf which will then attempt to connect to each URL and provide the following metrics:

  • http_response_content_length
  • http_response_http_response_code
  • http_response_response_time
  • http_response_result_code

Prerequisites

1. Sign up for a Coralogix account. Set up your account on the Coralogix domain corresponding to the region within which you would like your data stored.

2. Install and configure Telegraf.

Configuration

1. Once you have configured Telegraf, add the following code into your configuration file:

[[inputs.http_response]]
  ## Server address (default http://localhost)
  urls = ["https://coralogix.com"]

  ## Set response_timeout (default 5 seconds)
  # response_timeout = "5s"

  ## Whether to follow redirects from the server (defaults to false)
  follow_redirects = true

You are required to input the following variables:

  • urls (line 3): Change the values within this list to the URLs that you wish to monitor.
  • response_timeout (line 6): If the URLs that are being monitored usually take longer than 5 seconds to respond, we recommend to uncomment this line and increase the timeout value.
  • follow_redirects (line 9): This instructs Telegraf to follow redirects. Setting this to false will disable this feature. Any URL that returns a redirect response code (e.g. 301 or 302) will not appear as ‘Up’.

Further information on the available values within this configuration block can be found here.

2. Once you have input the variables above, save the file and restart Telegraf. Telegraf will now start testing connectivity to the URLs and shipping the metrics to Coralogix.

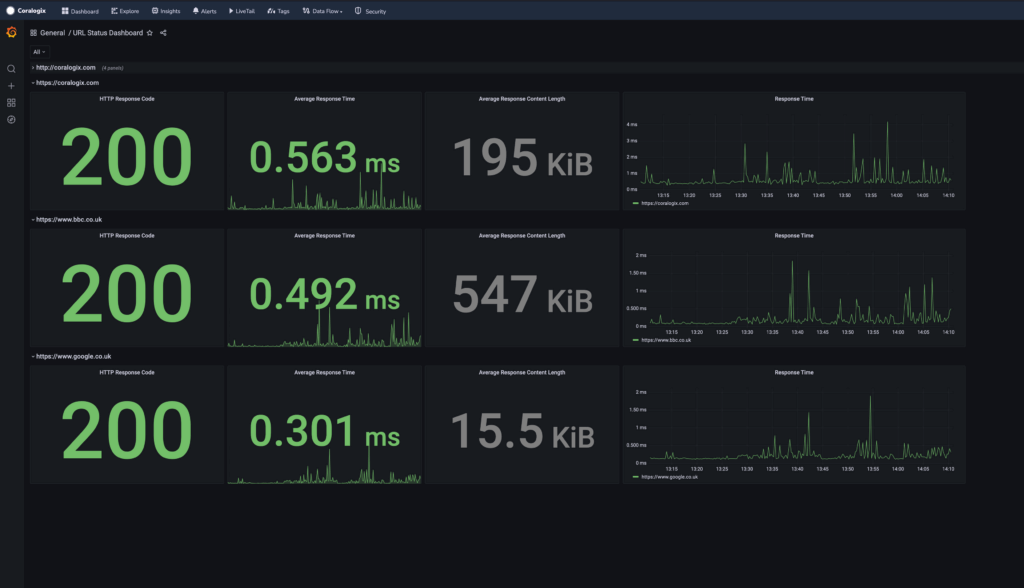
3. To loop over all monitored URLs and display metric data for each URL, upload the following Grafana Dashboard file to Coralogix hosted Grafana.

{
  "__inputs": [
    {
      "name": "DS_METRICS",
      "label": "Metrics",
      "description": "",
      "type": "datasource",
      "pluginId": "prometheus",
      "pluginName": "Prometheus"
    }
  ],
  "__requires": [
    {
      "type": "grafana",
      "id": "grafana",
      "name": "Grafana",
      "version": "8.2.6"
    },
    {
      "type": "datasource",
      "id": "prometheus",
      "name": "Prometheus",
      "version": "1.0.0"
    },
    {
      "type": "panel",
      "id": "stat",
      "name": "Stat",
      "version": ""
    },
    {
      "type": "panel",
      "id": "timeseries",
      "name": "Time series",
      "version": ""
    }
  ],
  "annotations": {
    "list": [
      {
        "builtIn": 1,
        "datasource": "-- Grafana --",
        "enable": true,
        "hide": true,
        "iconColor": "rgba(0, 211, 255, 1)",
        "name": "Annotations & Alerts",
        "target": {
          "limit": 100,
          "matchAny": false,
          "tags": [],
          "type": "dashboard"
        },
        "type": "dashboard"
      }
    ]
  },
  "editable": true,
  "fiscalYearStartMonth": 0,
  "gnetId": null,
  "graphTooltip": 0,
  "id": null,
  "iteration": 1670940529980,
  "links": [],
  "liveNow": false,
  "panels": [
    {
      "collapsed": true,
      "datasource": null,
      "gridPos": {
        "h": 1,
        "w": 24,
        "x": 0,
        "y": 0
      },
      "id": 2,
      "panels": [
        {
          "datasource": null,
          "fieldConfig": {
            "defaults": {
              "color": {
                "mode": "thresholds"
              },
              "mappings": [],
              "thresholds": {
                "mode": "absolute",
                "steps": [
                  {
                    "color": "green",
                    "value": null
                  },
                  {
                    "color": "#EAB839",
                    "value": 300
                  },
                  {
                    "color": "red",
                    "value": 400
                  }
                ]
              }
            },
            "overrides": []
          },
          "gridPos": {
            "h": 8,
            "w": 4,
            "x": 0,
            "y": 1
          },
          "id": 4,
          "options": {
            "colorMode": "value",
            "graphMode": "none",
            "justifyMode": "auto",
            "orientation": "auto",
            "reduceOptions": {
              "calcs": [
                "lastNotNull"
              ],
              "fields": "",
              "values": false
            },
            "text": {},
            "textMode": "auto"
          },
          "pluginVersion": "8.2.6",
          "repeat": null,
          "targets": [
            {
              "exemplar": true,
              "expr": "http_response_http_response_code{server=~\"$url\"}",
              "format": "table",
              "instant": false,
              "interval": "",
              "legendFormat": "$url",
              "refId": "A"
            }
          ],
          "title": "HTTP Response Code",
          "transformations": [],
          "type": "stat"
        },
        {
          "datasource": null,
          "fieldConfig": {
            "defaults": {
              "color": {
                "mode": "thresholds"
              },
              "mappings": [],
              "thresholds": {
                "mode": "absolute",
                "steps": [
                  {
                    "color": "green",
                    "value": null
                  },
                  {
                    "color": "red",
                    "value": 80
                  }
                ]
              },
              "unit": "ms"
            },
            "overrides": []
          },
          "gridPos": {
            "h": 8,
            "w": 4,
            "x": 4,
            "y": 1
          },
          "id": 25,
          "options": {
            "colorMode": "value",
            "graphMode": "area",
            "justifyMode": "auto",
            "orientation": "auto",
            "reduceOptions": {
              "calcs": [
                "lastNotNull"
              ],
              "fields": "",
              "values": false
            },
            "text": {},
            "textMode": "auto"
          },
          "pluginVersion": "8.2.6",
          "targets": [
            {
              "exemplar": true,
              "expr": "avg(http_response_response_time{server=~\"$url\"})",
              "interval": "",
              "legendFormat": "",
              "refId": "A"
            }
          ],
          "title": "Average Response Time",
          "type": "stat"
        },
        {
          "datasource": null,
          "fieldConfig": {
            "defaults": {
              "color": {
                "mode": "fixed"
              },
              "mappings": [],
              "thresholds": {
                "mode": "absolute",
                "steps": [
                  {
                    "color": "green",
                    "value": null
                  }
                ]
              },
              "unit": "bytes"
            },
            "overrides": []
          },
          "gridPos": {
            "h": 8,
            "w": 4,
            "x": 8,
            "y": 1
          },
          "id": 23,
          "options": {
            "colorMode": "value",
            "graphMode": "none",
            "justifyMode": "auto",
            "orientation": "auto",
            "reduceOptions": {
              "calcs": [
                "lastNotNull"
              ],
              "fields": "",
              "values": false
            },
            "text": {},
            "textMode": "auto"
          },
          "pluginVersion": "8.2.6",
          "targets": [
            {
              "exemplar": true,
              "expr": "avg( http_response_content_length{server=~\"$url\"})",
              "interval": "",
              "legendFormat": "$url",
              "refId": "A"
            }
          ],
          "title": "Average Response Content Length",
          "type": "stat"
        },
        {
          "datasource": null,
          "fieldConfig": {
            "defaults": {
              "color": {
                "mode": "palette-classic"
              },
              "custom": {
                "axisLabel": "",
                "axisPlacement": "auto",
                "barAlignment": 0,
                "drawStyle": "line",
                "fillOpacity": 0,
                "gradientMode": "none",
                "hideFrom": {
                  "legend": false,
                  "tooltip": false,
                  "viz": false
                },
                "lineInterpolation": "linear",
                "lineWidth": 1,
                "pointSize": 5,
                "scaleDistribution": {
                  "type": "linear"
                },
                "showPoints": "auto",
                "spanNulls": false,
                "stacking": {
                  "group": "A",
                  "mode": "none"
                },
                "thresholdsStyle": {
                  "mode": "off"
                }
              },
              "mappings": [],
              "thresholds": {
                "mode": "absolute",
                "steps": [
                  {
                    "color": "green",
                    "value": null
                  },
                  {
                    "color": "red",
                    "value": 80
                  }
                ]
              },
              "unit": "ms"
            },
            "overrides": []
          },
          "gridPos": {
            "h": 8,
            "w": 7,
            "x": 12,
            "y": 1
          },
          "id": 12,
          "options": {
            "legend": {
              "calcs": [],
              "displayMode": "list",
              "placement": "bottom"
            },
            "tooltip": {
              "mode": "single"
            }
          },
          "targets": [
            {
              "exemplar": true,
              "expr": "http_response_response_time{server=~\"$url\"}",
              "format": "time_series",
              "interval": "",
              "legendFormat": "$url",
              "refId": "A"
            }
          ],
          "title": "Response Time",
          "type": "timeseries"
        }
      ],
      "repeat": "url",
      "title": "$url",
      "type": "row"
    }
  ],
  "schemaVersion": 32,
  "style": "dark",
  "tags": [],
  "templating": {
    "list": [
      {
        "allValue": null,
        "current": {},
        "datasource": "${DS_METRICS}",
        "definition": "label_values(server)",
        "description": null,
        "error": null,
        "hide": 1,
        "includeAll": true,
        "label": null,
        "multi": false,
        "name": "url",
        "options": [],
        "query": {
          "query": "label_values(server)",
          "refId": "StandardVariableQuery"
        },
        "refresh": 2,
        "regex": "",
        "skipUrlSync": false,
        "sort": 0,
        "type": "query"
      }
    ]
  },
  "time": {
    "from": "now-1h",
    "to": "now"
  },
  "timepicker": {},
  "timezone": "",
  "title": "URL Status Dashboard",
  "uid": "49vJ1HcVz",
  "version": 5
}

Your dashboard should then appear as follows:

Support

Need help?

Our world-class customer success team is available 24/7 to walk you through your setup and answer any questions that may come up.

Feel free to reach out to us via our in-app chat or by sending us an email to [email protected].

On this page

Live Webinar
Next-Level O11y: Why Every DevOps Team Needs a RUM Strategy
April 30th at 12pm ET | 6pm CET
Save my Seat