If you’re sending logs to Coralogix using one of our integrations and the logs are not appearing in your Coralogix UI, here are a few common ways to troubleshoot your data collection.
Common Reasons for Logs Not Appearing
Block Rules – Check whether your data is being blocked by any block rules set in your account under the Settings Menu –> Rules or under Settings –> Quota Usage Optimizer (note that these tabs are available in the settings menu only for the account administrator).
Company ID – Some integrations (e.g. Filebeat) also require a company ID. You can find it in the same place as the Elasticsearch API Key: Settings Menu –> Send Your Logs tab.
Filters – Check if you have any active filters applied in the Coralogix app (e.g. On the top-right for LiveTail or on the left panel in the Logs screen view or the Application/Subsystem dropdowns on the top right of some screens)
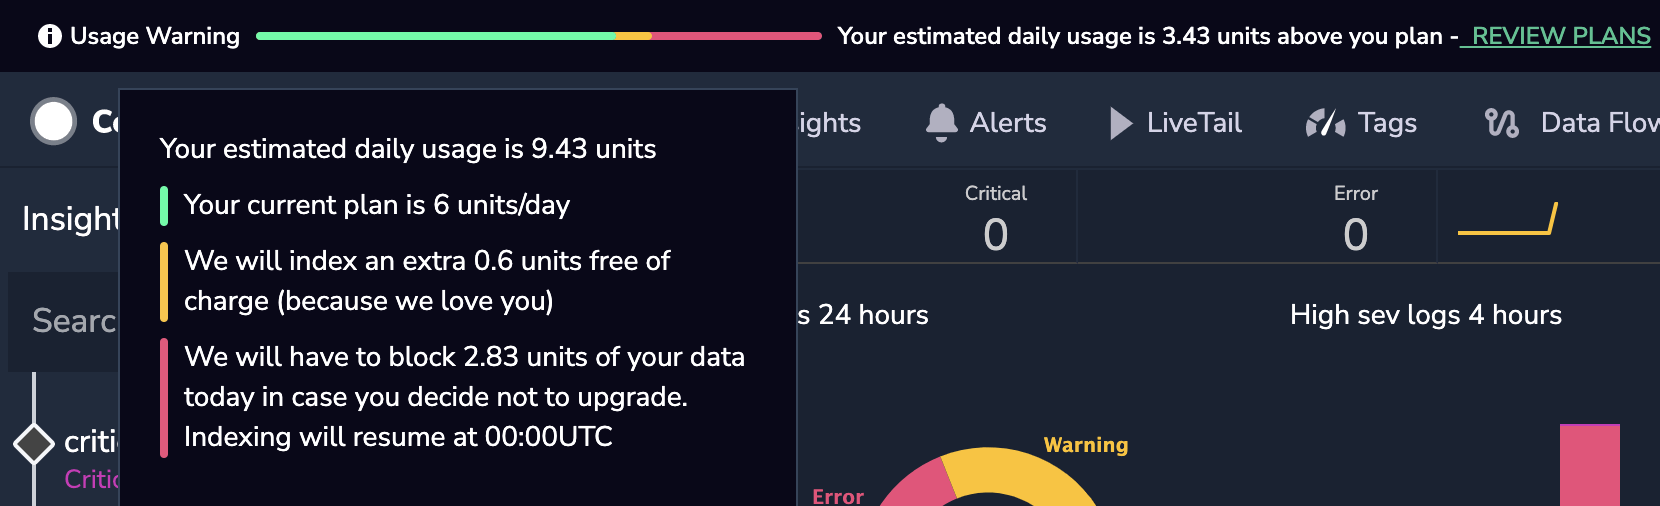
Reaching Quota – Check the Coralogix dashboard to see if the account reached its daily quota. If your quota has been reached, you’ll see a message on the top of the screen displaying a quota usage warning (sometimes a hard browser refresh is required to see the message).
Status Page – Check out the Coralogix status page here. You can also subscribe to it to get live notifications to your email in case there are any issues with our platform.
Your Logs – Check your logs and verify that you’re sending all mandatory metadata fields like applicationName, subsystemName, severity, log text (string or JSON) and ensure timestamp are not older than 24H or later than 24H in the future.
Connectivity Issues
The next recommended step is to make sure your service host can connect to the Coralogix endpoint. You can easily check connectivity from your service host, using Resolve-DnsName (powershell) or nslookup command to see if you are able to resolve the DNS and then use the telnet command (powershell) from any windows based environment or the netcat command in Linux (you can also use telnet if installed on your Linux host).
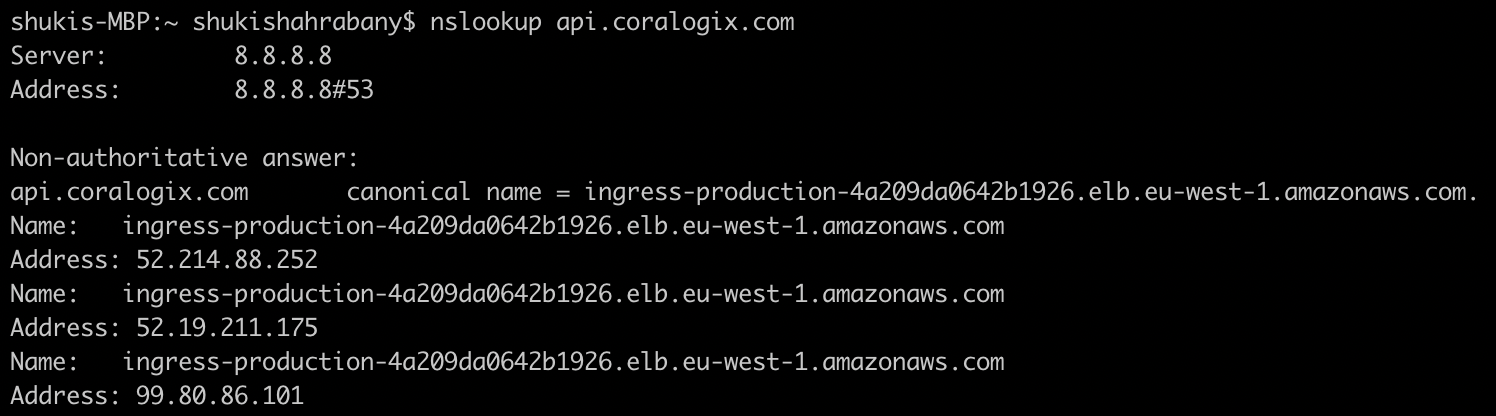
STEP 1. Check DNS resolution
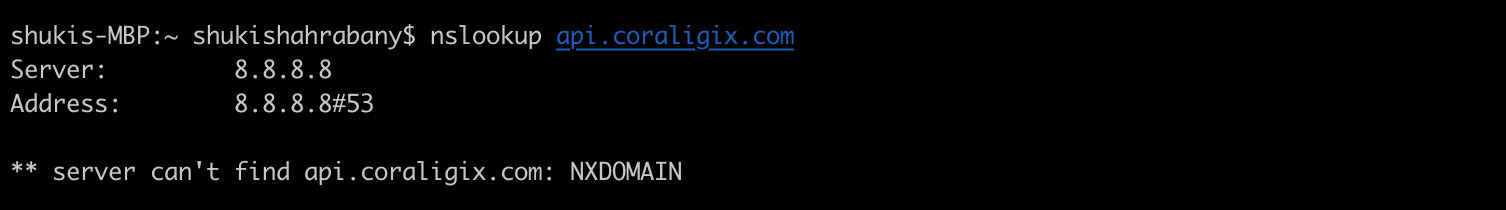
e.g. nslookup api.coralogix.com or Resolve-DnsName api.coralogix.com This is the expected result if it succeeds:

The expected result if it failed:
STEP 2. Check Connectivity
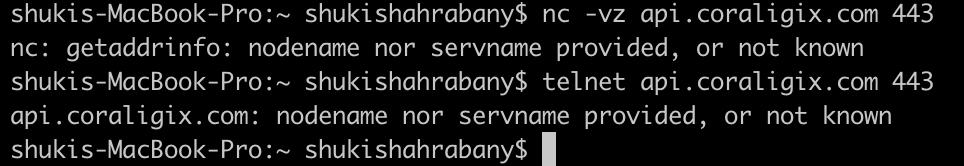
e.g. nc -vz api.coralogix.com 443 or telnet api.coralogix.com 443 If successful, the expected result will be:
If there is no connectivity you will see the following line in your CLI: "Connecting To api.coralogix.com… Could not open a connection to the host, on port 443: Connect failed" or it will look like the following:
STEP 3. If you cannot open a connection, ensure the following Coralogix IP addresses are whitelisted in your Firewall.
Region
IP Address
Europe
52.19.211.175 52.214.88.252 99.80.86.101
India
35.154.21.106 15.207.138.190 15.207.123.81
US
3.132.4.30 18.189.166.99 3.140.173.20
Check the Firewall for proper unblocking endpoints listed here.
Notes
*** Resolve-DnsName and nslookup are command-line tools that let you test and troubleshoot Domain Name System resolution.
*** Telnet (similar to the netcat command) is a protocol to provide communication over the Internet or a LAN using a virtual terminal connection. It is installed by default on Linux and older Mac operating systems, but must be installed on Windows and macOS High Sierra 10.13 and later.
*** Note that if you are using an integration that is based on UDP then netcat won’t help you, but you can check if you can resolve DNS.
File Shippers
A common integration type amongst our customers is file shipper. These are easy to use and can send logs from multiple sources. Here we’ll cover some common issues when working with FluentD, Logstash, and Filebeat.
Check your log-shipper’s logs to see if any error occurred that indicates an unsuccessful integration. Check your log-shipper’s docs to find the location of these system logs. For example, if you’re using Logstash or FluentD (with td-agent installation) you can find these logs at /var/log/logstash/logstash.log or /var/log/td-agent/td-agent.log respectively.
Common issues you can identify with these log-shipper logs:
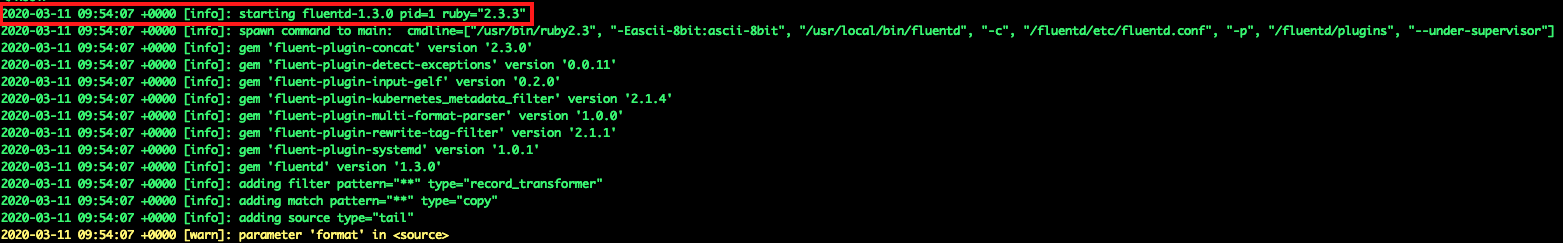
When starting FluentD you should check in FluentD logs to see if it started running, here is how it looks:
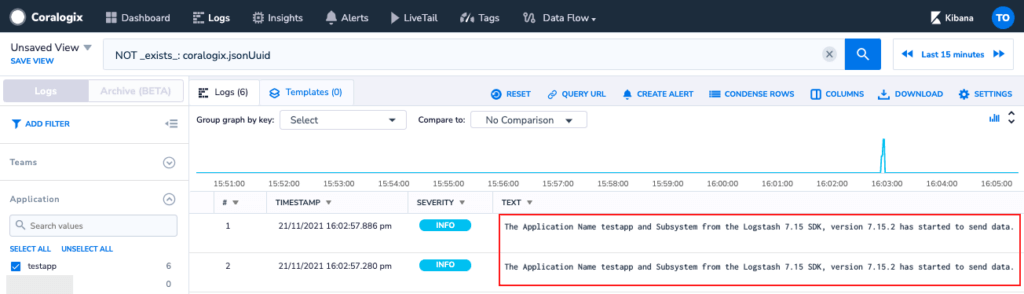
If the integration is working you should already be able to see this logline appear in Coralogix. If you are not seeing such logs, it’s probably related with an issue in the fluentd.conf:
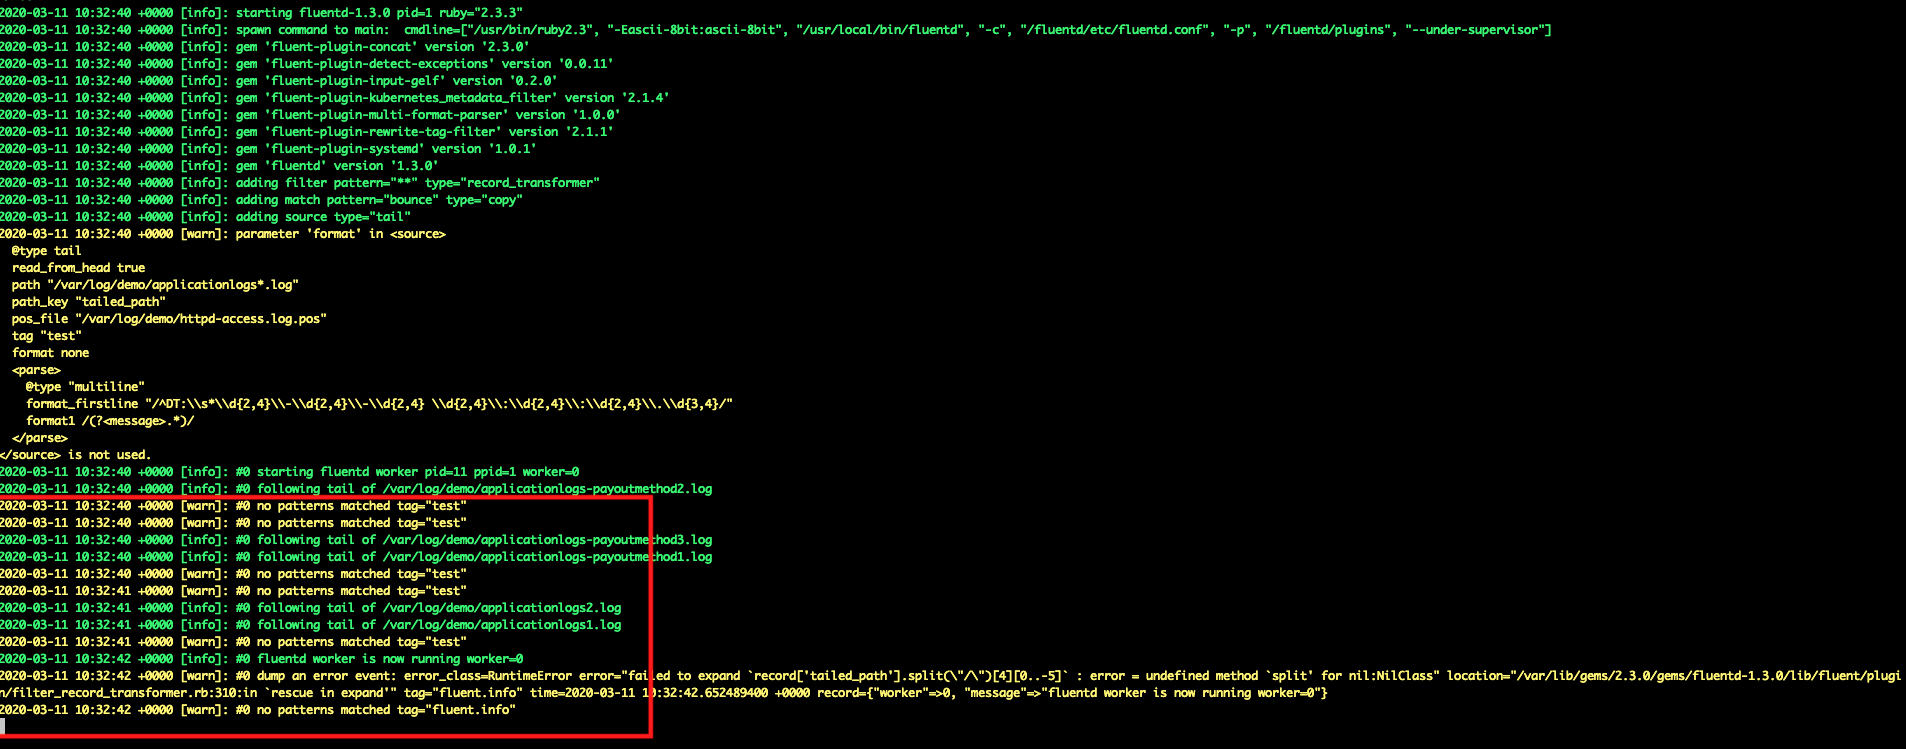
Coralogix output <match ‘tag’> must include the log sources tag, hence <match **> works, Changing to something else that is not a wildcard or specific tag will result with the following error within Fluentd logs and the log files won’t be sent:
Parsing issues can also cause logs to not appear in Coralogix. Any failed parse patterns or multiline patterns will potentially drop your logs so you will not see them being sent to us.
Filebeat
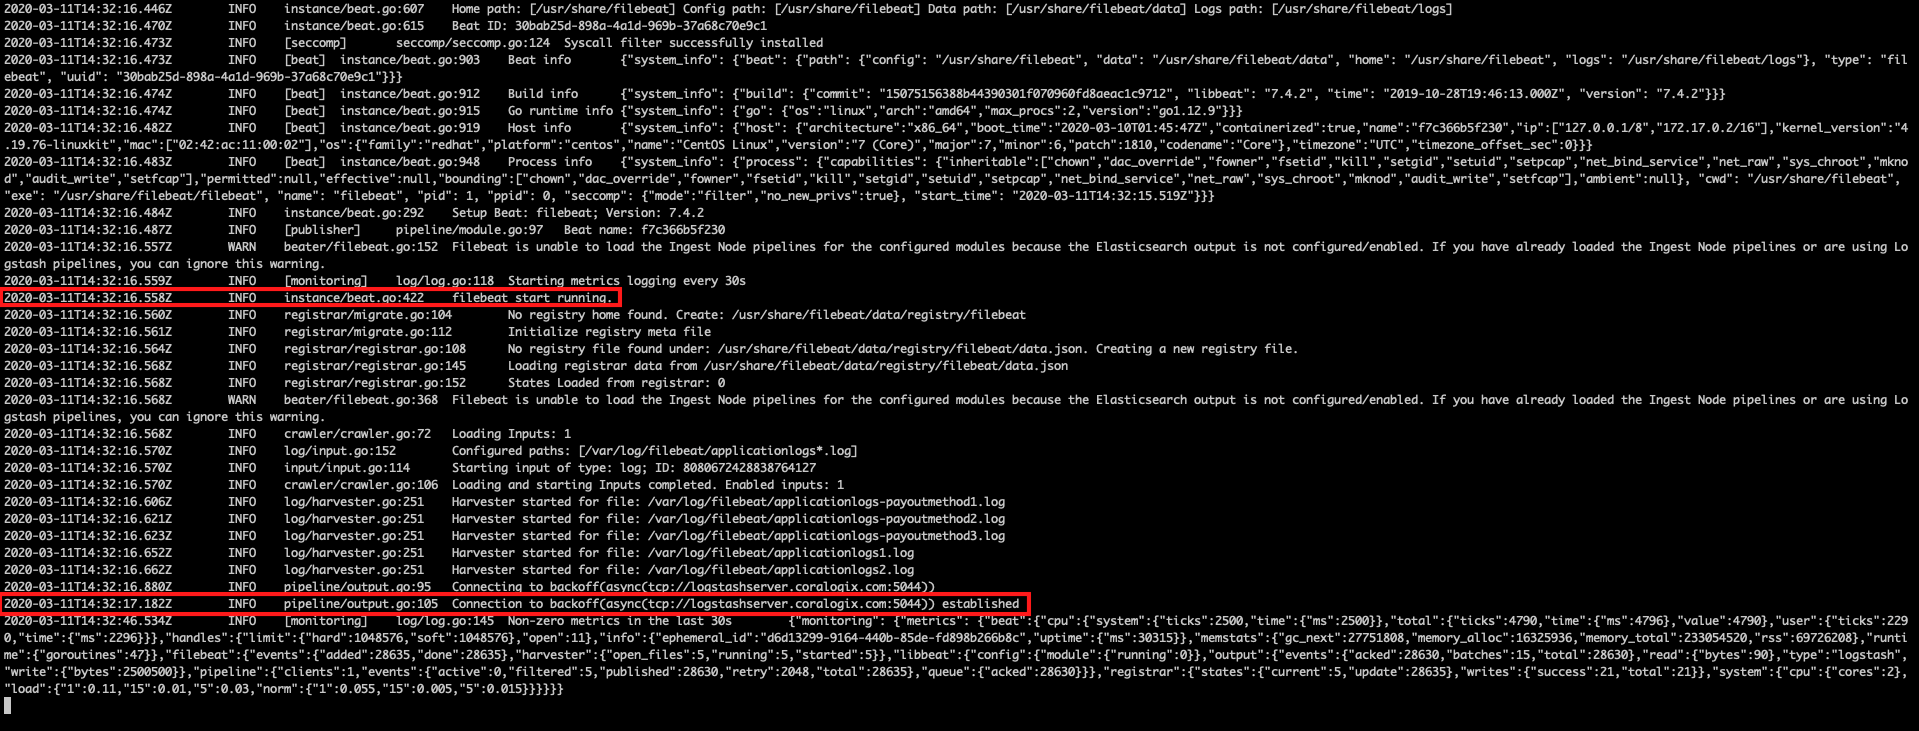
When running Filebeat in your CLI , you should see similar lines to these ones, mentioning that Filebeat is running and a connection was established:
“2020-03-11T14:32:16.558Z INFO instance/beat.go:422 filebeat start running.”
“2020-03-11T14:32:17.182Z INFO pipeline/output.go:105 Connection to backoff(async(tcp://logstashserver.coralogix.com:5044)) established”
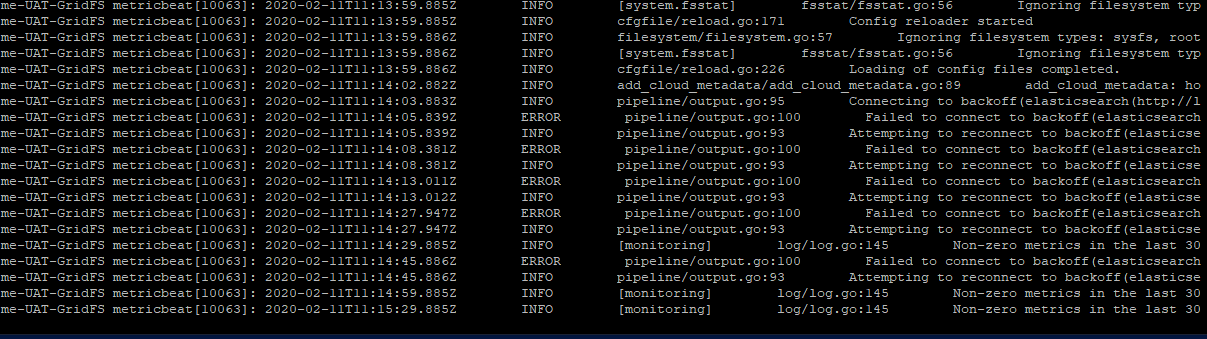
When there is no connection it will look like this:
If you are not seeing your logs and you do manage to connect to our Logstash server, it is probably related to an issue in the Filebeat YAML file. Possible issues can be a bad stated file path, wrong multiline pattern, wrong company Id or private key. Another possible cause of the issue is when choosing to use the encrypted connection option with port 5015 but not stating the certificates or adding them with a wrong path in the YAML file.
To verify that configuration syntax is okay
filebeat test config
To verify that the endpoint is reachable
filebeat test output
Logstash
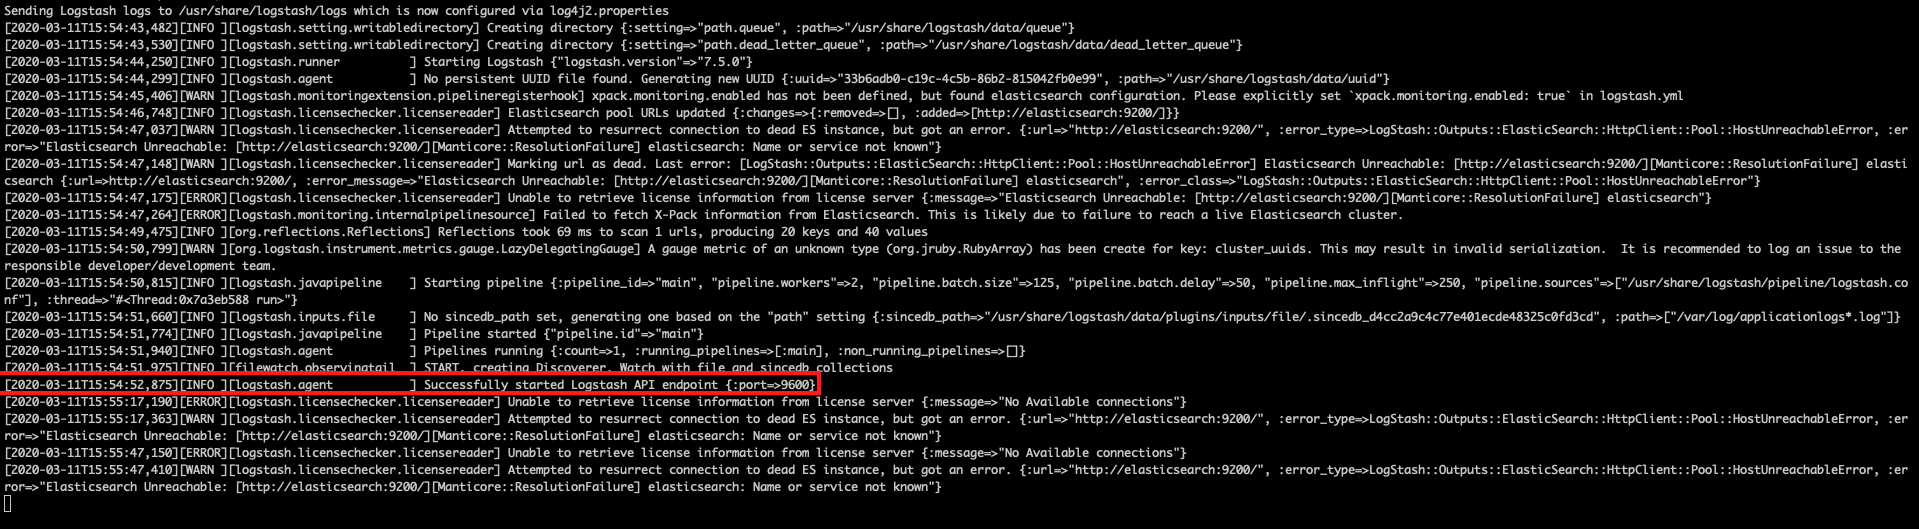
When starting Logstash you should check in Logstash logs if it started running, here is how it looks:
If the integration is working you should already be able to notice this logline in Coralogix, if you are not seeing such a log it is probably due to an issue with the logstash.conf:
If you can’t find your logs, go to your Logstash logs and check for any error that might occur and fix your configuration. You can always go for a more “thinner” configuration to start debugging your config file.
SDK and AWS Lambdas
Common issues:
Verify that you are running on the latest versions and check our Integration page.
If you are sending with SDKs just a few logs and your program immediately shuts down and you are not seeing them in Coralogix, you’ll need to add some wait time of 1-2 seconds before closing your application.
Heroku
When provisioning the Coralogix addon to your Heroku application, all your application and infrastructure logs will feed right into Coralogix within seconds.
In case you don’t see your logs in the Coralogix LiveTail screen, try tailing your Heroku drains to see if they are showing your logs.
L10 Errors on Heroku
L10 errors occur when a consumer Heroku drain isn’t able to send all the data in a timely manner. As explained by Heroku, when the number of log messages being generated is temporarily exceeding the rate at which they can be received by a drain consumer, Heroku’s Logplex logging system discards some messages in order to handle the rate difference. If you encounter L10 errors, you probably should check with Heroku’s support. You can find more information on L10 here.
Since Coralogix reads data directly from your Heroku drain, if data doesn’t reach the drain due to L10 errors, Coralogix won’t receive that data.
If you experience any other issue, you can also check the Heroku status page for further info.
Support
Need help?
Our world-class customer success team is available 24/7 to answer any questions that may come up.
Feel free to reach out to us via our in-app chat or by sending us an email at [email protected].
 Oh no!We didn’t find anything for “”,

 If there is